Free Statistics

of Irreproducible Research!

Author's title

Author*The author of this computation has been verified*
R Software Modulerwasp_autocorrelation.wasp
Title produced by software(Partial) Autocorrelation Function
Date of computationSun, 21 Dec 2008 11:22:18 -0700
Cite this page as followsStatistical Computations at FreeStatistics.org, Office for Research Development and Education, URL https://freestatistics.org/blog/index.php?v=date/2008/Dec/21/t1229883809uvc5bum5nfrgofh.htm/, Retrieved Sun, 26 May 2024 01:35:50 +0000
Statistical Computations at FreeStatistics.org, Office for Research Development and Education, URL https://freestatistics.org/blog/index.php?pk=35732, Retrieved Sun, 26 May 2024 01:35:50 +0000
QR Codes:

Original text written by user:
IsPrivate?No (this computation is public)
User-defined keywords
Estimated Impact126
Family? (F = Feedback message, R = changed R code, M = changed R Module, P = changed Parameters, D = changed Data)
-     [(Partial) Autocorrelation Function] [ACF Energie] [2008-12-21 17:30:48] [dff692ae32125bdbbfc005d665e23b83]
-   PD    [(Partial) Autocorrelation Function] [ACF Energie 0] [2008-12-21 18:22:18] [9c9e716fef59bf95ba5b3e37a9a90be4] [Current]
Feedback Forum

Post a new message
Dataseries X:
95.1
95.9
95.9
96.9
95.7
97.8
95.9
98.2
101.2
106.8
108.2
108.2
113.2
115.2
122
119.8
119.8
112.7
113.8
118.6
119.2
118.1
121.6
125.3
126.5
133.6
136.5
131.9
131.9
139.3
139.9
140.1
142.1
141.8
143.5
143.6
140.6
137.4
133.9
134.6
134.6
132.1
132.5
134.1
135.1
136.4
136.6
138.1
138.4
141
144.9
153.4
156.5
160.7
163.9
166.7
169.7
174.3
181.8
187.8
182.4


Summary of computational transaction
Raw Inputview raw input (R code)
Raw Outputview raw output of R engine
Computing time1 seconds
R Server'George Udny Yule' @ 72.249.76.132

\begin{tabular}{lllllllll}
\hline
Summary of computational transaction \tabularnewline
Raw Input & view raw input (R code)  \tabularnewline
Raw Output & view raw output of R engine  \tabularnewline
Computing time & 1 seconds \tabularnewline
R Server & 'George Udny Yule' @ 72.249.76.132 \tabularnewline
\hline
\end{tabular}
%Source: https://freestatistics.org/blog/index.php?pk=35732&T=0

[TABLE]
[ROW][C]Summary of computational transaction[/C][/ROW]
[ROW][C]Raw Input[/C][C]view raw input (R code) [/C][/ROW]
[ROW][C]Raw Output[/C][C]view raw output of R engine [/C][/ROW]
[ROW][C]Computing time[/C][C]1 seconds[/C][/ROW]
[ROW][C]R Server[/C][C]'George Udny Yule' @ 72.249.76.132[/C][/ROW]
[/TABLE]
Source: https://freestatistics.org/blog/index.php?pk=35732&T=0

Globally Unique Identifier (entire table): ba.freestatistics.org/blog/index.php?pk=35732&T=0

As an alternative you can also use a QR Code:  

The GUIDs for individual cells are displayed in the table below:

Summary of computational transaction
Raw Inputview raw input (R code)
Raw Outputview raw output of R engine
Computing time1 seconds
R Server'George Udny Yule' @ 72.249.76.132


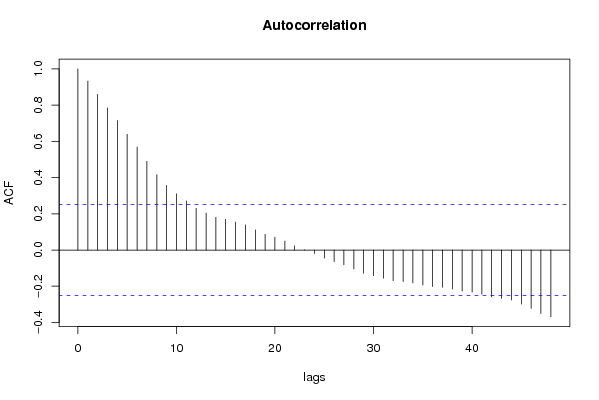
Autocorrelation Function
Time lag kACF(k)T-STATP-value
10.933387.28990
20.8589496.70860
30.78456.12710
40.7149065.58360
50.6397664.99673e-06
60.5683154.43871.9e-05
70.4901373.82810.000153
80.4161843.25050.000939
90.3567132.7860.00355
100.3102992.42350.009176
110.271132.11760.019147
120.2306921.80180.038262
130.2041011.59410.058044
140.1807531.41170.081556
150.1695781.32440.095148
160.1542821.2050.116432
170.1389151.0850.141105
180.1108850.8660.19493
190.0867220.67730.250381
200.0711580.55580.290203
210.0497470.38850.349487
220.0232150.18130.428361
230.0012350.00960.496166
24-0.019735-0.15410.439006
25-0.044198-0.34520.365567
26-0.063983-0.49970.309535
27-0.081592-0.63730.263171
28-0.104326-0.81480.209176
29-0.128177-1.00110.160368
30-0.141629-1.10620.136502
31-0.155409-1.21380.114755
32-0.169524-1.3240.095217
33-0.174297-1.36130.089213
34-0.181471-1.41730.080736
35-0.192592-1.50420.068846
36-0.201561-1.57420.060302
37-0.206235-1.61080.056199
38-0.21547-1.68290.048756
39-0.225725-1.7630.041457
40-0.232998-1.81980.03685
41-0.243979-1.90550.030713
42-0.258379-2.0180.023997
43-0.267567-2.08980.020408
44-0.276467-2.15930.017385
45-0.298522-2.33150.011522
46-0.321817-2.51350.007306
47-0.350182-2.7350.004078
48-0.367922-2.87360.002789

\begin{tabular}{lllllllll}
\hline
Autocorrelation Function \tabularnewline
Time lag k & ACF(k) & T-STAT & P-value \tabularnewline
1 & 0.93338 & 7.2899 & 0 \tabularnewline
2 & 0.858949 & 6.7086 & 0 \tabularnewline
3 & 0.7845 & 6.1271 & 0 \tabularnewline
4 & 0.714906 & 5.5836 & 0 \tabularnewline
5 & 0.639766 & 4.9967 & 3e-06 \tabularnewline
6 & 0.568315 & 4.4387 & 1.9e-05 \tabularnewline
7 & 0.490137 & 3.8281 & 0.000153 \tabularnewline
8 & 0.416184 & 3.2505 & 0.000939 \tabularnewline
9 & 0.356713 & 2.786 & 0.00355 \tabularnewline
10 & 0.310299 & 2.4235 & 0.009176 \tabularnewline
11 & 0.27113 & 2.1176 & 0.019147 \tabularnewline
12 & 0.230692 & 1.8018 & 0.038262 \tabularnewline
13 & 0.204101 & 1.5941 & 0.058044 \tabularnewline
14 & 0.180753 & 1.4117 & 0.081556 \tabularnewline
15 & 0.169578 & 1.3244 & 0.095148 \tabularnewline
16 & 0.154282 & 1.205 & 0.116432 \tabularnewline
17 & 0.138915 & 1.085 & 0.141105 \tabularnewline
18 & 0.110885 & 0.866 & 0.19493 \tabularnewline
19 & 0.086722 & 0.6773 & 0.250381 \tabularnewline
20 & 0.071158 & 0.5558 & 0.290203 \tabularnewline
21 & 0.049747 & 0.3885 & 0.349487 \tabularnewline
22 & 0.023215 & 0.1813 & 0.428361 \tabularnewline
23 & 0.001235 & 0.0096 & 0.496166 \tabularnewline
24 & -0.019735 & -0.1541 & 0.439006 \tabularnewline
25 & -0.044198 & -0.3452 & 0.365567 \tabularnewline
26 & -0.063983 & -0.4997 & 0.309535 \tabularnewline
27 & -0.081592 & -0.6373 & 0.263171 \tabularnewline
28 & -0.104326 & -0.8148 & 0.209176 \tabularnewline
29 & -0.128177 & -1.0011 & 0.160368 \tabularnewline
30 & -0.141629 & -1.1062 & 0.136502 \tabularnewline
31 & -0.155409 & -1.2138 & 0.114755 \tabularnewline
32 & -0.169524 & -1.324 & 0.095217 \tabularnewline
33 & -0.174297 & -1.3613 & 0.089213 \tabularnewline
34 & -0.181471 & -1.4173 & 0.080736 \tabularnewline
35 & -0.192592 & -1.5042 & 0.068846 \tabularnewline
36 & -0.201561 & -1.5742 & 0.060302 \tabularnewline
37 & -0.206235 & -1.6108 & 0.056199 \tabularnewline
38 & -0.21547 & -1.6829 & 0.048756 \tabularnewline
39 & -0.225725 & -1.763 & 0.041457 \tabularnewline
40 & -0.232998 & -1.8198 & 0.03685 \tabularnewline
41 & -0.243979 & -1.9055 & 0.030713 \tabularnewline
42 & -0.258379 & -2.018 & 0.023997 \tabularnewline
43 & -0.267567 & -2.0898 & 0.020408 \tabularnewline
44 & -0.276467 & -2.1593 & 0.017385 \tabularnewline
45 & -0.298522 & -2.3315 & 0.011522 \tabularnewline
46 & -0.321817 & -2.5135 & 0.007306 \tabularnewline
47 & -0.350182 & -2.735 & 0.004078 \tabularnewline
48 & -0.367922 & -2.8736 & 0.002789 \tabularnewline
\hline
\end{tabular}
%Source: https://freestatistics.org/blog/index.php?pk=35732&T=1

[TABLE]
[ROW][C]Autocorrelation Function[/C][/ROW]
[ROW][C]Time lag k[/C][C]ACF(k)[/C][C]T-STAT[/C][C]P-value[/C][/ROW]
[ROW][C]1[/C][C]0.93338[/C][C]7.2899[/C][C]0[/C][/ROW]
[ROW][C]2[/C][C]0.858949[/C][C]6.7086[/C][C]0[/C][/ROW]
[ROW][C]3[/C][C]0.7845[/C][C]6.1271[/C][C]0[/C][/ROW]
[ROW][C]4[/C][C]0.714906[/C][C]5.5836[/C][C]0[/C][/ROW]
[ROW][C]5[/C][C]0.639766[/C][C]4.9967[/C][C]3e-06[/C][/ROW]
[ROW][C]6[/C][C]0.568315[/C][C]4.4387[/C][C]1.9e-05[/C][/ROW]
[ROW][C]7[/C][C]0.490137[/C][C]3.8281[/C][C]0.000153[/C][/ROW]
[ROW][C]8[/C][C]0.416184[/C][C]3.2505[/C][C]0.000939[/C][/ROW]
[ROW][C]9[/C][C]0.356713[/C][C]2.786[/C][C]0.00355[/C][/ROW]
[ROW][C]10[/C][C]0.310299[/C][C]2.4235[/C][C]0.009176[/C][/ROW]
[ROW][C]11[/C][C]0.27113[/C][C]2.1176[/C][C]0.019147[/C][/ROW]
[ROW][C]12[/C][C]0.230692[/C][C]1.8018[/C][C]0.038262[/C][/ROW]
[ROW][C]13[/C][C]0.204101[/C][C]1.5941[/C][C]0.058044[/C][/ROW]
[ROW][C]14[/C][C]0.180753[/C][C]1.4117[/C][C]0.081556[/C][/ROW]
[ROW][C]15[/C][C]0.169578[/C][C]1.3244[/C][C]0.095148[/C][/ROW]
[ROW][C]16[/C][C]0.154282[/C][C]1.205[/C][C]0.116432[/C][/ROW]
[ROW][C]17[/C][C]0.138915[/C][C]1.085[/C][C]0.141105[/C][/ROW]
[ROW][C]18[/C][C]0.110885[/C][C]0.866[/C][C]0.19493[/C][/ROW]
[ROW][C]19[/C][C]0.086722[/C][C]0.6773[/C][C]0.250381[/C][/ROW]
[ROW][C]20[/C][C]0.071158[/C][C]0.5558[/C][C]0.290203[/C][/ROW]
[ROW][C]21[/C][C]0.049747[/C][C]0.3885[/C][C]0.349487[/C][/ROW]
[ROW][C]22[/C][C]0.023215[/C][C]0.1813[/C][C]0.428361[/C][/ROW]
[ROW][C]23[/C][C]0.001235[/C][C]0.0096[/C][C]0.496166[/C][/ROW]
[ROW][C]24[/C][C]-0.019735[/C][C]-0.1541[/C][C]0.439006[/C][/ROW]
[ROW][C]25[/C][C]-0.044198[/C][C]-0.3452[/C][C]0.365567[/C][/ROW]
[ROW][C]26[/C][C]-0.063983[/C][C]-0.4997[/C][C]0.309535[/C][/ROW]
[ROW][C]27[/C][C]-0.081592[/C][C]-0.6373[/C][C]0.263171[/C][/ROW]
[ROW][C]28[/C][C]-0.104326[/C][C]-0.8148[/C][C]0.209176[/C][/ROW]
[ROW][C]29[/C][C]-0.128177[/C][C]-1.0011[/C][C]0.160368[/C][/ROW]
[ROW][C]30[/C][C]-0.141629[/C][C]-1.1062[/C][C]0.136502[/C][/ROW]
[ROW][C]31[/C][C]-0.155409[/C][C]-1.2138[/C][C]0.114755[/C][/ROW]
[ROW][C]32[/C][C]-0.169524[/C][C]-1.324[/C][C]0.095217[/C][/ROW]
[ROW][C]33[/C][C]-0.174297[/C][C]-1.3613[/C][C]0.089213[/C][/ROW]
[ROW][C]34[/C][C]-0.181471[/C][C]-1.4173[/C][C]0.080736[/C][/ROW]
[ROW][C]35[/C][C]-0.192592[/C][C]-1.5042[/C][C]0.068846[/C][/ROW]
[ROW][C]36[/C][C]-0.201561[/C][C]-1.5742[/C][C]0.060302[/C][/ROW]
[ROW][C]37[/C][C]-0.206235[/C][C]-1.6108[/C][C]0.056199[/C][/ROW]
[ROW][C]38[/C][C]-0.21547[/C][C]-1.6829[/C][C]0.048756[/C][/ROW]
[ROW][C]39[/C][C]-0.225725[/C][C]-1.763[/C][C]0.041457[/C][/ROW]
[ROW][C]40[/C][C]-0.232998[/C][C]-1.8198[/C][C]0.03685[/C][/ROW]
[ROW][C]41[/C][C]-0.243979[/C][C]-1.9055[/C][C]0.030713[/C][/ROW]
[ROW][C]42[/C][C]-0.258379[/C][C]-2.018[/C][C]0.023997[/C][/ROW]
[ROW][C]43[/C][C]-0.267567[/C][C]-2.0898[/C][C]0.020408[/C][/ROW]
[ROW][C]44[/C][C]-0.276467[/C][C]-2.1593[/C][C]0.017385[/C][/ROW]
[ROW][C]45[/C][C]-0.298522[/C][C]-2.3315[/C][C]0.011522[/C][/ROW]
[ROW][C]46[/C][C]-0.321817[/C][C]-2.5135[/C][C]0.007306[/C][/ROW]
[ROW][C]47[/C][C]-0.350182[/C][C]-2.735[/C][C]0.004078[/C][/ROW]
[ROW][C]48[/C][C]-0.367922[/C][C]-2.8736[/C][C]0.002789[/C][/ROW]
[/TABLE]
Source: https://freestatistics.org/blog/index.php?pk=35732&T=1

Globally Unique Identifier (entire table): ba.freestatistics.org/blog/index.php?pk=35732&T=1

As an alternative you can also use a QR Code:  

The GUIDs for individual cells are displayed in the table below:

Autocorrelation Function
Time lag kACF(k)T-STATP-value
10.933387.28990
20.8589496.70860
30.78456.12710
40.7149065.58360
50.6397664.99673e-06
60.5683154.43871.9e-05
70.4901373.82810.000153
80.4161843.25050.000939
90.3567132.7860.00355
100.3102992.42350.009176
110.271132.11760.019147
120.2306921.80180.038262
130.2041011.59410.058044
140.1807531.41170.081556
150.1695781.32440.095148
160.1542821.2050.116432
170.1389151.0850.141105
180.1108850.8660.19493
190.0867220.67730.250381
200.0711580.55580.290203
210.0497470.38850.349487
220.0232150.18130.428361
230.0012350.00960.496166
24-0.019735-0.15410.439006
25-0.044198-0.34520.365567
26-0.063983-0.49970.309535
27-0.081592-0.63730.263171
28-0.104326-0.81480.209176
29-0.128177-1.00110.160368
30-0.141629-1.10620.136502
31-0.155409-1.21380.114755
32-0.169524-1.3240.095217
33-0.174297-1.36130.089213
34-0.181471-1.41730.080736
35-0.192592-1.50420.068846
36-0.201561-1.57420.060302
37-0.206235-1.61080.056199
38-0.21547-1.68290.048756
39-0.225725-1.7630.041457
40-0.232998-1.81980.03685
41-0.243979-1.90550.030713
42-0.258379-2.0180.023997
43-0.267567-2.08980.020408
44-0.276467-2.15930.017385
45-0.298522-2.33150.011522
46-0.321817-2.51350.007306
47-0.350182-2.7350.004078
48-0.367922-2.87360.002789


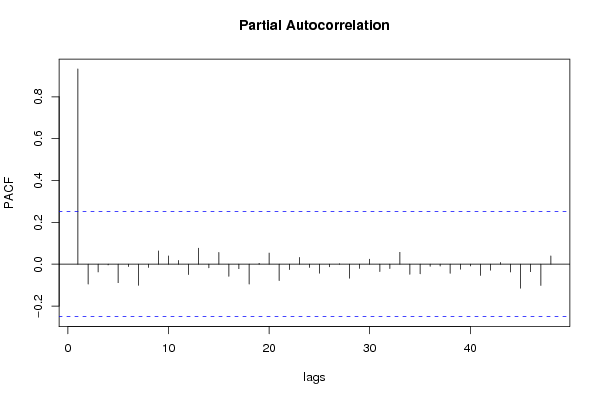
Partial Autocorrelation Function
Time lag kPACF(k)T-STATP-value
10.933387.28990
2-0.095097-0.74270.230248
3-0.036864-0.28790.387193
4-0.003823-0.02990.488139
5-0.088326-0.68980.246454
6-0.011605-0.09060.46404
7-0.100942-0.78840.216763
8-0.015929-0.12440.4507
90.0635140.49610.310818
100.039580.30910.379139
110.0176970.13820.445263
12-0.04984-0.38930.349219
130.0762880.59580.276747
14-0.017335-0.13540.446374
150.0559070.43660.331955
16-0.058279-0.45520.325301
17-0.021658-0.16920.433118
18-0.094972-0.74180.230541
190.00430.03360.486659
200.0532090.41560.339589
21-0.078671-0.61440.270604
22-0.025626-0.20010.421017
230.0321870.25140.40118
24-0.015499-0.12110.452023
25-0.043374-0.33880.367976
26-0.012918-0.10090.459983
270.0016560.01290.494862
28-0.067168-0.52460.30088
29-0.020732-0.16190.435952
300.023760.18560.426699
31-0.035275-0.27550.391928
32-0.020767-0.16220.435845
330.0564780.44110.330347
34-0.048307-0.37730.353633
35-0.046415-0.36250.359111
36-0.010025-0.07830.468923
37-0.008888-0.06940.472442
38-0.043914-0.3430.366398
39-0.023798-0.18590.426581
40-0.008278-0.06470.474331
41-0.053745-0.41980.338068
42-0.029008-0.22660.410762
430.0084880.06630.473681
44-0.03702-0.28910.386729
45-0.114984-0.89810.186345
46-0.036119-0.28210.389413
47-0.101634-0.79380.215198
480.0393260.30710.37989

\begin{tabular}{lllllllll}
\hline
Partial Autocorrelation Function \tabularnewline
Time lag k & PACF(k) & T-STAT & P-value \tabularnewline
1 & 0.93338 & 7.2899 & 0 \tabularnewline
2 & -0.095097 & -0.7427 & 0.230248 \tabularnewline
3 & -0.036864 & -0.2879 & 0.387193 \tabularnewline
4 & -0.003823 & -0.0299 & 0.488139 \tabularnewline
5 & -0.088326 & -0.6898 & 0.246454 \tabularnewline
6 & -0.011605 & -0.0906 & 0.46404 \tabularnewline
7 & -0.100942 & -0.7884 & 0.216763 \tabularnewline
8 & -0.015929 & -0.1244 & 0.4507 \tabularnewline
9 & 0.063514 & 0.4961 & 0.310818 \tabularnewline
10 & 0.03958 & 0.3091 & 0.379139 \tabularnewline
11 & 0.017697 & 0.1382 & 0.445263 \tabularnewline
12 & -0.04984 & -0.3893 & 0.349219 \tabularnewline
13 & 0.076288 & 0.5958 & 0.276747 \tabularnewline
14 & -0.017335 & -0.1354 & 0.446374 \tabularnewline
15 & 0.055907 & 0.4366 & 0.331955 \tabularnewline
16 & -0.058279 & -0.4552 & 0.325301 \tabularnewline
17 & -0.021658 & -0.1692 & 0.433118 \tabularnewline
18 & -0.094972 & -0.7418 & 0.230541 \tabularnewline
19 & 0.0043 & 0.0336 & 0.486659 \tabularnewline
20 & 0.053209 & 0.4156 & 0.339589 \tabularnewline
21 & -0.078671 & -0.6144 & 0.270604 \tabularnewline
22 & -0.025626 & -0.2001 & 0.421017 \tabularnewline
23 & 0.032187 & 0.2514 & 0.40118 \tabularnewline
24 & -0.015499 & -0.1211 & 0.452023 \tabularnewline
25 & -0.043374 & -0.3388 & 0.367976 \tabularnewline
26 & -0.012918 & -0.1009 & 0.459983 \tabularnewline
27 & 0.001656 & 0.0129 & 0.494862 \tabularnewline
28 & -0.067168 & -0.5246 & 0.30088 \tabularnewline
29 & -0.020732 & -0.1619 & 0.435952 \tabularnewline
30 & 0.02376 & 0.1856 & 0.426699 \tabularnewline
31 & -0.035275 & -0.2755 & 0.391928 \tabularnewline
32 & -0.020767 & -0.1622 & 0.435845 \tabularnewline
33 & 0.056478 & 0.4411 & 0.330347 \tabularnewline
34 & -0.048307 & -0.3773 & 0.353633 \tabularnewline
35 & -0.046415 & -0.3625 & 0.359111 \tabularnewline
36 & -0.010025 & -0.0783 & 0.468923 \tabularnewline
37 & -0.008888 & -0.0694 & 0.472442 \tabularnewline
38 & -0.043914 & -0.343 & 0.366398 \tabularnewline
39 & -0.023798 & -0.1859 & 0.426581 \tabularnewline
40 & -0.008278 & -0.0647 & 0.474331 \tabularnewline
41 & -0.053745 & -0.4198 & 0.338068 \tabularnewline
42 & -0.029008 & -0.2266 & 0.410762 \tabularnewline
43 & 0.008488 & 0.0663 & 0.473681 \tabularnewline
44 & -0.03702 & -0.2891 & 0.386729 \tabularnewline
45 & -0.114984 & -0.8981 & 0.186345 \tabularnewline
46 & -0.036119 & -0.2821 & 0.389413 \tabularnewline
47 & -0.101634 & -0.7938 & 0.215198 \tabularnewline
48 & 0.039326 & 0.3071 & 0.37989 \tabularnewline
\hline
\end{tabular}
%Source: https://freestatistics.org/blog/index.php?pk=35732&T=2

[TABLE]
[ROW][C]Partial Autocorrelation Function[/C][/ROW]
[ROW][C]Time lag k[/C][C]PACF(k)[/C][C]T-STAT[/C][C]P-value[/C][/ROW]
[ROW][C]1[/C][C]0.93338[/C][C]7.2899[/C][C]0[/C][/ROW]
[ROW][C]2[/C][C]-0.095097[/C][C]-0.7427[/C][C]0.230248[/C][/ROW]
[ROW][C]3[/C][C]-0.036864[/C][C]-0.2879[/C][C]0.387193[/C][/ROW]
[ROW][C]4[/C][C]-0.003823[/C][C]-0.0299[/C][C]0.488139[/C][/ROW]
[ROW][C]5[/C][C]-0.088326[/C][C]-0.6898[/C][C]0.246454[/C][/ROW]
[ROW][C]6[/C][C]-0.011605[/C][C]-0.0906[/C][C]0.46404[/C][/ROW]
[ROW][C]7[/C][C]-0.100942[/C][C]-0.7884[/C][C]0.216763[/C][/ROW]
[ROW][C]8[/C][C]-0.015929[/C][C]-0.1244[/C][C]0.4507[/C][/ROW]
[ROW][C]9[/C][C]0.063514[/C][C]0.4961[/C][C]0.310818[/C][/ROW]
[ROW][C]10[/C][C]0.03958[/C][C]0.3091[/C][C]0.379139[/C][/ROW]
[ROW][C]11[/C][C]0.017697[/C][C]0.1382[/C][C]0.445263[/C][/ROW]
[ROW][C]12[/C][C]-0.04984[/C][C]-0.3893[/C][C]0.349219[/C][/ROW]
[ROW][C]13[/C][C]0.076288[/C][C]0.5958[/C][C]0.276747[/C][/ROW]
[ROW][C]14[/C][C]-0.017335[/C][C]-0.1354[/C][C]0.446374[/C][/ROW]
[ROW][C]15[/C][C]0.055907[/C][C]0.4366[/C][C]0.331955[/C][/ROW]
[ROW][C]16[/C][C]-0.058279[/C][C]-0.4552[/C][C]0.325301[/C][/ROW]
[ROW][C]17[/C][C]-0.021658[/C][C]-0.1692[/C][C]0.433118[/C][/ROW]
[ROW][C]18[/C][C]-0.094972[/C][C]-0.7418[/C][C]0.230541[/C][/ROW]
[ROW][C]19[/C][C]0.0043[/C][C]0.0336[/C][C]0.486659[/C][/ROW]
[ROW][C]20[/C][C]0.053209[/C][C]0.4156[/C][C]0.339589[/C][/ROW]
[ROW][C]21[/C][C]-0.078671[/C][C]-0.6144[/C][C]0.270604[/C][/ROW]
[ROW][C]22[/C][C]-0.025626[/C][C]-0.2001[/C][C]0.421017[/C][/ROW]
[ROW][C]23[/C][C]0.032187[/C][C]0.2514[/C][C]0.40118[/C][/ROW]
[ROW][C]24[/C][C]-0.015499[/C][C]-0.1211[/C][C]0.452023[/C][/ROW]
[ROW][C]25[/C][C]-0.043374[/C][C]-0.3388[/C][C]0.367976[/C][/ROW]
[ROW][C]26[/C][C]-0.012918[/C][C]-0.1009[/C][C]0.459983[/C][/ROW]
[ROW][C]27[/C][C]0.001656[/C][C]0.0129[/C][C]0.494862[/C][/ROW]
[ROW][C]28[/C][C]-0.067168[/C][C]-0.5246[/C][C]0.30088[/C][/ROW]
[ROW][C]29[/C][C]-0.020732[/C][C]-0.1619[/C][C]0.435952[/C][/ROW]
[ROW][C]30[/C][C]0.02376[/C][C]0.1856[/C][C]0.426699[/C][/ROW]
[ROW][C]31[/C][C]-0.035275[/C][C]-0.2755[/C][C]0.391928[/C][/ROW]
[ROW][C]32[/C][C]-0.020767[/C][C]-0.1622[/C][C]0.435845[/C][/ROW]
[ROW][C]33[/C][C]0.056478[/C][C]0.4411[/C][C]0.330347[/C][/ROW]
[ROW][C]34[/C][C]-0.048307[/C][C]-0.3773[/C][C]0.353633[/C][/ROW]
[ROW][C]35[/C][C]-0.046415[/C][C]-0.3625[/C][C]0.359111[/C][/ROW]
[ROW][C]36[/C][C]-0.010025[/C][C]-0.0783[/C][C]0.468923[/C][/ROW]
[ROW][C]37[/C][C]-0.008888[/C][C]-0.0694[/C][C]0.472442[/C][/ROW]
[ROW][C]38[/C][C]-0.043914[/C][C]-0.343[/C][C]0.366398[/C][/ROW]
[ROW][C]39[/C][C]-0.023798[/C][C]-0.1859[/C][C]0.426581[/C][/ROW]
[ROW][C]40[/C][C]-0.008278[/C][C]-0.0647[/C][C]0.474331[/C][/ROW]
[ROW][C]41[/C][C]-0.053745[/C][C]-0.4198[/C][C]0.338068[/C][/ROW]
[ROW][C]42[/C][C]-0.029008[/C][C]-0.2266[/C][C]0.410762[/C][/ROW]
[ROW][C]43[/C][C]0.008488[/C][C]0.0663[/C][C]0.473681[/C][/ROW]
[ROW][C]44[/C][C]-0.03702[/C][C]-0.2891[/C][C]0.386729[/C][/ROW]
[ROW][C]45[/C][C]-0.114984[/C][C]-0.8981[/C][C]0.186345[/C][/ROW]
[ROW][C]46[/C][C]-0.036119[/C][C]-0.2821[/C][C]0.389413[/C][/ROW]
[ROW][C]47[/C][C]-0.101634[/C][C]-0.7938[/C][C]0.215198[/C][/ROW]
[ROW][C]48[/C][C]0.039326[/C][C]0.3071[/C][C]0.37989[/C][/ROW]
[/TABLE]
Source: https://freestatistics.org/blog/index.php?pk=35732&T=2

Globally Unique Identifier (entire table): ba.freestatistics.org/blog/index.php?pk=35732&T=2

As an alternative you can also use a QR Code:  

The GUIDs for individual cells are displayed in the table below:

Partial Autocorrelation Function
Time lag kPACF(k)T-STATP-value
10.933387.28990
2-0.095097-0.74270.230248
3-0.036864-0.28790.387193
4-0.003823-0.02990.488139
5-0.088326-0.68980.246454
6-0.011605-0.09060.46404
7-0.100942-0.78840.216763
8-0.015929-0.12440.4507
90.0635140.49610.310818
100.039580.30910.379139
110.0176970.13820.445263
12-0.04984-0.38930.349219
130.0762880.59580.276747
14-0.017335-0.13540.446374
150.0559070.43660.331955
16-0.058279-0.45520.325301
17-0.021658-0.16920.433118
18-0.094972-0.74180.230541
190.00430.03360.486659
200.0532090.41560.339589
21-0.078671-0.61440.270604
22-0.025626-0.20010.421017
230.0321870.25140.40118
24-0.015499-0.12110.452023
25-0.043374-0.33880.367976
26-0.012918-0.10090.459983
270.0016560.01290.494862
28-0.067168-0.52460.30088
29-0.020732-0.16190.435952
300.023760.18560.426699
31-0.035275-0.27550.391928
32-0.020767-0.16220.435845
330.0564780.44110.330347
34-0.048307-0.37730.353633
35-0.046415-0.36250.359111
36-0.010025-0.07830.468923
37-0.008888-0.06940.472442
38-0.043914-0.3430.366398
39-0.023798-0.18590.426581
40-0.008278-0.06470.474331
41-0.053745-0.41980.338068
42-0.029008-0.22660.410762
430.0084880.06630.473681
44-0.03702-0.28910.386729
45-0.114984-0.89810.186345
46-0.036119-0.28210.389413
47-0.101634-0.79380.215198
480.0393260.30710.37989


Parameters (Session):
par1 = 48 ; par2 = -0.8 ; par3 = 0 ; par4 = 0 ; par5 = 12 ;
Parameters (R input):
par1 = 48 ; par2 = -0.8 ; par3 = 0 ; par4 = 0 ; par5 = 12 ;
R code (references can be found in the software module):
if (par1 == 'Default') {
par1 = 10*log10(length(x))
} else {
par1 <- as.numeric(par1)
}
par2 <- as.numeric(par2)
par3 <- as.numeric(par3)
par4 <- as.numeric(par4)
par5 <- as.numeric(par5)
if (par2 == 0) {
x <- log(x)
} else {
x <- (x ^ par2 - 1) / par2
}
if (par3 > 0) x <- diff(x,lag=1,difference=par3)
if (par4 > 0) x <- diff(x,lag=par5,difference=par4)
bitmap(file='pic1.png')
racf <- acf(x,par1,main='Autocorrelation',xlab='lags',ylab='ACF')
dev.off()
bitmap(file='pic2.png')
rpacf <- pacf(x,par1,main='Partial Autocorrelation',xlab='lags',ylab='PACF')
dev.off()
(myacf <- c(racf$acf))
(mypacf <- c(rpacf$acf))
lengthx <- length(x)
sqrtn <- sqrt(lengthx)
load(file='createtable')
a<-table.start()
a<-table.row.start(a)
a<-table.element(a,'Autocorrelation Function',4,TRUE)
a<-table.row.end(a)
a<-table.row.start(a)
a<-table.element(a,'Time lag k',header=TRUE)
a<-table.element(a,hyperlink('basics.htm','ACF(k)','click here for more information about the Autocorrelation Function'),header=TRUE)
a<-table.element(a,'T-STAT',header=TRUE)
a<-table.element(a,'P-value',header=TRUE)
a<-table.row.end(a)
for (i in 2:(par1+1)) {
a<-table.row.start(a)
a<-table.element(a,i-1,header=TRUE)
a<-table.element(a,round(myacf[i],6))
mytstat <- myacf[i]*sqrtn
a<-table.element(a,round(mytstat,4))
a<-table.element(a,round(1-pt(abs(mytstat),lengthx),6))
a<-table.row.end(a)
}
a<-table.end(a)
table.save(a,file='mytable.tab')
a<-table.start()
a<-table.row.start(a)
a<-table.element(a,'Partial Autocorrelation Function',4,TRUE)
a<-table.row.end(a)
a<-table.row.start(a)
a<-table.element(a,'Time lag k',header=TRUE)
a<-table.element(a,hyperlink('basics.htm','PACF(k)','click here for more information about the Partial Autocorrelation Function'),header=TRUE)
a<-table.element(a,'T-STAT',header=TRUE)
a<-table.element(a,'P-value',header=TRUE)
a<-table.row.end(a)
for (i in 1:par1) {
a<-table.row.start(a)
a<-table.element(a,i,header=TRUE)
a<-table.element(a,round(mypacf[i],6))
mytstat <- mypacf[i]*sqrtn
a<-table.element(a,round(mytstat,4))
a<-table.element(a,round(1-pt(abs(mytstat),lengthx),6))
a<-table.row.end(a)
}
a<-table.end(a)
table.save(a,file='mytable1.tab')