Free Statistics

of Irreproducible Research!

Author's title

Author*The author of this computation has been verified*
R Software Modulerwasp_pairs.wasp
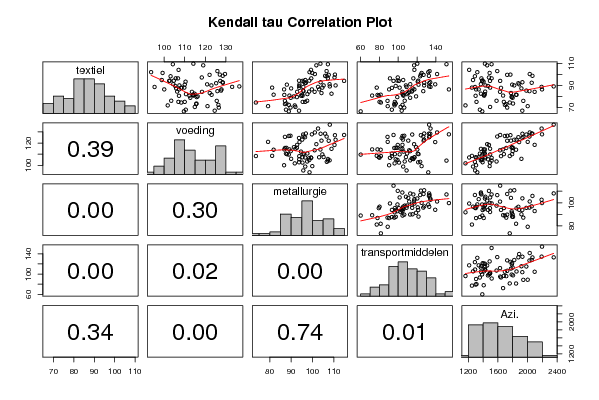
Title produced by softwareKendall tau Correlation Matrix
Date of computationWed, 17 Dec 2008 12:07:06 -0700
Cite this page as followsStatistical Computations at FreeStatistics.org, Office for Research Development and Education, URL https://freestatistics.org/blog/index.php?v=date/2008/Dec/17/t12295418073zbyqrk8hwlgk7x.htm/, Retrieved Sun, 26 May 2024 15:32:29 +0000
Statistical Computations at FreeStatistics.org, Office for Research Development and Education, URL https://freestatistics.org/blog/index.php?pk=34508, Retrieved Sun, 26 May 2024 15:32:29 +0000
QR Codes:

Original text written by user:
IsPrivate?No (this computation is public)
User-defined keywords
Estimated Impact146
Family? (F = Feedback message, R = changed R code, M = changed R Module, P = changed Parameters, D = changed Data)
-     [Kendall tau Correlation Matrix] [] [2008-12-15 21:14:33] [74be16979710d4c4e7c6647856088456]
-    D  [Kendall tau Correlation Matrix] [Kendall tau] [2008-12-15 21:19:14] [5e74953d94072114d25d7276793b561e]
-    D      [Kendall tau Correlation Matrix] [verband tussen in...] [2008-12-17 19:07:06] [5925747fb2a6bb4cfcd8015825ee5e92] [Current]
Feedback Forum

Post a new message
Dataseries X:
101,3	99,2	99,9	124,9	1487,6
102	93,6	98,6	132	1320,9
109,2	104,2	107,2	151,4	1514
88,6	95,3	95,7	108,9	1290,9
94,3	102,7	93,7	121,3	1392,5
98,3	103,1	106,7	123,4	1288,2
86,4	100	86,7	90,3	1304,4
80,6	107,2	95,3	79,3	1297,8
104,1	107	99,3	117,2	1211
108,2	119	101,8	116,9	1454
93,4	110,4	96	120,8	1405,7
71,9	101,7	91,7	96,1	1160,8
94,1	102,4	95,3	100,8	1492,1
94,9	98,8	96,6	105,3	1263
96,4	105,6	107,2	116,1	1376,3
91,1	104,4	108	112,8	1368,6
84,4	106,3	98,4	114,5	1427,6
86,4	107,2	103,1	117,2	1339,8
88	108,5	81,1	77,1	1248,3
75,1	106,9	96,6	80,1	1309,8
109,7	114,2	103,7	120,3	1424
103	125,9	106,6	133,4	1590,5
82,1	110,6	97,6	109,4	1423,1
68	110,5	87,6	93,2	1355,3
96,4	106,7	99,4	91,2	1515
94,3	104,7	98,5	99,2	1385,6
90	107,4	105,2	108,2	1430
88	109,8	104,6	101,5	1494,2
76,1	103,4	97,5	106,9	1580,9
82,5	114,8	108,9	104,4	1369,8
81,4	114,3	86,8	77,9	1407,5
66,5	109,6	88,9	60	1388,3
97,2	118,3	110,3	99,5	1478,5
94,1	127,3	114,8	95	1630,4
80,7	112,3	94,6	105,6	1413,5
70,5	114,9	92	102,5	1493,8
87,8	108,2	93,8	93,3	1641,3
89,5	105,4	93,8	97,3	1465
99,6	122,1	107,6	127	1725,1
84,2	113,5	101	111,7	1628,4
75,1	110	95,4	96,4	1679,8
92	125,3	96,5	133	1876
80,8	114,3	89,2	72,2	1669,4
73,1	115,6	87,1	95,8	1712,4
99,8	127,1	110,5	124,1	1768,8
90	123	110,8	127,6	1820,5
83,1	122,2	104,2	110,7	1776,2
72,4	126,4	88,9	104,6	1693,7
78,8	112,7	89,8	112,7	1799,1
87,3	105,8	90	115,3	1917,5
91	120,9	93,9	139,4	1887,2
80,1	116,3	91,3	119	1787,8
73,6	115,7	87,8	97,4	1803,8
86,4	127,9	99,7	154	2196,4
74,5	108,3	73,5	81,5	1759,5
71,2	121,1	79,2	88,8	2002,6
92,4	128,6	96,9	127,7	2056,8
81,5	123,1	95,2	105,1	1851,1
85,3	127,7	95,6	114,9	1984,3
69,9	126,6	89,7	106,4	1725,3
84,2	118,4	92,8	104,5	2096,6
90,7	110	88	121,6	1792,2
100,3	129,6	101,1	141,4	2029,9
79,4	115,8	92,7	99	1785,3
84,8	125,9	95,8	126,7	2026,5
92,9	128,4	103,8	134,1	1930,8
81,6	114	81,8	81,3	1845,5
76	125,6	87,1	88,6	1943,1
98,7	128,5	105,9	132,7	2066,8
89,1	136,6	108,1	132,9	2354,4
88,7	133,1	102,6	134,4	2190,7
67,1	124,6	93,7	103,7	1929,6


Summary of computational transaction
Raw Inputview raw input (R code)
Raw Outputview raw output of R engine
Computing time2 seconds
R Server'Sir Ronald Aylmer Fisher' @ 193.190.124.24

\begin{tabular}{lllllllll}
\hline
Summary of computational transaction \tabularnewline
Raw Input & view raw input (R code)  \tabularnewline
Raw Output & view raw output of R engine  \tabularnewline
Computing time & 2 seconds \tabularnewline
R Server & 'Sir Ronald Aylmer Fisher' @ 193.190.124.24 \tabularnewline
\hline
\end{tabular}
%Source: https://freestatistics.org/blog/index.php?pk=34508&T=0

[TABLE]
[ROW][C]Summary of computational transaction[/C][/ROW]
[ROW][C]Raw Input[/C][C]view raw input (R code) [/C][/ROW]
[ROW][C]Raw Output[/C][C]view raw output of R engine [/C][/ROW]
[ROW][C]Computing time[/C][C]2 seconds[/C][/ROW]
[ROW][C]R Server[/C][C]'Sir Ronald Aylmer Fisher' @ 193.190.124.24[/C][/ROW]
[/TABLE]
Source: https://freestatistics.org/blog/index.php?pk=34508&T=0

Globally Unique Identifier (entire table): ba.freestatistics.org/blog/index.php?pk=34508&T=0

As an alternative you can also use a QR Code:  

The GUIDs for individual cells are displayed in the table below:

Summary of computational transaction
Raw Inputview raw input (R code)
Raw Outputview raw output of R engine
Computing time2 seconds
R Server'Sir Ronald Aylmer Fisher' @ 193.190.124.24


Kendall tau rank correlations for all pairs of data series
pairtaup-value
tau( textiel , voeding )-0.06904673279522150.392148448686921
tau( textiel , metallurgie )0.4651620040902618.32320301569212e-09
tau( textiel , transportmiddelen )0.4175658332320112.24347258104274e-07
tau( textiel , Azië )-0.076832762243790.340628305900179
tau( voeding , metallurgie )0.08272889099819180.304959302050207
tau( voeding , transportmiddelen )0.1922851320600770.016985876670794
tau( voeding , Azië )0.5771340845518097.73159314348959e-13
tau( metallurgie , transportmiddelen )0.4083074921544644.0647914323344e-07
tau( metallurgie , Azië )-0.02624880038662760.74462826800414
tau( transportmiddelen , Azië )0.2226570185447350.00567342188527964

\begin{tabular}{lllllllll}
\hline
Kendall tau rank correlations for all pairs of data series \tabularnewline
pair & tau & p-value \tabularnewline
tau( textiel , voeding ) & -0.0690467327952215 & 0.392148448686921 \tabularnewline
tau( textiel , metallurgie ) & 0.465162004090261 & 8.32320301569212e-09 \tabularnewline
tau( textiel , transportmiddelen ) & 0.417565833232011 & 2.24347258104274e-07 \tabularnewline
tau( textiel , Azië ) & -0.07683276224379 & 0.340628305900179 \tabularnewline
tau( voeding , metallurgie ) & 0.0827288909981918 & 0.304959302050207 \tabularnewline
tau( voeding , transportmiddelen ) & 0.192285132060077 & 0.016985876670794 \tabularnewline
tau( voeding , Azië ) & 0.577134084551809 & 7.73159314348959e-13 \tabularnewline
tau( metallurgie , transportmiddelen ) & 0.408307492154464 & 4.0647914323344e-07 \tabularnewline
tau( metallurgie , Azië ) & -0.0262488003866276 & 0.74462826800414 \tabularnewline
tau( transportmiddelen , Azië ) & 0.222657018544735 & 0.00567342188527964 \tabularnewline
\hline
\end{tabular}
%Source: https://freestatistics.org/blog/index.php?pk=34508&T=1

[TABLE]
[ROW][C]Kendall tau rank correlations for all pairs of data series[/C][/ROW]
[ROW][C]pair[/C][C]tau[/C][C]p-value[/C][/ROW]
[ROW][C]tau( textiel , voeding )[/C][C]-0.0690467327952215[/C][C]0.392148448686921[/C][/ROW]
[ROW][C]tau( textiel , metallurgie )[/C][C]0.465162004090261[/C][C]8.32320301569212e-09[/C][/ROW]
[ROW][C]tau( textiel , transportmiddelen )[/C][C]0.417565833232011[/C][C]2.24347258104274e-07[/C][/ROW]
[ROW][C]tau( textiel , Azië )[/C][C]-0.07683276224379[/C][C]0.340628305900179[/C][/ROW]
[ROW][C]tau( voeding , metallurgie )[/C][C]0.0827288909981918[/C][C]0.304959302050207[/C][/ROW]
[ROW][C]tau( voeding , transportmiddelen )[/C][C]0.192285132060077[/C][C]0.016985876670794[/C][/ROW]
[ROW][C]tau( voeding , Azië )[/C][C]0.577134084551809[/C][C]7.73159314348959e-13[/C][/ROW]
[ROW][C]tau( metallurgie , transportmiddelen )[/C][C]0.408307492154464[/C][C]4.0647914323344e-07[/C][/ROW]
[ROW][C]tau( metallurgie , Azië )[/C][C]-0.0262488003866276[/C][C]0.74462826800414[/C][/ROW]
[ROW][C]tau( transportmiddelen , Azië )[/C][C]0.222657018544735[/C][C]0.00567342188527964[/C][/ROW]
[/TABLE]
Source: https://freestatistics.org/blog/index.php?pk=34508&T=1

Globally Unique Identifier (entire table): ba.freestatistics.org/blog/index.php?pk=34508&T=1

As an alternative you can also use a QR Code:  

The GUIDs for individual cells are displayed in the table below:

Kendall tau rank correlations for all pairs of data series
pairtaup-value
tau( textiel , voeding )-0.06904673279522150.392148448686921
tau( textiel , metallurgie )0.4651620040902618.32320301569212e-09
tau( textiel , transportmiddelen )0.4175658332320112.24347258104274e-07
tau( textiel , Azië )-0.076832762243790.340628305900179
tau( voeding , metallurgie )0.08272889099819180.304959302050207
tau( voeding , transportmiddelen )0.1922851320600770.016985876670794
tau( voeding , Azië )0.5771340845518097.73159314348959e-13
tau( metallurgie , transportmiddelen )0.4083074921544644.0647914323344e-07
tau( metallurgie , Azië )-0.02624880038662760.74462826800414
tau( transportmiddelen , Azië )0.2226570185447350.00567342188527964


Parameters (Session):
Parameters (R input):
R code (references can be found in the software module):
panel.tau <- function(x, y, digits=2, prefix='', cex.cor)
{
usr <- par('usr'); on.exit(par(usr))
par(usr = c(0, 1, 0, 1))
rr <- cor.test(x, y, method='kendall')
r <- round(rr$p.value,2)
txt <- format(c(r, 0.123456789), digits=digits)[1]
txt <- paste(prefix, txt, sep='')
if(missing(cex.cor)) cex <- 0.5/strwidth(txt)
text(0.5, 0.5, txt, cex = cex)
}
panel.hist <- function(x, ...)
{
usr <- par('usr'); on.exit(par(usr))
par(usr = c(usr[1:2], 0, 1.5) )
h <- hist(x, plot = FALSE)
breaks <- h$breaks; nB <- length(breaks)
y <- h$counts; y <- y/max(y)
rect(breaks[-nB], 0, breaks[-1], y, col='grey', ...)
}
bitmap(file='test1.png')
pairs(t(y),diag.panel=panel.hist, upper.panel=panel.smooth, lower.panel=panel.tau, main=main)
dev.off()
load(file='createtable')
a<-table.start()
a<-table.row.start(a)
a<-table.element(a,'Kendall tau rank correlations for all pairs of data series',3,TRUE)
a<-table.row.end(a)
a<-table.row.start(a)
a<-table.element(a,'pair',1,TRUE)
a<-table.element(a,'tau',1,TRUE)
a<-table.element(a,'p-value',1,TRUE)
a<-table.row.end(a)
n <- length(y[,1])
n
cor.test(y[1,],y[2,],method='kendall')
for (i in 1:(n-1))
{
for (j in (i+1):n)
{
a<-table.row.start(a)
dum <- paste('tau(',dimnames(t(x))[[2]][i])
dum <- paste(dum,',')
dum <- paste(dum,dimnames(t(x))[[2]][j])
dum <- paste(dum,')')
a<-table.element(a,dum,header=TRUE)
r <- cor.test(y[i,],y[j,],method='kendall')
a<-table.element(a,r$estimate)
a<-table.element(a,r$p.value)
a<-table.row.end(a)
}
}
a<-table.end(a)
table.save(a,file='mytable.tab')