Free Statistics

of Irreproducible Research!

Author's title

Author*The author of this computation has been verified*
R Software Modulerwasp_arimaforecasting.wasp
Title produced by softwareARIMA Forecasting
Date of computationWed, 17 Dec 2008 09:54:16 -0700
Cite this page as followsStatistical Computations at FreeStatistics.org, Office for Research Development and Education, URL https://freestatistics.org/blog/index.php?v=date/2008/Dec/17/t1229532910k99kterovz3fqxe.htm/, Retrieved Mon, 06 May 2024 23:53:11 +0000
Statistical Computations at FreeStatistics.org, Office for Research Development and Education, URL https://freestatistics.org/blog/index.php?pk=34448, Retrieved Mon, 06 May 2024 23:53:11 +0000
QR Codes:

Original text written by user:
IsPrivate?No (this computation is public)
User-defined keywordsgdm
Estimated Impact190
Family? (F = Feedback message, R = changed R code, M = changed R Module, P = changed Parameters, D = changed Data)
-     [ARIMA Backward Selection] [Werkloosheid bij 50+] [2008-12-14 23:10:48] [11ac052cc87d77b9933b02bea117068e]
- RMP     [ARIMA Forecasting] [Werkloosheid bij ...] [2008-12-17 16:54:16] [99f79d508deef838ee89a56fb32f134e] [Current]
-   P       [ARIMA Forecasting] [Werkloosheid bij ...] [2008-12-22 19:32:20] [11ac052cc87d77b9933b02bea117068e]
-   PD        [ARIMA Forecasting] [Aantal diploma's] [2009-03-29 16:14:05] [11ac052cc87d77b9933b02bea117068e]
Feedback Forum

Post a new message
Dataseries X:
88900
87280
85519
83647
81616
80100
94027
102327
104296
101593
94816
93535
93618
92330
90751
88576
86102
85494
103432
108870
109713
106960
103195
102348
102158
100431
97649
95611
93035
93579
111777
116065
116609
112934
107660
107965
107772
106201
102288
99217
96511
96456
113021
117836
118492
113922
109317
107496
105524
103824
101833
99436
96915
96072
111941
116008
117557
113445
108762
106661
102824
101912
99005
97894
96256
95606
108948
111223
113142
106078
100992
97413


Summary of computational transaction
Raw Inputview raw input (R code)
Raw Outputview raw output of R engine
Computing time2 seconds
R Server'Sir Ronald Aylmer Fisher' @ 193.190.124.24

\begin{tabular}{lllllllll}
\hline
Summary of computational transaction \tabularnewline
Raw Input & view raw input (R code)  \tabularnewline
Raw Output & view raw output of R engine  \tabularnewline
Computing time & 2 seconds \tabularnewline
R Server & 'Sir Ronald Aylmer Fisher' @ 193.190.124.24 \tabularnewline
\hline
\end{tabular}
%Source: https://freestatistics.org/blog/index.php?pk=34448&T=0

[TABLE]
[ROW][C]Summary of computational transaction[/C][/ROW]
[ROW][C]Raw Input[/C][C]view raw input (R code) [/C][/ROW]
[ROW][C]Raw Output[/C][C]view raw output of R engine [/C][/ROW]
[ROW][C]Computing time[/C][C]2 seconds[/C][/ROW]
[ROW][C]R Server[/C][C]'Sir Ronald Aylmer Fisher' @ 193.190.124.24[/C][/ROW]
[/TABLE]
Source: https://freestatistics.org/blog/index.php?pk=34448&T=0

Globally Unique Identifier (entire table): ba.freestatistics.org/blog/index.php?pk=34448&T=0

As an alternative you can also use a QR Code:  

The GUIDs for individual cells are displayed in the table below:

Summary of computational transaction
Raw Inputview raw input (R code)
Raw Outputview raw output of R engine
Computing time2 seconds
R Server'Sir Ronald Aylmer Fisher' @ 193.190.124.24


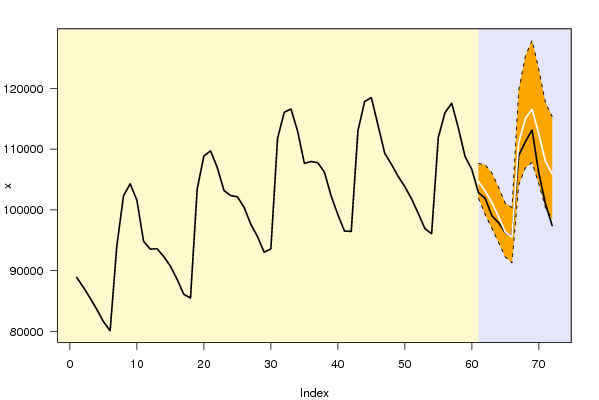
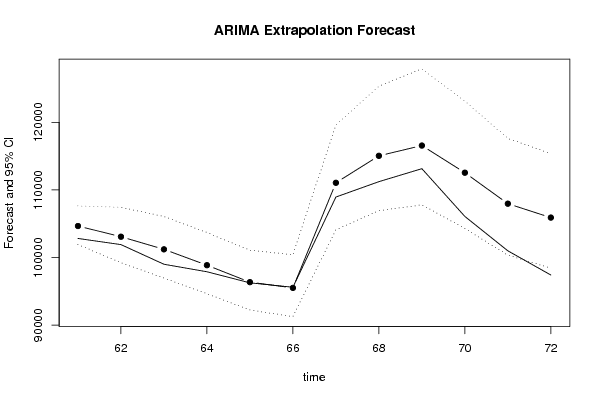
Univariate ARIMA Extrapolation Forecast
timeY[t]F[t]95% LB95% UBp-value(H0: Y[t] = F[t])P(F[t]>Y[t-1])P(F[t]>Y[t-s])P(F[t]>Y[60])
48107496-------
49105524-------
50103824-------
51101833-------
5299436-------
5396915-------
5496072-------
55111941-------
56116008-------
57117557-------
58113445-------
59108762-------
60106661-------
61102824104661.6469101923.349107633.21180.11270.09360.28470.0936
62101912103079.165499221.6803107424.63410.29930.54580.36850.0531
6399005101211.584996962.1118106073.68410.18690.38880.40110.014
649789498865.363294653.2145103695.02760.34670.47740.40848e-04
659625696357.92392246.6587101072.91480.48310.26160.40840
669560695508.824691253.9762100420.33570.48450.38280.41110
67108948111055.875104096.5492119628.01540.31490.99980.41980.8425
68111223115042.763106939.6426125319.74690.23320.87750.4270.945
69113142116562.9221107792.0139127895.01460.2770.82220.43170.9566
70106078112547.3805104293.4015123132.99630.11550.45620.4340.8621
71100992107964.6191100353.3653117620.06420.07850.64910.43570.6044
7297413105906.920198446.8576115368.47720.03920.84570.43790.4379

\begin{tabular}{lllllllll}
\hline
Univariate ARIMA Extrapolation Forecast \tabularnewline
time & Y[t] & F[t] & 95% LB & 95% UB & p-value(H0: Y[t] = F[t]) & P(F[t]>Y[t-1]) & P(F[t]>Y[t-s]) & P(F[t]>Y[60]) \tabularnewline
48 & 107496 & - & - & - & - & - & - & - \tabularnewline
49 & 105524 & - & - & - & - & - & - & - \tabularnewline
50 & 103824 & - & - & - & - & - & - & - \tabularnewline
51 & 101833 & - & - & - & - & - & - & - \tabularnewline
52 & 99436 & - & - & - & - & - & - & - \tabularnewline
53 & 96915 & - & - & - & - & - & - & - \tabularnewline
54 & 96072 & - & - & - & - & - & - & - \tabularnewline
55 & 111941 & - & - & - & - & - & - & - \tabularnewline
56 & 116008 & - & - & - & - & - & - & - \tabularnewline
57 & 117557 & - & - & - & - & - & - & - \tabularnewline
58 & 113445 & - & - & - & - & - & - & - \tabularnewline
59 & 108762 & - & - & - & - & - & - & - \tabularnewline
60 & 106661 & - & - & - & - & - & - & - \tabularnewline
61 & 102824 & 104661.6469 & 101923.349 & 107633.2118 & 0.1127 & 0.0936 & 0.2847 & 0.0936 \tabularnewline
62 & 101912 & 103079.1654 & 99221.6803 & 107424.6341 & 0.2993 & 0.5458 & 0.3685 & 0.0531 \tabularnewline
63 & 99005 & 101211.5849 & 96962.1118 & 106073.6841 & 0.1869 & 0.3888 & 0.4011 & 0.014 \tabularnewline
64 & 97894 & 98865.3632 & 94653.2145 & 103695.0276 & 0.3467 & 0.4774 & 0.4084 & 8e-04 \tabularnewline
65 & 96256 & 96357.923 & 92246.6587 & 101072.9148 & 0.4831 & 0.2616 & 0.4084 & 0 \tabularnewline
66 & 95606 & 95508.8246 & 91253.9762 & 100420.3357 & 0.4845 & 0.3828 & 0.4111 & 0 \tabularnewline
67 & 108948 & 111055.875 & 104096.5492 & 119628.0154 & 0.3149 & 0.9998 & 0.4198 & 0.8425 \tabularnewline
68 & 111223 & 115042.763 & 106939.6426 & 125319.7469 & 0.2332 & 0.8775 & 0.427 & 0.945 \tabularnewline
69 & 113142 & 116562.9221 & 107792.0139 & 127895.0146 & 0.277 & 0.8222 & 0.4317 & 0.9566 \tabularnewline
70 & 106078 & 112547.3805 & 104293.4015 & 123132.9963 & 0.1155 & 0.4562 & 0.434 & 0.8621 \tabularnewline
71 & 100992 & 107964.6191 & 100353.3653 & 117620.0642 & 0.0785 & 0.6491 & 0.4357 & 0.6044 \tabularnewline
72 & 97413 & 105906.9201 & 98446.8576 & 115368.4772 & 0.0392 & 0.8457 & 0.4379 & 0.4379 \tabularnewline
\hline
\end{tabular}
%Source: https://freestatistics.org/blog/index.php?pk=34448&T=1

[TABLE]
[ROW][C]Univariate ARIMA Extrapolation Forecast[/C][/ROW]
[ROW][C]time[/C][C]Y[t][/C][C]F[t][/C][C]95% LB[/C][C]95% UB[/C][C]p-value(H0: Y[t] = F[t])[/C][C]P(F[t]>Y[t-1])[/C][C]P(F[t]>Y[t-s])[/C][C]P(F[t]>Y[60])[/C][/ROW]
[ROW][C]48[/C][C]107496[/C][C]-[/C][C]-[/C][C]-[/C][C]-[/C][C]-[/C][C]-[/C][C]-[/C][/ROW]
[ROW][C]49[/C][C]105524[/C][C]-[/C][C]-[/C][C]-[/C][C]-[/C][C]-[/C][C]-[/C][C]-[/C][/ROW]
[ROW][C]50[/C][C]103824[/C][C]-[/C][C]-[/C][C]-[/C][C]-[/C][C]-[/C][C]-[/C][C]-[/C][/ROW]
[ROW][C]51[/C][C]101833[/C][C]-[/C][C]-[/C][C]-[/C][C]-[/C][C]-[/C][C]-[/C][C]-[/C][/ROW]
[ROW][C]52[/C][C]99436[/C][C]-[/C][C]-[/C][C]-[/C][C]-[/C][C]-[/C][C]-[/C][C]-[/C][/ROW]
[ROW][C]53[/C][C]96915[/C][C]-[/C][C]-[/C][C]-[/C][C]-[/C][C]-[/C][C]-[/C][C]-[/C][/ROW]
[ROW][C]54[/C][C]96072[/C][C]-[/C][C]-[/C][C]-[/C][C]-[/C][C]-[/C][C]-[/C][C]-[/C][/ROW]
[ROW][C]55[/C][C]111941[/C][C]-[/C][C]-[/C][C]-[/C][C]-[/C][C]-[/C][C]-[/C][C]-[/C][/ROW]
[ROW][C]56[/C][C]116008[/C][C]-[/C][C]-[/C][C]-[/C][C]-[/C][C]-[/C][C]-[/C][C]-[/C][/ROW]
[ROW][C]57[/C][C]117557[/C][C]-[/C][C]-[/C][C]-[/C][C]-[/C][C]-[/C][C]-[/C][C]-[/C][/ROW]
[ROW][C]58[/C][C]113445[/C][C]-[/C][C]-[/C][C]-[/C][C]-[/C][C]-[/C][C]-[/C][C]-[/C][/ROW]
[ROW][C]59[/C][C]108762[/C][C]-[/C][C]-[/C][C]-[/C][C]-[/C][C]-[/C][C]-[/C][C]-[/C][/ROW]
[ROW][C]60[/C][C]106661[/C][C]-[/C][C]-[/C][C]-[/C][C]-[/C][C]-[/C][C]-[/C][C]-[/C][/ROW]
[ROW][C]61[/C][C]102824[/C][C]104661.6469[/C][C]101923.349[/C][C]107633.2118[/C][C]0.1127[/C][C]0.0936[/C][C]0.2847[/C][C]0.0936[/C][/ROW]
[ROW][C]62[/C][C]101912[/C][C]103079.1654[/C][C]99221.6803[/C][C]107424.6341[/C][C]0.2993[/C][C]0.5458[/C][C]0.3685[/C][C]0.0531[/C][/ROW]
[ROW][C]63[/C][C]99005[/C][C]101211.5849[/C][C]96962.1118[/C][C]106073.6841[/C][C]0.1869[/C][C]0.3888[/C][C]0.4011[/C][C]0.014[/C][/ROW]
[ROW][C]64[/C][C]97894[/C][C]98865.3632[/C][C]94653.2145[/C][C]103695.0276[/C][C]0.3467[/C][C]0.4774[/C][C]0.4084[/C][C]8e-04[/C][/ROW]
[ROW][C]65[/C][C]96256[/C][C]96357.923[/C][C]92246.6587[/C][C]101072.9148[/C][C]0.4831[/C][C]0.2616[/C][C]0.4084[/C][C]0[/C][/ROW]
[ROW][C]66[/C][C]95606[/C][C]95508.8246[/C][C]91253.9762[/C][C]100420.3357[/C][C]0.4845[/C][C]0.3828[/C][C]0.4111[/C][C]0[/C][/ROW]
[ROW][C]67[/C][C]108948[/C][C]111055.875[/C][C]104096.5492[/C][C]119628.0154[/C][C]0.3149[/C][C]0.9998[/C][C]0.4198[/C][C]0.8425[/C][/ROW]
[ROW][C]68[/C][C]111223[/C][C]115042.763[/C][C]106939.6426[/C][C]125319.7469[/C][C]0.2332[/C][C]0.8775[/C][C]0.427[/C][C]0.945[/C][/ROW]
[ROW][C]69[/C][C]113142[/C][C]116562.9221[/C][C]107792.0139[/C][C]127895.0146[/C][C]0.277[/C][C]0.8222[/C][C]0.4317[/C][C]0.9566[/C][/ROW]
[ROW][C]70[/C][C]106078[/C][C]112547.3805[/C][C]104293.4015[/C][C]123132.9963[/C][C]0.1155[/C][C]0.4562[/C][C]0.434[/C][C]0.8621[/C][/ROW]
[ROW][C]71[/C][C]100992[/C][C]107964.6191[/C][C]100353.3653[/C][C]117620.0642[/C][C]0.0785[/C][C]0.6491[/C][C]0.4357[/C][C]0.6044[/C][/ROW]
[ROW][C]72[/C][C]97413[/C][C]105906.9201[/C][C]98446.8576[/C][C]115368.4772[/C][C]0.0392[/C][C]0.8457[/C][C]0.4379[/C][C]0.4379[/C][/ROW]
[/TABLE]
Source: https://freestatistics.org/blog/index.php?pk=34448&T=1

Globally Unique Identifier (entire table): ba.freestatistics.org/blog/index.php?pk=34448&T=1

As an alternative you can also use a QR Code:  

The GUIDs for individual cells are displayed in the table below:

Univariate ARIMA Extrapolation Forecast
timeY[t]F[t]95% LB95% UBp-value(H0: Y[t] = F[t])P(F[t]>Y[t-1])P(F[t]>Y[t-s])P(F[t]>Y[60])
48107496-------
49105524-------
50103824-------
51101833-------
5299436-------
5396915-------
5496072-------
55111941-------
56116008-------
57117557-------
58113445-------
59108762-------
60106661-------
61102824104661.6469101923.349107633.21180.11270.09360.28470.0936
62101912103079.165499221.6803107424.63410.29930.54580.36850.0531
6399005101211.584996962.1118106073.68410.18690.38880.40110.014
649789498865.363294653.2145103695.02760.34670.47740.40848e-04
659625696357.92392246.6587101072.91480.48310.26160.40840
669560695508.824691253.9762100420.33570.48450.38280.41110
67108948111055.875104096.5492119628.01540.31490.99980.41980.8425
68111223115042.763106939.6426125319.74690.23320.87750.4270.945
69113142116562.9221107792.0139127895.01460.2770.82220.43170.9566
70106078112547.3805104293.4015123132.99630.11550.45620.4340.8621
71100992107964.6191100353.3653117620.06420.07850.64910.43570.6044
7297413105906.920198446.8576115368.47720.03920.84570.43790.4379


Univariate ARIMA Extrapolation Forecast Performance
time% S.E.PEMAPESq.EMSERMSE
610.0145-0.01760.00153376945.9457281412.1621530.483
620.0215-0.01139e-041362275.0147113522.9179336.9316
630.0245-0.02180.00184869016.7193405751.3933636.9862
640.0249-0.00988e-04943546.377178628.8648280.4084
650.025-0.00111e-0410388.2996865.691629.4226
660.02620.0011e-049443.0579786.921528.0521
670.0394-0.0190.00164443136.8827370261.4069608.4911
680.0456-0.03320.002814590589.0531215882.42111102.6706
690.0496-0.02930.002411702708.0301975225.6692987.5351
700.048-0.05750.004841852883.62123487740.30181867.5493
710.0456-0.06460.005448617417.1044051451.42532012.8218
720.0456-0.08020.006772146678.93086012223.24422451.9835

\begin{tabular}{lllllllll}
\hline
Univariate ARIMA Extrapolation Forecast Performance \tabularnewline
time & % S.E. & PE & MAPE & Sq.E & MSE & RMSE \tabularnewline
61 & 0.0145 & -0.0176 & 0.0015 & 3376945.9457 & 281412.1621 & 530.483 \tabularnewline
62 & 0.0215 & -0.0113 & 9e-04 & 1362275.0147 & 113522.9179 & 336.9316 \tabularnewline
63 & 0.0245 & -0.0218 & 0.0018 & 4869016.7193 & 405751.3933 & 636.9862 \tabularnewline
64 & 0.0249 & -0.0098 & 8e-04 & 943546.3771 & 78628.8648 & 280.4084 \tabularnewline
65 & 0.025 & -0.0011 & 1e-04 & 10388.2996 & 865.6916 & 29.4226 \tabularnewline
66 & 0.0262 & 0.001 & 1e-04 & 9443.0579 & 786.9215 & 28.0521 \tabularnewline
67 & 0.0394 & -0.019 & 0.0016 & 4443136.8827 & 370261.4069 & 608.4911 \tabularnewline
68 & 0.0456 & -0.0332 & 0.0028 & 14590589.053 & 1215882.4211 & 1102.6706 \tabularnewline
69 & 0.0496 & -0.0293 & 0.0024 & 11702708.0301 & 975225.6692 & 987.5351 \tabularnewline
70 & 0.048 & -0.0575 & 0.0048 & 41852883.6212 & 3487740.3018 & 1867.5493 \tabularnewline
71 & 0.0456 & -0.0646 & 0.0054 & 48617417.104 & 4051451.4253 & 2012.8218 \tabularnewline
72 & 0.0456 & -0.0802 & 0.0067 & 72146678.9308 & 6012223.2442 & 2451.9835 \tabularnewline
\hline
\end{tabular}
%Source: https://freestatistics.org/blog/index.php?pk=34448&T=2

[TABLE]
[ROW][C]Univariate ARIMA Extrapolation Forecast Performance[/C][/ROW]
[ROW][C]time[/C][C]% S.E.[/C][C]PE[/C][C]MAPE[/C][C]Sq.E[/C][C]MSE[/C][C]RMSE[/C][/ROW]
[ROW][C]61[/C][C]0.0145[/C][C]-0.0176[/C][C]0.0015[/C][C]3376945.9457[/C][C]281412.1621[/C][C]530.483[/C][/ROW]
[ROW][C]62[/C][C]0.0215[/C][C]-0.0113[/C][C]9e-04[/C][C]1362275.0147[/C][C]113522.9179[/C][C]336.9316[/C][/ROW]
[ROW][C]63[/C][C]0.0245[/C][C]-0.0218[/C][C]0.0018[/C][C]4869016.7193[/C][C]405751.3933[/C][C]636.9862[/C][/ROW]
[ROW][C]64[/C][C]0.0249[/C][C]-0.0098[/C][C]8e-04[/C][C]943546.3771[/C][C]78628.8648[/C][C]280.4084[/C][/ROW]
[ROW][C]65[/C][C]0.025[/C][C]-0.0011[/C][C]1e-04[/C][C]10388.2996[/C][C]865.6916[/C][C]29.4226[/C][/ROW]
[ROW][C]66[/C][C]0.0262[/C][C]0.001[/C][C]1e-04[/C][C]9443.0579[/C][C]786.9215[/C][C]28.0521[/C][/ROW]
[ROW][C]67[/C][C]0.0394[/C][C]-0.019[/C][C]0.0016[/C][C]4443136.8827[/C][C]370261.4069[/C][C]608.4911[/C][/ROW]
[ROW][C]68[/C][C]0.0456[/C][C]-0.0332[/C][C]0.0028[/C][C]14590589.053[/C][C]1215882.4211[/C][C]1102.6706[/C][/ROW]
[ROW][C]69[/C][C]0.0496[/C][C]-0.0293[/C][C]0.0024[/C][C]11702708.0301[/C][C]975225.6692[/C][C]987.5351[/C][/ROW]
[ROW][C]70[/C][C]0.048[/C][C]-0.0575[/C][C]0.0048[/C][C]41852883.6212[/C][C]3487740.3018[/C][C]1867.5493[/C][/ROW]
[ROW][C]71[/C][C]0.0456[/C][C]-0.0646[/C][C]0.0054[/C][C]48617417.104[/C][C]4051451.4253[/C][C]2012.8218[/C][/ROW]
[ROW][C]72[/C][C]0.0456[/C][C]-0.0802[/C][C]0.0067[/C][C]72146678.9308[/C][C]6012223.2442[/C][C]2451.9835[/C][/ROW]
[/TABLE]
Source: https://freestatistics.org/blog/index.php?pk=34448&T=2

Globally Unique Identifier (entire table): ba.freestatistics.org/blog/index.php?pk=34448&T=2

As an alternative you can also use a QR Code:  

The GUIDs for individual cells are displayed in the table below:

Univariate ARIMA Extrapolation Forecast Performance
time% S.E.PEMAPESq.EMSERMSE
610.0145-0.01760.00153376945.9457281412.1621530.483
620.0215-0.01139e-041362275.0147113522.9179336.9316
630.0245-0.02180.00184869016.7193405751.3933636.9862
640.0249-0.00988e-04943546.377178628.8648280.4084
650.025-0.00111e-0410388.2996865.691629.4226
660.02620.0011e-049443.0579786.921528.0521
670.0394-0.0190.00164443136.8827370261.4069608.4911
680.0456-0.03320.002814590589.0531215882.42111102.6706
690.0496-0.02930.002411702708.0301975225.6692987.5351
700.048-0.05750.004841852883.62123487740.30181867.5493
710.0456-0.06460.005448617417.1044051451.42532012.8218
720.0456-0.08020.006772146678.93086012223.24422451.9835


Parameters (Session):
par1 = 12 ; par2 = -2.0 ; par3 = 1 ; par4 = 1 ; par5 = 12 ; par6 = 3 ; par7 = 0 ; par8 = 0 ; par9 = 0 ; par10 = FALSE ;
Parameters (R input):
par1 = 12 ; par2 = -2.0 ; par3 = 1 ; par4 = 1 ; par5 = 12 ; par6 = 3 ; par7 = 0 ; par8 = 0 ; par9 = 0 ; par10 = FALSE ;
R code (references can be found in the software module):
par1 <- as.numeric(par1) #cut off periods
par2 <- as.numeric(par2) #lambda
par3 <- as.numeric(par3) #degree of non-seasonal differencing
par4 <- as.numeric(par4) #degree of seasonal differencing
par5 <- as.numeric(par5) #seasonal period
par6 <- as.numeric(par6) #p
par7 <- as.numeric(par7) #q
par8 <- as.numeric(par8) #P
par9 <- as.numeric(par9) #Q
if (par10 == 'TRUE') par10 <- TRUE
if (par10 == 'FALSE') par10 <- FALSE
if (par2 == 0) x <- log(x)
if (par2 != 0) x <- x^par2
lx <- length(x)
first <- lx - 2*par1
nx <- lx - par1
nx1 <- nx + 1
fx <- lx - nx
if (fx < 1) {
fx <- par5
nx1 <- lx + fx - 1
first <- lx - 2*fx
}
first <- 1
if (fx < 3) fx <- round(lx/10,0)
(arima.out <- arima(x[1:nx], order=c(par6,par3,par7), seasonal=list(order=c(par8,par4,par9), period=par5), include.mean=par10, method='ML'))
(forecast <- predict(arima.out,fx))
(lb <- forecast$pred - 1.96 * forecast$se)
(ub <- forecast$pred + 1.96 * forecast$se)
if (par2 == 0) {
x <- exp(x)
forecast$pred <- exp(forecast$pred)
lb <- exp(lb)
ub <- exp(ub)
}
if (par2 != 0) {
x <- x^(1/par2)
forecast$pred <- forecast$pred^(1/par2)
lb <- lb^(1/par2)
ub <- ub^(1/par2)
}
if (par2 < 0) {
olb <- lb
lb <- ub
ub <- olb
}
(actandfor <- c(x[1:nx], forecast$pred))
(perc.se <- (ub-forecast$pred)/1.96/forecast$pred)
bitmap(file='test1.png')
opar <- par(mar=c(4,4,2,2),las=1)
ylim <- c( min(x[first:nx],lb), max(x[first:nx],ub))
plot(x,ylim=ylim,type='n',xlim=c(first,lx))
usr <- par('usr')
rect(usr[1],usr[3],nx+1,usr[4],border=NA,col='lemonchiffon')
rect(nx1,usr[3],usr[2],usr[4],border=NA,col='lavender')
abline(h= (-3:3)*2 , col ='gray', lty =3)
polygon( c(nx1:lx,lx:nx1), c(lb,rev(ub)), col = 'orange', lty=2,border=NA)
lines(nx1:lx, lb , lty=2)
lines(nx1:lx, ub , lty=2)
lines(x, lwd=2)
lines(nx1:lx, forecast$pred , lwd=2 , col ='white')
box()
par(opar)
dev.off()
prob.dec <- array(NA, dim=fx)
prob.sdec <- array(NA, dim=fx)
prob.ldec <- array(NA, dim=fx)
prob.pval <- array(NA, dim=fx)
perf.pe <- array(0, dim=fx)
perf.mape <- array(0, dim=fx)
perf.se <- array(0, dim=fx)
perf.mse <- array(0, dim=fx)
perf.rmse <- array(0, dim=fx)
for (i in 1:fx) {
locSD <- (ub[i] - forecast$pred[i]) / 1.96
perf.pe[i] = (x[nx+i] - forecast$pred[i]) / forecast$pred[i]
perf.mape[i] = perf.mape[i] + abs(perf.pe[i])
perf.se[i] = (x[nx+i] - forecast$pred[i])^2
perf.mse[i] = perf.mse[i] + perf.se[i]
prob.dec[i] = pnorm((x[nx+i-1] - forecast$pred[i]) / locSD)
prob.sdec[i] = pnorm((x[nx+i-par5] - forecast$pred[i]) / locSD)
prob.ldec[i] = pnorm((x[nx] - forecast$pred[i]) / locSD)
prob.pval[i] = pnorm(abs(x[nx+i] - forecast$pred[i]) / locSD)
}
perf.mape = perf.mape / fx
perf.mse = perf.mse / fx
perf.rmse = sqrt(perf.mse)
bitmap(file='test2.png')
plot(forecast$pred, pch=19, type='b',main='ARIMA Extrapolation Forecast', ylab='Forecast and 95% CI', xlab='time',ylim=c(min(lb),max(ub)))
dum <- forecast$pred
dum[1:12] <- x[(nx+1):lx]
lines(dum, lty=1)
lines(ub,lty=3)
lines(lb,lty=3)
dev.off()
load(file='createtable')
a<-table.start()
a<-table.row.start(a)
a<-table.element(a,'Univariate ARIMA Extrapolation Forecast',9,TRUE)
a<-table.row.end(a)
a<-table.row.start(a)
a<-table.element(a,'time',1,header=TRUE)
a<-table.element(a,'Y[t]',1,header=TRUE)
a<-table.element(a,'F[t]',1,header=TRUE)
a<-table.element(a,'95% LB',1,header=TRUE)
a<-table.element(a,'95% UB',1,header=TRUE)
a<-table.element(a,'p-value
(H0: Y[t] = F[t])',1,header=TRUE)
a<-table.element(a,'P(F[t]>Y[t-1])',1,header=TRUE)
a<-table.element(a,'P(F[t]>Y[t-s])',1,header=TRUE)
mylab <- paste('P(F[t]>Y[',nx,sep='')
mylab <- paste(mylab,'])',sep='')
a<-table.element(a,mylab,1,header=TRUE)
a<-table.row.end(a)
for (i in (nx-par5):nx) {
a<-table.row.start(a)
a<-table.element(a,i,header=TRUE)
a<-table.element(a,x[i])
a<-table.element(a,'-')
a<-table.row.end(a)
}
for (i in 1:fx) {
a<-table.row.start(a)
a<-table.element(a,nx+i,header=TRUE)
a<-table.element(a,round(x[nx+i],4))
a<-table.element(a,round(forecast$pred[i],4))
a<-table.element(a,round(lb[i],4))
a<-table.element(a,round(ub[i],4))
a<-table.element(a,round((1-prob.pval[i]),4))
a<-table.element(a,round((1-prob.dec[i]),4))
a<-table.element(a,round((1-prob.sdec[i]),4))
a<-table.element(a,round((1-prob.ldec[i]),4))
a<-table.row.end(a)
}
a<-table.end(a)
table.save(a,file='mytable.tab')
a<-table.start()
a<-table.row.start(a)
a<-table.element(a,'Univariate ARIMA Extrapolation Forecast Performance',7,TRUE)
a<-table.row.end(a)
a<-table.row.start(a)
a<-table.element(a,'time',1,header=TRUE)
a<-table.element(a,'% S.E.',1,header=TRUE)
a<-table.element(a,'PE',1,header=TRUE)
a<-table.element(a,'MAPE',1,header=TRUE)
a<-table.element(a,'Sq.E',1,header=TRUE)
a<-table.element(a,'MSE',1,header=TRUE)
a<-table.element(a,'RMSE',1,header=TRUE)
a<-table.row.end(a)
for (i in 1:fx) {
a<-table.row.start(a)
a<-table.element(a,nx+i,header=TRUE)
a<-table.element(a,round(perc.se[i],4))
a<-table.element(a,round(perf.pe[i],4))
a<-table.element(a,round(perf.mape[i],4))
a<-table.element(a,round(perf.se[i],4))
a<-table.element(a,round(perf.mse[i],4))
a<-table.element(a,round(perf.rmse[i],4))
a<-table.row.end(a)
}
a<-table.end(a)
table.save(a,file='mytable1.tab')