Free Statistics

of Irreproducible Research!

Author's title

Author*The author of this computation has been verified*
R Software Modulerwasp_autocorrelation.wasp
Title produced by software(Partial) Autocorrelation Function
Date of computationWed, 17 Dec 2008 05:54:04 -0700
Cite this page as followsStatistical Computations at FreeStatistics.org, Office for Research Development and Education, URL https://freestatistics.org/blog/index.php?v=date/2008/Dec/17/t1229518475voucyo6e8uof24o.htm/, Retrieved Thu, 23 May 2024 02:55:36 +0000
Statistical Computations at FreeStatistics.org, Office for Research Development and Education, URL https://freestatistics.org/blog/index.php?pk=34320, Retrieved Thu, 23 May 2024 02:55:36 +0000
QR Codes:

Original text written by user:
IsPrivate?No (this computation is public)
User-defined keywords
Estimated Impact200
Family? (F = Feedback message, R = changed R code, M = changed R Module, P = changed Parameters, D = changed Data)
-       [(Partial) Autocorrelation Function] [] [2008-12-17 12:54:04] [c66d07e79164cd7acb2569833ec5bcd8] [Current]
- RMP     [ARIMA Backward Selection] [] [2008-12-17 13:46:44] [ca30429b07824e7c5d48293114d35d71]
- RMPD      [Central Tendency] [] [2008-12-17 23:19:42] [ca30429b07824e7c5d48293114d35d71]
- RMP       [ARIMA Forecasting] [] [2008-12-17 23:24:49] [ca30429b07824e7c5d48293114d35d71]
- RMPD    [Kendall tau Correlation Matrix] [] [2008-12-18 16:50:29] [ca30429b07824e7c5d48293114d35d71]
Feedback Forum

Post a new message
Dataseries X:
15023.6
12083
15761.3
16943
15070.3
13659.6
14768.9
14725.1
15998.1
15370.6
14956.9
15469.7
15101.8
11703.7
16283.6
16726.5
14968.9
14861
14583.3
15305.8
17903.9
16379.4
15420.3
17870.5
15912.8
13866.5
17823.2
17872
17420.4
16704.4
15991.2
16583.6
19123.5
17838.7
17209.4
18586.5
16258.1
15141.6
19202.1
17746.5
19090.1
18040.3
17515.5
17751.8
21072.4
17170
19439.5
19795.4
17574.9
16165.4
19464.6
19932.1
19961.2
17343.4
18924.2
18574.1
21350.6
18840.1
20304.8
21132.4
19753.9


Summary of computational transaction
Raw Inputview raw input (R code)
Raw Outputview raw output of R engine
Computing time1 seconds
R Server'Gwilym Jenkins' @ 72.249.127.135

\begin{tabular}{lllllllll}
\hline
Summary of computational transaction \tabularnewline
Raw Input & view raw input (R code)  \tabularnewline
Raw Output & view raw output of R engine  \tabularnewline
Computing time & 1 seconds \tabularnewline
R Server & 'Gwilym Jenkins' @ 72.249.127.135 \tabularnewline
\hline
\end{tabular}
%Source: https://freestatistics.org/blog/index.php?pk=34320&T=0

[TABLE]
[ROW][C]Summary of computational transaction[/C][/ROW]
[ROW][C]Raw Input[/C][C]view raw input (R code) [/C][/ROW]
[ROW][C]Raw Output[/C][C]view raw output of R engine [/C][/ROW]
[ROW][C]Computing time[/C][C]1 seconds[/C][/ROW]
[ROW][C]R Server[/C][C]'Gwilym Jenkins' @ 72.249.127.135[/C][/ROW]
[/TABLE]
Source: https://freestatistics.org/blog/index.php?pk=34320&T=0

Globally Unique Identifier (entire table): ba.freestatistics.org/blog/index.php?pk=34320&T=0

As an alternative you can also use a QR Code:  

The GUIDs for individual cells are displayed in the table below:

Summary of computational transaction
Raw Inputview raw input (R code)
Raw Outputview raw output of R engine
Computing time1 seconds
R Server'Gwilym Jenkins' @ 72.249.127.135


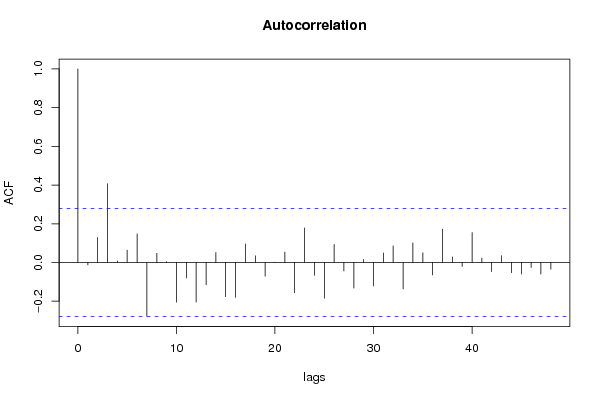
Autocorrelation Function
Time lag kACF(k)T-STATP-value
1-0.012684-0.08880.464806
20.1288890.90220.185676
30.4073052.85110.003179
40.0079270.05550.477987
50.0638120.44670.328536
60.1473041.03110.153772
7-0.277862-1.9450.028761
80.0475970.33320.370211
90.0042990.03010.488056
10-0.204971-1.43480.078848
11-0.080207-0.56150.288524
12-0.204417-1.43090.0794
13-0.115423-0.8080.211509
140.0515130.36060.359976
15-0.176537-1.23580.11122
16-0.180007-1.260.10681
170.0954040.66780.253688
180.0342090.23950.405874
19-0.070706-0.49490.311427
200.001450.01020.495971
210.053840.37690.353945
22-0.156724-1.09710.138987
230.1784441.24910.10878
24-0.066564-0.46590.321659
25-0.184562-1.29190.10122
260.0932910.6530.258392
27-0.043735-0.30610.380396
28-0.131976-0.92380.180051
290.0156960.10990.45648
30-0.121461-0.85020.199668
310.0491760.34420.366073
320.0856330.59940.275824
33-0.137058-0.95940.171031
340.1009820.70690.241496
350.0502210.35150.363342
36-0.064731-0.45310.326232
370.172231.20560.116879
380.0285060.19950.421333
39-0.02092-0.14640.442086
400.1544671.08130.142435
410.0230480.16130.436246
42-0.047181-0.33030.371303
430.0352660.24690.403024
44-0.052609-0.36830.357131
45-0.060088-0.42060.337937
46-0.025655-0.17960.429109
47-0.059637-0.41750.339083
48-0.034793-0.24350.404299
49NANANA
50NANANA
51NANANA
52NANANA
53NANANA
54NANANA
55NANANA
56NANANA
57NANANA
58NANANA
59NANANA
60NANANA

\begin{tabular}{lllllllll}
\hline
Autocorrelation Function \tabularnewline
Time lag k & ACF(k) & T-STAT & P-value \tabularnewline
1 & -0.012684 & -0.0888 & 0.464806 \tabularnewline
2 & 0.128889 & 0.9022 & 0.185676 \tabularnewline
3 & 0.407305 & 2.8511 & 0.003179 \tabularnewline
4 & 0.007927 & 0.0555 & 0.477987 \tabularnewline
5 & 0.063812 & 0.4467 & 0.328536 \tabularnewline
6 & 0.147304 & 1.0311 & 0.153772 \tabularnewline
7 & -0.277862 & -1.945 & 0.028761 \tabularnewline
8 & 0.047597 & 0.3332 & 0.370211 \tabularnewline
9 & 0.004299 & 0.0301 & 0.488056 \tabularnewline
10 & -0.204971 & -1.4348 & 0.078848 \tabularnewline
11 & -0.080207 & -0.5615 & 0.288524 \tabularnewline
12 & -0.204417 & -1.4309 & 0.0794 \tabularnewline
13 & -0.115423 & -0.808 & 0.211509 \tabularnewline
14 & 0.051513 & 0.3606 & 0.359976 \tabularnewline
15 & -0.176537 & -1.2358 & 0.11122 \tabularnewline
16 & -0.180007 & -1.26 & 0.10681 \tabularnewline
17 & 0.095404 & 0.6678 & 0.253688 \tabularnewline
18 & 0.034209 & 0.2395 & 0.405874 \tabularnewline
19 & -0.070706 & -0.4949 & 0.311427 \tabularnewline
20 & 0.00145 & 0.0102 & 0.495971 \tabularnewline
21 & 0.05384 & 0.3769 & 0.353945 \tabularnewline
22 & -0.156724 & -1.0971 & 0.138987 \tabularnewline
23 & 0.178444 & 1.2491 & 0.10878 \tabularnewline
24 & -0.066564 & -0.4659 & 0.321659 \tabularnewline
25 & -0.184562 & -1.2919 & 0.10122 \tabularnewline
26 & 0.093291 & 0.653 & 0.258392 \tabularnewline
27 & -0.043735 & -0.3061 & 0.380396 \tabularnewline
28 & -0.131976 & -0.9238 & 0.180051 \tabularnewline
29 & 0.015696 & 0.1099 & 0.45648 \tabularnewline
30 & -0.121461 & -0.8502 & 0.199668 \tabularnewline
31 & 0.049176 & 0.3442 & 0.366073 \tabularnewline
32 & 0.085633 & 0.5994 & 0.275824 \tabularnewline
33 & -0.137058 & -0.9594 & 0.171031 \tabularnewline
34 & 0.100982 & 0.7069 & 0.241496 \tabularnewline
35 & 0.050221 & 0.3515 & 0.363342 \tabularnewline
36 & -0.064731 & -0.4531 & 0.326232 \tabularnewline
37 & 0.17223 & 1.2056 & 0.116879 \tabularnewline
38 & 0.028506 & 0.1995 & 0.421333 \tabularnewline
39 & -0.02092 & -0.1464 & 0.442086 \tabularnewline
40 & 0.154467 & 1.0813 & 0.142435 \tabularnewline
41 & 0.023048 & 0.1613 & 0.436246 \tabularnewline
42 & -0.047181 & -0.3303 & 0.371303 \tabularnewline
43 & 0.035266 & 0.2469 & 0.403024 \tabularnewline
44 & -0.052609 & -0.3683 & 0.357131 \tabularnewline
45 & -0.060088 & -0.4206 & 0.337937 \tabularnewline
46 & -0.025655 & -0.1796 & 0.429109 \tabularnewline
47 & -0.059637 & -0.4175 & 0.339083 \tabularnewline
48 & -0.034793 & -0.2435 & 0.404299 \tabularnewline
49 & NA & NA & NA \tabularnewline
50 & NA & NA & NA \tabularnewline
51 & NA & NA & NA \tabularnewline
52 & NA & NA & NA \tabularnewline
53 & NA & NA & NA \tabularnewline
54 & NA & NA & NA \tabularnewline
55 & NA & NA & NA \tabularnewline
56 & NA & NA & NA \tabularnewline
57 & NA & NA & NA \tabularnewline
58 & NA & NA & NA \tabularnewline
59 & NA & NA & NA \tabularnewline
60 & NA & NA & NA \tabularnewline
\hline
\end{tabular}
%Source: https://freestatistics.org/blog/index.php?pk=34320&T=1

[TABLE]
[ROW][C]Autocorrelation Function[/C][/ROW]
[ROW][C]Time lag k[/C][C]ACF(k)[/C][C]T-STAT[/C][C]P-value[/C][/ROW]
[ROW][C]1[/C][C]-0.012684[/C][C]-0.0888[/C][C]0.464806[/C][/ROW]
[ROW][C]2[/C][C]0.128889[/C][C]0.9022[/C][C]0.185676[/C][/ROW]
[ROW][C]3[/C][C]0.407305[/C][C]2.8511[/C][C]0.003179[/C][/ROW]
[ROW][C]4[/C][C]0.007927[/C][C]0.0555[/C][C]0.477987[/C][/ROW]
[ROW][C]5[/C][C]0.063812[/C][C]0.4467[/C][C]0.328536[/C][/ROW]
[ROW][C]6[/C][C]0.147304[/C][C]1.0311[/C][C]0.153772[/C][/ROW]
[ROW][C]7[/C][C]-0.277862[/C][C]-1.945[/C][C]0.028761[/C][/ROW]
[ROW][C]8[/C][C]0.047597[/C][C]0.3332[/C][C]0.370211[/C][/ROW]
[ROW][C]9[/C][C]0.004299[/C][C]0.0301[/C][C]0.488056[/C][/ROW]
[ROW][C]10[/C][C]-0.204971[/C][C]-1.4348[/C][C]0.078848[/C][/ROW]
[ROW][C]11[/C][C]-0.080207[/C][C]-0.5615[/C][C]0.288524[/C][/ROW]
[ROW][C]12[/C][C]-0.204417[/C][C]-1.4309[/C][C]0.0794[/C][/ROW]
[ROW][C]13[/C][C]-0.115423[/C][C]-0.808[/C][C]0.211509[/C][/ROW]
[ROW][C]14[/C][C]0.051513[/C][C]0.3606[/C][C]0.359976[/C][/ROW]
[ROW][C]15[/C][C]-0.176537[/C][C]-1.2358[/C][C]0.11122[/C][/ROW]
[ROW][C]16[/C][C]-0.180007[/C][C]-1.26[/C][C]0.10681[/C][/ROW]
[ROW][C]17[/C][C]0.095404[/C][C]0.6678[/C][C]0.253688[/C][/ROW]
[ROW][C]18[/C][C]0.034209[/C][C]0.2395[/C][C]0.405874[/C][/ROW]
[ROW][C]19[/C][C]-0.070706[/C][C]-0.4949[/C][C]0.311427[/C][/ROW]
[ROW][C]20[/C][C]0.00145[/C][C]0.0102[/C][C]0.495971[/C][/ROW]
[ROW][C]21[/C][C]0.05384[/C][C]0.3769[/C][C]0.353945[/C][/ROW]
[ROW][C]22[/C][C]-0.156724[/C][C]-1.0971[/C][C]0.138987[/C][/ROW]
[ROW][C]23[/C][C]0.178444[/C][C]1.2491[/C][C]0.10878[/C][/ROW]
[ROW][C]24[/C][C]-0.066564[/C][C]-0.4659[/C][C]0.321659[/C][/ROW]
[ROW][C]25[/C][C]-0.184562[/C][C]-1.2919[/C][C]0.10122[/C][/ROW]
[ROW][C]26[/C][C]0.093291[/C][C]0.653[/C][C]0.258392[/C][/ROW]
[ROW][C]27[/C][C]-0.043735[/C][C]-0.3061[/C][C]0.380396[/C][/ROW]
[ROW][C]28[/C][C]-0.131976[/C][C]-0.9238[/C][C]0.180051[/C][/ROW]
[ROW][C]29[/C][C]0.015696[/C][C]0.1099[/C][C]0.45648[/C][/ROW]
[ROW][C]30[/C][C]-0.121461[/C][C]-0.8502[/C][C]0.199668[/C][/ROW]
[ROW][C]31[/C][C]0.049176[/C][C]0.3442[/C][C]0.366073[/C][/ROW]
[ROW][C]32[/C][C]0.085633[/C][C]0.5994[/C][C]0.275824[/C][/ROW]
[ROW][C]33[/C][C]-0.137058[/C][C]-0.9594[/C][C]0.171031[/C][/ROW]
[ROW][C]34[/C][C]0.100982[/C][C]0.7069[/C][C]0.241496[/C][/ROW]
[ROW][C]35[/C][C]0.050221[/C][C]0.3515[/C][C]0.363342[/C][/ROW]
[ROW][C]36[/C][C]-0.064731[/C][C]-0.4531[/C][C]0.326232[/C][/ROW]
[ROW][C]37[/C][C]0.17223[/C][C]1.2056[/C][C]0.116879[/C][/ROW]
[ROW][C]38[/C][C]0.028506[/C][C]0.1995[/C][C]0.421333[/C][/ROW]
[ROW][C]39[/C][C]-0.02092[/C][C]-0.1464[/C][C]0.442086[/C][/ROW]
[ROW][C]40[/C][C]0.154467[/C][C]1.0813[/C][C]0.142435[/C][/ROW]
[ROW][C]41[/C][C]0.023048[/C][C]0.1613[/C][C]0.436246[/C][/ROW]
[ROW][C]42[/C][C]-0.047181[/C][C]-0.3303[/C][C]0.371303[/C][/ROW]
[ROW][C]43[/C][C]0.035266[/C][C]0.2469[/C][C]0.403024[/C][/ROW]
[ROW][C]44[/C][C]-0.052609[/C][C]-0.3683[/C][C]0.357131[/C][/ROW]
[ROW][C]45[/C][C]-0.060088[/C][C]-0.4206[/C][C]0.337937[/C][/ROW]
[ROW][C]46[/C][C]-0.025655[/C][C]-0.1796[/C][C]0.429109[/C][/ROW]
[ROW][C]47[/C][C]-0.059637[/C][C]-0.4175[/C][C]0.339083[/C][/ROW]
[ROW][C]48[/C][C]-0.034793[/C][C]-0.2435[/C][C]0.404299[/C][/ROW]
[ROW][C]49[/C][C]NA[/C][C]NA[/C][C]NA[/C][/ROW]
[ROW][C]50[/C][C]NA[/C][C]NA[/C][C]NA[/C][/ROW]
[ROW][C]51[/C][C]NA[/C][C]NA[/C][C]NA[/C][/ROW]
[ROW][C]52[/C][C]NA[/C][C]NA[/C][C]NA[/C][/ROW]
[ROW][C]53[/C][C]NA[/C][C]NA[/C][C]NA[/C][/ROW]
[ROW][C]54[/C][C]NA[/C][C]NA[/C][C]NA[/C][/ROW]
[ROW][C]55[/C][C]NA[/C][C]NA[/C][C]NA[/C][/ROW]
[ROW][C]56[/C][C]NA[/C][C]NA[/C][C]NA[/C][/ROW]
[ROW][C]57[/C][C]NA[/C][C]NA[/C][C]NA[/C][/ROW]
[ROW][C]58[/C][C]NA[/C][C]NA[/C][C]NA[/C][/ROW]
[ROW][C]59[/C][C]NA[/C][C]NA[/C][C]NA[/C][/ROW]
[ROW][C]60[/C][C]NA[/C][C]NA[/C][C]NA[/C][/ROW]
[/TABLE]
Source: https://freestatistics.org/blog/index.php?pk=34320&T=1

Globally Unique Identifier (entire table): ba.freestatistics.org/blog/index.php?pk=34320&T=1

As an alternative you can also use a QR Code:  

The GUIDs for individual cells are displayed in the table below:

Autocorrelation Function
Time lag kACF(k)T-STATP-value
1-0.012684-0.08880.464806
20.1288890.90220.185676
30.4073052.85110.003179
40.0079270.05550.477987
50.0638120.44670.328536
60.1473041.03110.153772
7-0.277862-1.9450.028761
80.0475970.33320.370211
90.0042990.03010.488056
10-0.204971-1.43480.078848
11-0.080207-0.56150.288524
12-0.204417-1.43090.0794
13-0.115423-0.8080.211509
140.0515130.36060.359976
15-0.176537-1.23580.11122
16-0.180007-1.260.10681
170.0954040.66780.253688
180.0342090.23950.405874
19-0.070706-0.49490.311427
200.001450.01020.495971
210.053840.37690.353945
22-0.156724-1.09710.138987
230.1784441.24910.10878
24-0.066564-0.46590.321659
25-0.184562-1.29190.10122
260.0932910.6530.258392
27-0.043735-0.30610.380396
28-0.131976-0.92380.180051
290.0156960.10990.45648
30-0.121461-0.85020.199668
310.0491760.34420.366073
320.0856330.59940.275824
33-0.137058-0.95940.171031
340.1009820.70690.241496
350.0502210.35150.363342
36-0.064731-0.45310.326232
370.172231.20560.116879
380.0285060.19950.421333
39-0.02092-0.14640.442086
400.1544671.08130.142435
410.0230480.16130.436246
42-0.047181-0.33030.371303
430.0352660.24690.403024
44-0.052609-0.36830.357131
45-0.060088-0.42060.337937
46-0.025655-0.17960.429109
47-0.059637-0.41750.339083
48-0.034793-0.24350.404299
49NANANA
50NANANA
51NANANA
52NANANA
53NANANA
54NANANA
55NANANA
56NANANA
57NANANA
58NANANA
59NANANA
60NANANA


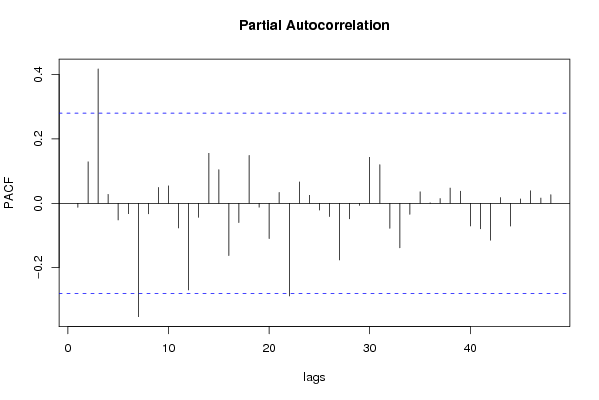
Partial Autocorrelation Function
Time lag kPACF(k)T-STATP-value
1-0.012684-0.08880.464806
20.1287490.90120.185934
30.4173472.92140.002628
40.0276090.19330.423775
5-0.051854-0.3630.35909
6-0.032477-0.22730.410554
7-0.352364-2.46650.008594
8-0.032693-0.22890.409969
90.049250.34480.365879
100.0540360.37830.353438
11-0.076876-0.53810.296461
12-0.269244-1.88470.032704
13-0.043534-0.30470.380928
140.1551441.0860.141395
150.1044590.73120.234065
16-0.162672-1.13870.130182
17-0.059889-0.41920.338443
180.1485021.03950.151835
19-0.012072-0.08450.466499
20-0.109781-0.76850.222948
210.0335450.23480.407665
22-0.287802-2.01460.024725
230.0663470.46440.3222
240.0248350.17380.431352
25-0.021262-0.14880.441149
26-0.04134-0.28940.386756
27-0.176304-1.23410.111521
28-0.048211-0.33750.3686
29-0.006786-0.04750.481154
300.142961.00070.160939
310.1197170.8380.203044
32-0.077692-0.54380.294507
33-0.13847-0.96930.168581
34-0.034335-0.24030.405531
350.0356090.24930.402099
360.0015160.01060.495788
370.0147380.10320.459125
380.0472890.3310.37102
390.0373780.26160.397345
40-0.070387-0.49270.312209
41-0.079261-0.55480.290768
42-0.114961-0.80470.212433
430.017580.12310.45128
44-0.070973-0.49680.310771
450.013490.09440.462577
460.0385470.26980.394212
470.0163480.11440.45468
480.0265260.18570.426729
49NANANA
50NANANA
51NANANA
52NANANA
53NANANA
54NANANA
55NANANA
56NANANA
57NANANA
58NANANA
59NANANA
60NANANA

\begin{tabular}{lllllllll}
\hline
Partial Autocorrelation Function \tabularnewline
Time lag k & PACF(k) & T-STAT & P-value \tabularnewline
1 & -0.012684 & -0.0888 & 0.464806 \tabularnewline
2 & 0.128749 & 0.9012 & 0.185934 \tabularnewline
3 & 0.417347 & 2.9214 & 0.002628 \tabularnewline
4 & 0.027609 & 0.1933 & 0.423775 \tabularnewline
5 & -0.051854 & -0.363 & 0.35909 \tabularnewline
6 & -0.032477 & -0.2273 & 0.410554 \tabularnewline
7 & -0.352364 & -2.4665 & 0.008594 \tabularnewline
8 & -0.032693 & -0.2289 & 0.409969 \tabularnewline
9 & 0.04925 & 0.3448 & 0.365879 \tabularnewline
10 & 0.054036 & 0.3783 & 0.353438 \tabularnewline
11 & -0.076876 & -0.5381 & 0.296461 \tabularnewline
12 & -0.269244 & -1.8847 & 0.032704 \tabularnewline
13 & -0.043534 & -0.3047 & 0.380928 \tabularnewline
14 & 0.155144 & 1.086 & 0.141395 \tabularnewline
15 & 0.104459 & 0.7312 & 0.234065 \tabularnewline
16 & -0.162672 & -1.1387 & 0.130182 \tabularnewline
17 & -0.059889 & -0.4192 & 0.338443 \tabularnewline
18 & 0.148502 & 1.0395 & 0.151835 \tabularnewline
19 & -0.012072 & -0.0845 & 0.466499 \tabularnewline
20 & -0.109781 & -0.7685 & 0.222948 \tabularnewline
21 & 0.033545 & 0.2348 & 0.407665 \tabularnewline
22 & -0.287802 & -2.0146 & 0.024725 \tabularnewline
23 & 0.066347 & 0.4644 & 0.3222 \tabularnewline
24 & 0.024835 & 0.1738 & 0.431352 \tabularnewline
25 & -0.021262 & -0.1488 & 0.441149 \tabularnewline
26 & -0.04134 & -0.2894 & 0.386756 \tabularnewline
27 & -0.176304 & -1.2341 & 0.111521 \tabularnewline
28 & -0.048211 & -0.3375 & 0.3686 \tabularnewline
29 & -0.006786 & -0.0475 & 0.481154 \tabularnewline
30 & 0.14296 & 1.0007 & 0.160939 \tabularnewline
31 & 0.119717 & 0.838 & 0.203044 \tabularnewline
32 & -0.077692 & -0.5438 & 0.294507 \tabularnewline
33 & -0.13847 & -0.9693 & 0.168581 \tabularnewline
34 & -0.034335 & -0.2403 & 0.405531 \tabularnewline
35 & 0.035609 & 0.2493 & 0.402099 \tabularnewline
36 & 0.001516 & 0.0106 & 0.495788 \tabularnewline
37 & 0.014738 & 0.1032 & 0.459125 \tabularnewline
38 & 0.047289 & 0.331 & 0.37102 \tabularnewline
39 & 0.037378 & 0.2616 & 0.397345 \tabularnewline
40 & -0.070387 & -0.4927 & 0.312209 \tabularnewline
41 & -0.079261 & -0.5548 & 0.290768 \tabularnewline
42 & -0.114961 & -0.8047 & 0.212433 \tabularnewline
43 & 0.01758 & 0.1231 & 0.45128 \tabularnewline
44 & -0.070973 & -0.4968 & 0.310771 \tabularnewline
45 & 0.01349 & 0.0944 & 0.462577 \tabularnewline
46 & 0.038547 & 0.2698 & 0.394212 \tabularnewline
47 & 0.016348 & 0.1144 & 0.45468 \tabularnewline
48 & 0.026526 & 0.1857 & 0.426729 \tabularnewline
49 & NA & NA & NA \tabularnewline
50 & NA & NA & NA \tabularnewline
51 & NA & NA & NA \tabularnewline
52 & NA & NA & NA \tabularnewline
53 & NA & NA & NA \tabularnewline
54 & NA & NA & NA \tabularnewline
55 & NA & NA & NA \tabularnewline
56 & NA & NA & NA \tabularnewline
57 & NA & NA & NA \tabularnewline
58 & NA & NA & NA \tabularnewline
59 & NA & NA & NA \tabularnewline
60 & NA & NA & NA \tabularnewline
\hline
\end{tabular}
%Source: https://freestatistics.org/blog/index.php?pk=34320&T=2

[TABLE]
[ROW][C]Partial Autocorrelation Function[/C][/ROW]
[ROW][C]Time lag k[/C][C]PACF(k)[/C][C]T-STAT[/C][C]P-value[/C][/ROW]
[ROW][C]1[/C][C]-0.012684[/C][C]-0.0888[/C][C]0.464806[/C][/ROW]
[ROW][C]2[/C][C]0.128749[/C][C]0.9012[/C][C]0.185934[/C][/ROW]
[ROW][C]3[/C][C]0.417347[/C][C]2.9214[/C][C]0.002628[/C][/ROW]
[ROW][C]4[/C][C]0.027609[/C][C]0.1933[/C][C]0.423775[/C][/ROW]
[ROW][C]5[/C][C]-0.051854[/C][C]-0.363[/C][C]0.35909[/C][/ROW]
[ROW][C]6[/C][C]-0.032477[/C][C]-0.2273[/C][C]0.410554[/C][/ROW]
[ROW][C]7[/C][C]-0.352364[/C][C]-2.4665[/C][C]0.008594[/C][/ROW]
[ROW][C]8[/C][C]-0.032693[/C][C]-0.2289[/C][C]0.409969[/C][/ROW]
[ROW][C]9[/C][C]0.04925[/C][C]0.3448[/C][C]0.365879[/C][/ROW]
[ROW][C]10[/C][C]0.054036[/C][C]0.3783[/C][C]0.353438[/C][/ROW]
[ROW][C]11[/C][C]-0.076876[/C][C]-0.5381[/C][C]0.296461[/C][/ROW]
[ROW][C]12[/C][C]-0.269244[/C][C]-1.8847[/C][C]0.032704[/C][/ROW]
[ROW][C]13[/C][C]-0.043534[/C][C]-0.3047[/C][C]0.380928[/C][/ROW]
[ROW][C]14[/C][C]0.155144[/C][C]1.086[/C][C]0.141395[/C][/ROW]
[ROW][C]15[/C][C]0.104459[/C][C]0.7312[/C][C]0.234065[/C][/ROW]
[ROW][C]16[/C][C]-0.162672[/C][C]-1.1387[/C][C]0.130182[/C][/ROW]
[ROW][C]17[/C][C]-0.059889[/C][C]-0.4192[/C][C]0.338443[/C][/ROW]
[ROW][C]18[/C][C]0.148502[/C][C]1.0395[/C][C]0.151835[/C][/ROW]
[ROW][C]19[/C][C]-0.012072[/C][C]-0.0845[/C][C]0.466499[/C][/ROW]
[ROW][C]20[/C][C]-0.109781[/C][C]-0.7685[/C][C]0.222948[/C][/ROW]
[ROW][C]21[/C][C]0.033545[/C][C]0.2348[/C][C]0.407665[/C][/ROW]
[ROW][C]22[/C][C]-0.287802[/C][C]-2.0146[/C][C]0.024725[/C][/ROW]
[ROW][C]23[/C][C]0.066347[/C][C]0.4644[/C][C]0.3222[/C][/ROW]
[ROW][C]24[/C][C]0.024835[/C][C]0.1738[/C][C]0.431352[/C][/ROW]
[ROW][C]25[/C][C]-0.021262[/C][C]-0.1488[/C][C]0.441149[/C][/ROW]
[ROW][C]26[/C][C]-0.04134[/C][C]-0.2894[/C][C]0.386756[/C][/ROW]
[ROW][C]27[/C][C]-0.176304[/C][C]-1.2341[/C][C]0.111521[/C][/ROW]
[ROW][C]28[/C][C]-0.048211[/C][C]-0.3375[/C][C]0.3686[/C][/ROW]
[ROW][C]29[/C][C]-0.006786[/C][C]-0.0475[/C][C]0.481154[/C][/ROW]
[ROW][C]30[/C][C]0.14296[/C][C]1.0007[/C][C]0.160939[/C][/ROW]
[ROW][C]31[/C][C]0.119717[/C][C]0.838[/C][C]0.203044[/C][/ROW]
[ROW][C]32[/C][C]-0.077692[/C][C]-0.5438[/C][C]0.294507[/C][/ROW]
[ROW][C]33[/C][C]-0.13847[/C][C]-0.9693[/C][C]0.168581[/C][/ROW]
[ROW][C]34[/C][C]-0.034335[/C][C]-0.2403[/C][C]0.405531[/C][/ROW]
[ROW][C]35[/C][C]0.035609[/C][C]0.2493[/C][C]0.402099[/C][/ROW]
[ROW][C]36[/C][C]0.001516[/C][C]0.0106[/C][C]0.495788[/C][/ROW]
[ROW][C]37[/C][C]0.014738[/C][C]0.1032[/C][C]0.459125[/C][/ROW]
[ROW][C]38[/C][C]0.047289[/C][C]0.331[/C][C]0.37102[/C][/ROW]
[ROW][C]39[/C][C]0.037378[/C][C]0.2616[/C][C]0.397345[/C][/ROW]
[ROW][C]40[/C][C]-0.070387[/C][C]-0.4927[/C][C]0.312209[/C][/ROW]
[ROW][C]41[/C][C]-0.079261[/C][C]-0.5548[/C][C]0.290768[/C][/ROW]
[ROW][C]42[/C][C]-0.114961[/C][C]-0.8047[/C][C]0.212433[/C][/ROW]
[ROW][C]43[/C][C]0.01758[/C][C]0.1231[/C][C]0.45128[/C][/ROW]
[ROW][C]44[/C][C]-0.070973[/C][C]-0.4968[/C][C]0.310771[/C][/ROW]
[ROW][C]45[/C][C]0.01349[/C][C]0.0944[/C][C]0.462577[/C][/ROW]
[ROW][C]46[/C][C]0.038547[/C][C]0.2698[/C][C]0.394212[/C][/ROW]
[ROW][C]47[/C][C]0.016348[/C][C]0.1144[/C][C]0.45468[/C][/ROW]
[ROW][C]48[/C][C]0.026526[/C][C]0.1857[/C][C]0.426729[/C][/ROW]
[ROW][C]49[/C][C]NA[/C][C]NA[/C][C]NA[/C][/ROW]
[ROW][C]50[/C][C]NA[/C][C]NA[/C][C]NA[/C][/ROW]
[ROW][C]51[/C][C]NA[/C][C]NA[/C][C]NA[/C][/ROW]
[ROW][C]52[/C][C]NA[/C][C]NA[/C][C]NA[/C][/ROW]
[ROW][C]53[/C][C]NA[/C][C]NA[/C][C]NA[/C][/ROW]
[ROW][C]54[/C][C]NA[/C][C]NA[/C][C]NA[/C][/ROW]
[ROW][C]55[/C][C]NA[/C][C]NA[/C][C]NA[/C][/ROW]
[ROW][C]56[/C][C]NA[/C][C]NA[/C][C]NA[/C][/ROW]
[ROW][C]57[/C][C]NA[/C][C]NA[/C][C]NA[/C][/ROW]
[ROW][C]58[/C][C]NA[/C][C]NA[/C][C]NA[/C][/ROW]
[ROW][C]59[/C][C]NA[/C][C]NA[/C][C]NA[/C][/ROW]
[ROW][C]60[/C][C]NA[/C][C]NA[/C][C]NA[/C][/ROW]
[/TABLE]
Source: https://freestatistics.org/blog/index.php?pk=34320&T=2

Globally Unique Identifier (entire table): ba.freestatistics.org/blog/index.php?pk=34320&T=2

As an alternative you can also use a QR Code:  

The GUIDs for individual cells are displayed in the table below:

Partial Autocorrelation Function
Time lag kPACF(k)T-STATP-value
1-0.012684-0.08880.464806
20.1287490.90120.185934
30.4173472.92140.002628
40.0276090.19330.423775
5-0.051854-0.3630.35909
6-0.032477-0.22730.410554
7-0.352364-2.46650.008594
8-0.032693-0.22890.409969
90.049250.34480.365879
100.0540360.37830.353438
11-0.076876-0.53810.296461
12-0.269244-1.88470.032704
13-0.043534-0.30470.380928
140.1551441.0860.141395
150.1044590.73120.234065
16-0.162672-1.13870.130182
17-0.059889-0.41920.338443
180.1485021.03950.151835
19-0.012072-0.08450.466499
20-0.109781-0.76850.222948
210.0335450.23480.407665
22-0.287802-2.01460.024725
230.0663470.46440.3222
240.0248350.17380.431352
25-0.021262-0.14880.441149
26-0.04134-0.28940.386756
27-0.176304-1.23410.111521
28-0.048211-0.33750.3686
29-0.006786-0.04750.481154
300.142961.00070.160939
310.1197170.8380.203044
32-0.077692-0.54380.294507
33-0.13847-0.96930.168581
34-0.034335-0.24030.405531
350.0356090.24930.402099
360.0015160.01060.495788
370.0147380.10320.459125
380.0472890.3310.37102
390.0373780.26160.397345
40-0.070387-0.49270.312209
41-0.079261-0.55480.290768
42-0.114961-0.80470.212433
430.017580.12310.45128
44-0.070973-0.49680.310771
450.013490.09440.462577
460.0385470.26980.394212
470.0163480.11440.45468
480.0265260.18570.426729
49NANANA
50NANANA
51NANANA
52NANANA
53NANANA
54NANANA
55NANANA
56NANANA
57NANANA
58NANANA
59NANANA
60NANANA


Parameters (Session):
par1 = 60 ; par2 = 1 ; par3 = 0 ; par4 = 1 ; par5 = 12 ;
Parameters (R input):
par1 = 60 ; par2 = 1 ; par3 = 0 ; par4 = 1 ; par5 = 12 ;
R code (references can be found in the software module):
if (par1 == 'Default') {
par1 = 10*log10(length(x))
} else {
par1 <- as.numeric(par1)
}
par2 <- as.numeric(par2)
par3 <- as.numeric(par3)
par4 <- as.numeric(par4)
par5 <- as.numeric(par5)
if (par2 == 0) {
x <- log(x)
} else {
x <- (x ^ par2 - 1) / par2
}
if (par3 > 0) x <- diff(x,lag=1,difference=par3)
if (par4 > 0) x <- diff(x,lag=par5,difference=par4)
bitmap(file='pic1.png')
racf <- acf(x,par1,main='Autocorrelation',xlab='lags',ylab='ACF')
dev.off()
bitmap(file='pic2.png')
rpacf <- pacf(x,par1,main='Partial Autocorrelation',xlab='lags',ylab='PACF')
dev.off()
(myacf <- c(racf$acf))
(mypacf <- c(rpacf$acf))
lengthx <- length(x)
sqrtn <- sqrt(lengthx)
load(file='createtable')
a<-table.start()
a<-table.row.start(a)
a<-table.element(a,'Autocorrelation Function',4,TRUE)
a<-table.row.end(a)
a<-table.row.start(a)
a<-table.element(a,'Time lag k',header=TRUE)
a<-table.element(a,hyperlink('basics.htm','ACF(k)','click here for more information about the Autocorrelation Function'),header=TRUE)
a<-table.element(a,'T-STAT',header=TRUE)
a<-table.element(a,'P-value',header=TRUE)
a<-table.row.end(a)
for (i in 2:(par1+1)) {
a<-table.row.start(a)
a<-table.element(a,i-1,header=TRUE)
a<-table.element(a,round(myacf[i],6))
mytstat <- myacf[i]*sqrtn
a<-table.element(a,round(mytstat,4))
a<-table.element(a,round(1-pt(abs(mytstat),lengthx),6))
a<-table.row.end(a)
}
a<-table.end(a)
table.save(a,file='mytable.tab')
a<-table.start()
a<-table.row.start(a)
a<-table.element(a,'Partial Autocorrelation Function',4,TRUE)
a<-table.row.end(a)
a<-table.row.start(a)
a<-table.element(a,'Time lag k',header=TRUE)
a<-table.element(a,hyperlink('basics.htm','PACF(k)','click here for more information about the Partial Autocorrelation Function'),header=TRUE)
a<-table.element(a,'T-STAT',header=TRUE)
a<-table.element(a,'P-value',header=TRUE)
a<-table.row.end(a)
for (i in 1:par1) {
a<-table.row.start(a)
a<-table.element(a,i,header=TRUE)
a<-table.element(a,round(mypacf[i],6))
mytstat <- mypacf[i]*sqrtn
a<-table.element(a,round(mytstat,4))
a<-table.element(a,round(1-pt(abs(mytstat),lengthx),6))
a<-table.row.end(a)
}
a<-table.end(a)
table.save(a,file='mytable1.tab')