Free Statistics

of Irreproducible Research!

Author's title

Author*The author of this computation has been verified*
R Software Modulerwasp_autocorrelation.wasp
Title produced by software(Partial) Autocorrelation Function
Date of computationWed, 17 Dec 2008 05:46:58 -0700
Cite this page as followsStatistical Computations at FreeStatistics.org, Office for Research Development and Education, URL https://freestatistics.org/blog/index.php?v=date/2008/Dec/17/t1229518086oej87l8u4x5rk1l.htm/, Retrieved Mon, 27 May 2024 02:17:54 +0000
Statistical Computations at FreeStatistics.org, Office for Research Development and Education, URL https://freestatistics.org/blog/index.php?pk=34319, Retrieved Mon, 27 May 2024 02:17:54 +0000
QR Codes:

Original text written by user:
IsPrivate?No (this computation is public)
User-defined keywords
Estimated Impact160
Family? (F = Feedback message, R = changed R code, M = changed R Module, P = changed Parameters, D = changed Data)
-       [(Partial) Autocorrelation Function] [] [2008-12-17 12:46:58] [c66d07e79164cd7acb2569833ec5bcd8] [Current]
Feedback Forum

Post a new message
Dataseries X:
15023.6
12083
15761.3
16943
15070.3
13659.6
14768.9
14725.1
15998.1
15370.6
14956.9
15469.7
15101.8
11703.7
16283.6
16726.5
14968.9
14861
14583.3
15305.8
17903.9
16379.4
15420.3
17870.5
15912.8
13866.5
17823.2
17872
17420.4
16704.4
15991.2
16583.6
19123.5
17838.7
17209.4
18586.5
16258.1
15141.6
19202.1
17746.5
19090.1
18040.3
17515.5
17751.8
21072.4
17170
19439.5
19795.4
17574.9
16165.4
19464.6
19932.1
19961.2
17343.4
18924.2
18574.1
21350.6
18840.1
20304.8
21132.4
19753.9


Summary of computational transaction
Raw Inputview raw input (R code)
Raw Outputview raw output of R engine
Computing time1 seconds
R Server'Gwilym Jenkins' @ 72.249.127.135

\begin{tabular}{lllllllll}
\hline
Summary of computational transaction \tabularnewline
Raw Input & view raw input (R code)  \tabularnewline
Raw Output & view raw output of R engine  \tabularnewline
Computing time & 1 seconds \tabularnewline
R Server & 'Gwilym Jenkins' @ 72.249.127.135 \tabularnewline
\hline
\end{tabular}
%Source: https://freestatistics.org/blog/index.php?pk=34319&T=0

[TABLE]
[ROW][C]Summary of computational transaction[/C][/ROW]
[ROW][C]Raw Input[/C][C]view raw input (R code) [/C][/ROW]
[ROW][C]Raw Output[/C][C]view raw output of R engine [/C][/ROW]
[ROW][C]Computing time[/C][C]1 seconds[/C][/ROW]
[ROW][C]R Server[/C][C]'Gwilym Jenkins' @ 72.249.127.135[/C][/ROW]
[/TABLE]
Source: https://freestatistics.org/blog/index.php?pk=34319&T=0

Globally Unique Identifier (entire table): ba.freestatistics.org/blog/index.php?pk=34319&T=0

As an alternative you can also use a QR Code:  

The GUIDs for individual cells are displayed in the table below:

Summary of computational transaction
Raw Inputview raw input (R code)
Raw Outputview raw output of R engine
Computing time1 seconds
R Server'Gwilym Jenkins' @ 72.249.127.135


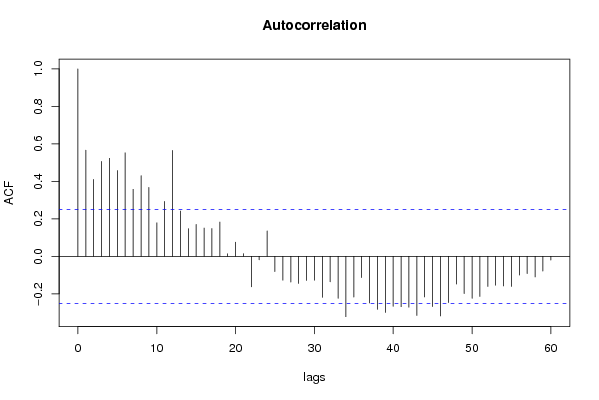
Autocorrelation Function
Time lag kACF(k)T-STATP-value
10.5664464.42412e-05
20.4104653.20580.001072
30.5063423.95470.000101
40.52324.08636.5e-05
50.4575113.57330.000348
60.552644.31633e-05
70.3572482.79020.00351
80.4300893.35910.000676
90.3678992.87340.00279
100.1791121.39890.083452
110.2928412.28720.012835
120.5649354.41232.1e-05
130.2417841.88840.031866
140.147541.15230.126842
150.1703311.33030.094182
160.1505851.17610.122061
170.147961.15560.126174
180.1826761.42670.079376
190.0131070.10240.459398
200.0750760.58640.279898
210.0140670.10990.456437
22-0.162571-1.26970.104503
23-0.018918-0.14780.441513
240.1351891.05590.147598
25-0.081769-0.63860.262725
26-0.127487-0.99570.161663
27-0.137694-1.07540.14321
28-0.144994-1.13240.13094
29-0.128897-1.00670.159023
30-0.127171-0.99320.162259
31-0.218722-1.70830.046335
32-0.135962-1.06190.146234
33-0.224122-1.75040.042535
34-0.3221-2.51570.007265
35-0.217428-1.69820.047286
36-0.113579-0.88710.189259
37-0.249025-1.94490.028197
38-0.283003-2.21030.015422
39-0.299624-2.34010.011282
40-0.266959-2.0850.02063
41-0.269014-2.10110.019887
42-0.271806-2.12290.018916
43-0.315777-2.46630.008239
44-0.216632-1.69190.047879
45-0.268195-2.09470.020181
46-0.318023-2.48380.00788
47-0.24717-1.93050.029101
48-0.147931-1.15540.12622
49-0.199015-1.55440.062636
50-0.224269-1.75160.042435
51-0.214045-1.67170.049849
52-0.160739-1.25540.107058
53-0.154371-1.20570.1163
54-0.158104-1.23480.110814
55-0.160995-1.25740.106699
56-0.10002-0.78120.218858
57-0.091948-0.71810.237707
58-0.110225-0.86090.196337
59-0.078857-0.61590.270129
60-0.019881-0.15530.438559

\begin{tabular}{lllllllll}
\hline
Autocorrelation Function \tabularnewline
Time lag k & ACF(k) & T-STAT & P-value \tabularnewline
1 & 0.566446 & 4.4241 & 2e-05 \tabularnewline
2 & 0.410465 & 3.2058 & 0.001072 \tabularnewline
3 & 0.506342 & 3.9547 & 0.000101 \tabularnewline
4 & 0.5232 & 4.0863 & 6.5e-05 \tabularnewline
5 & 0.457511 & 3.5733 & 0.000348 \tabularnewline
6 & 0.55264 & 4.3163 & 3e-05 \tabularnewline
7 & 0.357248 & 2.7902 & 0.00351 \tabularnewline
8 & 0.430089 & 3.3591 & 0.000676 \tabularnewline
9 & 0.367899 & 2.8734 & 0.00279 \tabularnewline
10 & 0.179112 & 1.3989 & 0.083452 \tabularnewline
11 & 0.292841 & 2.2872 & 0.012835 \tabularnewline
12 & 0.564935 & 4.4123 & 2.1e-05 \tabularnewline
13 & 0.241784 & 1.8884 & 0.031866 \tabularnewline
14 & 0.14754 & 1.1523 & 0.126842 \tabularnewline
15 & 0.170331 & 1.3303 & 0.094182 \tabularnewline
16 & 0.150585 & 1.1761 & 0.122061 \tabularnewline
17 & 0.14796 & 1.1556 & 0.126174 \tabularnewline
18 & 0.182676 & 1.4267 & 0.079376 \tabularnewline
19 & 0.013107 & 0.1024 & 0.459398 \tabularnewline
20 & 0.075076 & 0.5864 & 0.279898 \tabularnewline
21 & 0.014067 & 0.1099 & 0.456437 \tabularnewline
22 & -0.162571 & -1.2697 & 0.104503 \tabularnewline
23 & -0.018918 & -0.1478 & 0.441513 \tabularnewline
24 & 0.135189 & 1.0559 & 0.147598 \tabularnewline
25 & -0.081769 & -0.6386 & 0.262725 \tabularnewline
26 & -0.127487 & -0.9957 & 0.161663 \tabularnewline
27 & -0.137694 & -1.0754 & 0.14321 \tabularnewline
28 & -0.144994 & -1.1324 & 0.13094 \tabularnewline
29 & -0.128897 & -1.0067 & 0.159023 \tabularnewline
30 & -0.127171 & -0.9932 & 0.162259 \tabularnewline
31 & -0.218722 & -1.7083 & 0.046335 \tabularnewline
32 & -0.135962 & -1.0619 & 0.146234 \tabularnewline
33 & -0.224122 & -1.7504 & 0.042535 \tabularnewline
34 & -0.3221 & -2.5157 & 0.007265 \tabularnewline
35 & -0.217428 & -1.6982 & 0.047286 \tabularnewline
36 & -0.113579 & -0.8871 & 0.189259 \tabularnewline
37 & -0.249025 & -1.9449 & 0.028197 \tabularnewline
38 & -0.283003 & -2.2103 & 0.015422 \tabularnewline
39 & -0.299624 & -2.3401 & 0.011282 \tabularnewline
40 & -0.266959 & -2.085 & 0.02063 \tabularnewline
41 & -0.269014 & -2.1011 & 0.019887 \tabularnewline
42 & -0.271806 & -2.1229 & 0.018916 \tabularnewline
43 & -0.315777 & -2.4663 & 0.008239 \tabularnewline
44 & -0.216632 & -1.6919 & 0.047879 \tabularnewline
45 & -0.268195 & -2.0947 & 0.020181 \tabularnewline
46 & -0.318023 & -2.4838 & 0.00788 \tabularnewline
47 & -0.24717 & -1.9305 & 0.029101 \tabularnewline
48 & -0.147931 & -1.1554 & 0.12622 \tabularnewline
49 & -0.199015 & -1.5544 & 0.062636 \tabularnewline
50 & -0.224269 & -1.7516 & 0.042435 \tabularnewline
51 & -0.214045 & -1.6717 & 0.049849 \tabularnewline
52 & -0.160739 & -1.2554 & 0.107058 \tabularnewline
53 & -0.154371 & -1.2057 & 0.1163 \tabularnewline
54 & -0.158104 & -1.2348 & 0.110814 \tabularnewline
55 & -0.160995 & -1.2574 & 0.106699 \tabularnewline
56 & -0.10002 & -0.7812 & 0.218858 \tabularnewline
57 & -0.091948 & -0.7181 & 0.237707 \tabularnewline
58 & -0.110225 & -0.8609 & 0.196337 \tabularnewline
59 & -0.078857 & -0.6159 & 0.270129 \tabularnewline
60 & -0.019881 & -0.1553 & 0.438559 \tabularnewline
\hline
\end{tabular}
%Source: https://freestatistics.org/blog/index.php?pk=34319&T=1

[TABLE]
[ROW][C]Autocorrelation Function[/C][/ROW]
[ROW][C]Time lag k[/C][C]ACF(k)[/C][C]T-STAT[/C][C]P-value[/C][/ROW]
[ROW][C]1[/C][C]0.566446[/C][C]4.4241[/C][C]2e-05[/C][/ROW]
[ROW][C]2[/C][C]0.410465[/C][C]3.2058[/C][C]0.001072[/C][/ROW]
[ROW][C]3[/C][C]0.506342[/C][C]3.9547[/C][C]0.000101[/C][/ROW]
[ROW][C]4[/C][C]0.5232[/C][C]4.0863[/C][C]6.5e-05[/C][/ROW]
[ROW][C]5[/C][C]0.457511[/C][C]3.5733[/C][C]0.000348[/C][/ROW]
[ROW][C]6[/C][C]0.55264[/C][C]4.3163[/C][C]3e-05[/C][/ROW]
[ROW][C]7[/C][C]0.357248[/C][C]2.7902[/C][C]0.00351[/C][/ROW]
[ROW][C]8[/C][C]0.430089[/C][C]3.3591[/C][C]0.000676[/C][/ROW]
[ROW][C]9[/C][C]0.367899[/C][C]2.8734[/C][C]0.00279[/C][/ROW]
[ROW][C]10[/C][C]0.179112[/C][C]1.3989[/C][C]0.083452[/C][/ROW]
[ROW][C]11[/C][C]0.292841[/C][C]2.2872[/C][C]0.012835[/C][/ROW]
[ROW][C]12[/C][C]0.564935[/C][C]4.4123[/C][C]2.1e-05[/C][/ROW]
[ROW][C]13[/C][C]0.241784[/C][C]1.8884[/C][C]0.031866[/C][/ROW]
[ROW][C]14[/C][C]0.14754[/C][C]1.1523[/C][C]0.126842[/C][/ROW]
[ROW][C]15[/C][C]0.170331[/C][C]1.3303[/C][C]0.094182[/C][/ROW]
[ROW][C]16[/C][C]0.150585[/C][C]1.1761[/C][C]0.122061[/C][/ROW]
[ROW][C]17[/C][C]0.14796[/C][C]1.1556[/C][C]0.126174[/C][/ROW]
[ROW][C]18[/C][C]0.182676[/C][C]1.4267[/C][C]0.079376[/C][/ROW]
[ROW][C]19[/C][C]0.013107[/C][C]0.1024[/C][C]0.459398[/C][/ROW]
[ROW][C]20[/C][C]0.075076[/C][C]0.5864[/C][C]0.279898[/C][/ROW]
[ROW][C]21[/C][C]0.014067[/C][C]0.1099[/C][C]0.456437[/C][/ROW]
[ROW][C]22[/C][C]-0.162571[/C][C]-1.2697[/C][C]0.104503[/C][/ROW]
[ROW][C]23[/C][C]-0.018918[/C][C]-0.1478[/C][C]0.441513[/C][/ROW]
[ROW][C]24[/C][C]0.135189[/C][C]1.0559[/C][C]0.147598[/C][/ROW]
[ROW][C]25[/C][C]-0.081769[/C][C]-0.6386[/C][C]0.262725[/C][/ROW]
[ROW][C]26[/C][C]-0.127487[/C][C]-0.9957[/C][C]0.161663[/C][/ROW]
[ROW][C]27[/C][C]-0.137694[/C][C]-1.0754[/C][C]0.14321[/C][/ROW]
[ROW][C]28[/C][C]-0.144994[/C][C]-1.1324[/C][C]0.13094[/C][/ROW]
[ROW][C]29[/C][C]-0.128897[/C][C]-1.0067[/C][C]0.159023[/C][/ROW]
[ROW][C]30[/C][C]-0.127171[/C][C]-0.9932[/C][C]0.162259[/C][/ROW]
[ROW][C]31[/C][C]-0.218722[/C][C]-1.7083[/C][C]0.046335[/C][/ROW]
[ROW][C]32[/C][C]-0.135962[/C][C]-1.0619[/C][C]0.146234[/C][/ROW]
[ROW][C]33[/C][C]-0.224122[/C][C]-1.7504[/C][C]0.042535[/C][/ROW]
[ROW][C]34[/C][C]-0.3221[/C][C]-2.5157[/C][C]0.007265[/C][/ROW]
[ROW][C]35[/C][C]-0.217428[/C][C]-1.6982[/C][C]0.047286[/C][/ROW]
[ROW][C]36[/C][C]-0.113579[/C][C]-0.8871[/C][C]0.189259[/C][/ROW]
[ROW][C]37[/C][C]-0.249025[/C][C]-1.9449[/C][C]0.028197[/C][/ROW]
[ROW][C]38[/C][C]-0.283003[/C][C]-2.2103[/C][C]0.015422[/C][/ROW]
[ROW][C]39[/C][C]-0.299624[/C][C]-2.3401[/C][C]0.011282[/C][/ROW]
[ROW][C]40[/C][C]-0.266959[/C][C]-2.085[/C][C]0.02063[/C][/ROW]
[ROW][C]41[/C][C]-0.269014[/C][C]-2.1011[/C][C]0.019887[/C][/ROW]
[ROW][C]42[/C][C]-0.271806[/C][C]-2.1229[/C][C]0.018916[/C][/ROW]
[ROW][C]43[/C][C]-0.315777[/C][C]-2.4663[/C][C]0.008239[/C][/ROW]
[ROW][C]44[/C][C]-0.216632[/C][C]-1.6919[/C][C]0.047879[/C][/ROW]
[ROW][C]45[/C][C]-0.268195[/C][C]-2.0947[/C][C]0.020181[/C][/ROW]
[ROW][C]46[/C][C]-0.318023[/C][C]-2.4838[/C][C]0.00788[/C][/ROW]
[ROW][C]47[/C][C]-0.24717[/C][C]-1.9305[/C][C]0.029101[/C][/ROW]
[ROW][C]48[/C][C]-0.147931[/C][C]-1.1554[/C][C]0.12622[/C][/ROW]
[ROW][C]49[/C][C]-0.199015[/C][C]-1.5544[/C][C]0.062636[/C][/ROW]
[ROW][C]50[/C][C]-0.224269[/C][C]-1.7516[/C][C]0.042435[/C][/ROW]
[ROW][C]51[/C][C]-0.214045[/C][C]-1.6717[/C][C]0.049849[/C][/ROW]
[ROW][C]52[/C][C]-0.160739[/C][C]-1.2554[/C][C]0.107058[/C][/ROW]
[ROW][C]53[/C][C]-0.154371[/C][C]-1.2057[/C][C]0.1163[/C][/ROW]
[ROW][C]54[/C][C]-0.158104[/C][C]-1.2348[/C][C]0.110814[/C][/ROW]
[ROW][C]55[/C][C]-0.160995[/C][C]-1.2574[/C][C]0.106699[/C][/ROW]
[ROW][C]56[/C][C]-0.10002[/C][C]-0.7812[/C][C]0.218858[/C][/ROW]
[ROW][C]57[/C][C]-0.091948[/C][C]-0.7181[/C][C]0.237707[/C][/ROW]
[ROW][C]58[/C][C]-0.110225[/C][C]-0.8609[/C][C]0.196337[/C][/ROW]
[ROW][C]59[/C][C]-0.078857[/C][C]-0.6159[/C][C]0.270129[/C][/ROW]
[ROW][C]60[/C][C]-0.019881[/C][C]-0.1553[/C][C]0.438559[/C][/ROW]
[/TABLE]
Source: https://freestatistics.org/blog/index.php?pk=34319&T=1

Globally Unique Identifier (entire table): ba.freestatistics.org/blog/index.php?pk=34319&T=1

As an alternative you can also use a QR Code:  

The GUIDs for individual cells are displayed in the table below:

Autocorrelation Function
Time lag kACF(k)T-STATP-value
10.5664464.42412e-05
20.4104653.20580.001072
30.5063423.95470.000101
40.52324.08636.5e-05
50.4575113.57330.000348
60.552644.31633e-05
70.3572482.79020.00351
80.4300893.35910.000676
90.3678992.87340.00279
100.1791121.39890.083452
110.2928412.28720.012835
120.5649354.41232.1e-05
130.2417841.88840.031866
140.147541.15230.126842
150.1703311.33030.094182
160.1505851.17610.122061
170.147961.15560.126174
180.1826761.42670.079376
190.0131070.10240.459398
200.0750760.58640.279898
210.0140670.10990.456437
22-0.162571-1.26970.104503
23-0.018918-0.14780.441513
240.1351891.05590.147598
25-0.081769-0.63860.262725
26-0.127487-0.99570.161663
27-0.137694-1.07540.14321
28-0.144994-1.13240.13094
29-0.128897-1.00670.159023
30-0.127171-0.99320.162259
31-0.218722-1.70830.046335
32-0.135962-1.06190.146234
33-0.224122-1.75040.042535
34-0.3221-2.51570.007265
35-0.217428-1.69820.047286
36-0.113579-0.88710.189259
37-0.249025-1.94490.028197
38-0.283003-2.21030.015422
39-0.299624-2.34010.011282
40-0.266959-2.0850.02063
41-0.269014-2.10110.019887
42-0.271806-2.12290.018916
43-0.315777-2.46630.008239
44-0.216632-1.69190.047879
45-0.268195-2.09470.020181
46-0.318023-2.48380.00788
47-0.24717-1.93050.029101
48-0.147931-1.15540.12622
49-0.199015-1.55440.062636
50-0.224269-1.75160.042435
51-0.214045-1.67170.049849
52-0.160739-1.25540.107058
53-0.154371-1.20570.1163
54-0.158104-1.23480.110814
55-0.160995-1.25740.106699
56-0.10002-0.78120.218858
57-0.091948-0.71810.237707
58-0.110225-0.86090.196337
59-0.078857-0.61590.270129
60-0.019881-0.15530.438559


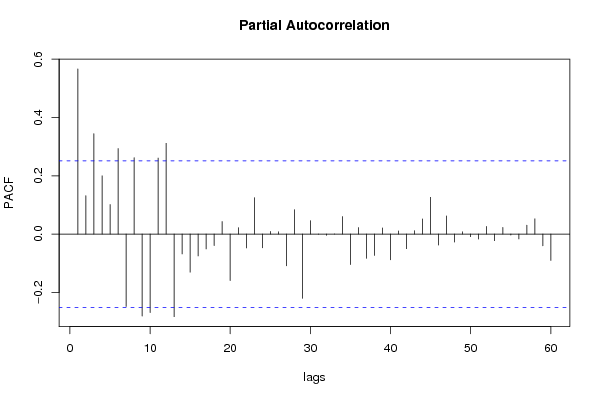
Partial Autocorrelation Function
Time lag kPACF(k)T-STATP-value
10.5664464.42412e-05
20.1319381.03050.153429
30.3443292.68930.004611
40.1998061.56050.061903
50.1013640.79170.215809
60.2932912.29070.012726
7-0.248276-1.93910.02856
80.2621242.04730.022474
9-0.281235-2.19650.015933
10-0.269301-2.10330.019785
110.260872.03750.022974
120.3114692.43270.008968
13-0.283189-2.21180.015369
14-0.068154-0.53230.298227
15-0.130898-1.02230.155327
16-0.07501-0.58580.280071
17-0.051057-0.39880.345728
18-0.039388-0.30760.379704
190.0431020.33660.368774
20-0.159325-1.24440.109062
210.0221050.17260.43175
22-0.047467-0.37070.356062
230.1247550.97440.166862
24-0.047218-0.36880.356783
250.0091010.07110.471783
260.0076490.05970.47628
27-0.108747-0.84930.199506
280.083750.65410.257749
29-0.220244-1.72020.045236
300.0458370.3580.360789
31-0.000309-0.00240.499041
32-0.004352-0.0340.486499
330.0003530.00280.498905
340.0599560.46830.32063
35-0.104713-0.81780.208317
360.0224330.17520.430748
37-0.082908-0.64750.259858
38-0.073134-0.57120.284984
390.0211170.16490.434772
40-0.088069-0.68780.24708
410.0109030.08520.466208
42-0.050239-0.39240.348074
430.0117730.0920.463519
440.0519960.40610.343043
450.1262650.98620.163975
46-0.037702-0.29450.384701
470.0620710.48480.31478
48-0.027252-0.21280.416079
490.0078270.06110.475728
50-0.008874-0.06930.472486
51-0.017264-0.13480.446594
520.0260980.20380.419583
53-0.022603-0.17650.430228
540.0226940.17720.429951
55-0.00345-0.02690.489295
56-0.016506-0.12890.448924
570.0304160.23760.406512
580.0523940.40920.341909
59-0.040247-0.31430.377169
60-0.090347-0.70560.24155

\begin{tabular}{lllllllll}
\hline
Partial Autocorrelation Function \tabularnewline
Time lag k & PACF(k) & T-STAT & P-value \tabularnewline
1 & 0.566446 & 4.4241 & 2e-05 \tabularnewline
2 & 0.131938 & 1.0305 & 0.153429 \tabularnewline
3 & 0.344329 & 2.6893 & 0.004611 \tabularnewline
4 & 0.199806 & 1.5605 & 0.061903 \tabularnewline
5 & 0.101364 & 0.7917 & 0.215809 \tabularnewline
6 & 0.293291 & 2.2907 & 0.012726 \tabularnewline
7 & -0.248276 & -1.9391 & 0.02856 \tabularnewline
8 & 0.262124 & 2.0473 & 0.022474 \tabularnewline
9 & -0.281235 & -2.1965 & 0.015933 \tabularnewline
10 & -0.269301 & -2.1033 & 0.019785 \tabularnewline
11 & 0.26087 & 2.0375 & 0.022974 \tabularnewline
12 & 0.311469 & 2.4327 & 0.008968 \tabularnewline
13 & -0.283189 & -2.2118 & 0.015369 \tabularnewline
14 & -0.068154 & -0.5323 & 0.298227 \tabularnewline
15 & -0.130898 & -1.0223 & 0.155327 \tabularnewline
16 & -0.07501 & -0.5858 & 0.280071 \tabularnewline
17 & -0.051057 & -0.3988 & 0.345728 \tabularnewline
18 & -0.039388 & -0.3076 & 0.379704 \tabularnewline
19 & 0.043102 & 0.3366 & 0.368774 \tabularnewline
20 & -0.159325 & -1.2444 & 0.109062 \tabularnewline
21 & 0.022105 & 0.1726 & 0.43175 \tabularnewline
22 & -0.047467 & -0.3707 & 0.356062 \tabularnewline
23 & 0.124755 & 0.9744 & 0.166862 \tabularnewline
24 & -0.047218 & -0.3688 & 0.356783 \tabularnewline
25 & 0.009101 & 0.0711 & 0.471783 \tabularnewline
26 & 0.007649 & 0.0597 & 0.47628 \tabularnewline
27 & -0.108747 & -0.8493 & 0.199506 \tabularnewline
28 & 0.08375 & 0.6541 & 0.257749 \tabularnewline
29 & -0.220244 & -1.7202 & 0.045236 \tabularnewline
30 & 0.045837 & 0.358 & 0.360789 \tabularnewline
31 & -0.000309 & -0.0024 & 0.499041 \tabularnewline
32 & -0.004352 & -0.034 & 0.486499 \tabularnewline
33 & 0.000353 & 0.0028 & 0.498905 \tabularnewline
34 & 0.059956 & 0.4683 & 0.32063 \tabularnewline
35 & -0.104713 & -0.8178 & 0.208317 \tabularnewline
36 & 0.022433 & 0.1752 & 0.430748 \tabularnewline
37 & -0.082908 & -0.6475 & 0.259858 \tabularnewline
38 & -0.073134 & -0.5712 & 0.284984 \tabularnewline
39 & 0.021117 & 0.1649 & 0.434772 \tabularnewline
40 & -0.088069 & -0.6878 & 0.24708 \tabularnewline
41 & 0.010903 & 0.0852 & 0.466208 \tabularnewline
42 & -0.050239 & -0.3924 & 0.348074 \tabularnewline
43 & 0.011773 & 0.092 & 0.463519 \tabularnewline
44 & 0.051996 & 0.4061 & 0.343043 \tabularnewline
45 & 0.126265 & 0.9862 & 0.163975 \tabularnewline
46 & -0.037702 & -0.2945 & 0.384701 \tabularnewline
47 & 0.062071 & 0.4848 & 0.31478 \tabularnewline
48 & -0.027252 & -0.2128 & 0.416079 \tabularnewline
49 & 0.007827 & 0.0611 & 0.475728 \tabularnewline
50 & -0.008874 & -0.0693 & 0.472486 \tabularnewline
51 & -0.017264 & -0.1348 & 0.446594 \tabularnewline
52 & 0.026098 & 0.2038 & 0.419583 \tabularnewline
53 & -0.022603 & -0.1765 & 0.430228 \tabularnewline
54 & 0.022694 & 0.1772 & 0.429951 \tabularnewline
55 & -0.00345 & -0.0269 & 0.489295 \tabularnewline
56 & -0.016506 & -0.1289 & 0.448924 \tabularnewline
57 & 0.030416 & 0.2376 & 0.406512 \tabularnewline
58 & 0.052394 & 0.4092 & 0.341909 \tabularnewline
59 & -0.040247 & -0.3143 & 0.377169 \tabularnewline
60 & -0.090347 & -0.7056 & 0.24155 \tabularnewline
\hline
\end{tabular}
%Source: https://freestatistics.org/blog/index.php?pk=34319&T=2

[TABLE]
[ROW][C]Partial Autocorrelation Function[/C][/ROW]
[ROW][C]Time lag k[/C][C]PACF(k)[/C][C]T-STAT[/C][C]P-value[/C][/ROW]
[ROW][C]1[/C][C]0.566446[/C][C]4.4241[/C][C]2e-05[/C][/ROW]
[ROW][C]2[/C][C]0.131938[/C][C]1.0305[/C][C]0.153429[/C][/ROW]
[ROW][C]3[/C][C]0.344329[/C][C]2.6893[/C][C]0.004611[/C][/ROW]
[ROW][C]4[/C][C]0.199806[/C][C]1.5605[/C][C]0.061903[/C][/ROW]
[ROW][C]5[/C][C]0.101364[/C][C]0.7917[/C][C]0.215809[/C][/ROW]
[ROW][C]6[/C][C]0.293291[/C][C]2.2907[/C][C]0.012726[/C][/ROW]
[ROW][C]7[/C][C]-0.248276[/C][C]-1.9391[/C][C]0.02856[/C][/ROW]
[ROW][C]8[/C][C]0.262124[/C][C]2.0473[/C][C]0.022474[/C][/ROW]
[ROW][C]9[/C][C]-0.281235[/C][C]-2.1965[/C][C]0.015933[/C][/ROW]
[ROW][C]10[/C][C]-0.269301[/C][C]-2.1033[/C][C]0.019785[/C][/ROW]
[ROW][C]11[/C][C]0.26087[/C][C]2.0375[/C][C]0.022974[/C][/ROW]
[ROW][C]12[/C][C]0.311469[/C][C]2.4327[/C][C]0.008968[/C][/ROW]
[ROW][C]13[/C][C]-0.283189[/C][C]-2.2118[/C][C]0.015369[/C][/ROW]
[ROW][C]14[/C][C]-0.068154[/C][C]-0.5323[/C][C]0.298227[/C][/ROW]
[ROW][C]15[/C][C]-0.130898[/C][C]-1.0223[/C][C]0.155327[/C][/ROW]
[ROW][C]16[/C][C]-0.07501[/C][C]-0.5858[/C][C]0.280071[/C][/ROW]
[ROW][C]17[/C][C]-0.051057[/C][C]-0.3988[/C][C]0.345728[/C][/ROW]
[ROW][C]18[/C][C]-0.039388[/C][C]-0.3076[/C][C]0.379704[/C][/ROW]
[ROW][C]19[/C][C]0.043102[/C][C]0.3366[/C][C]0.368774[/C][/ROW]
[ROW][C]20[/C][C]-0.159325[/C][C]-1.2444[/C][C]0.109062[/C][/ROW]
[ROW][C]21[/C][C]0.022105[/C][C]0.1726[/C][C]0.43175[/C][/ROW]
[ROW][C]22[/C][C]-0.047467[/C][C]-0.3707[/C][C]0.356062[/C][/ROW]
[ROW][C]23[/C][C]0.124755[/C][C]0.9744[/C][C]0.166862[/C][/ROW]
[ROW][C]24[/C][C]-0.047218[/C][C]-0.3688[/C][C]0.356783[/C][/ROW]
[ROW][C]25[/C][C]0.009101[/C][C]0.0711[/C][C]0.471783[/C][/ROW]
[ROW][C]26[/C][C]0.007649[/C][C]0.0597[/C][C]0.47628[/C][/ROW]
[ROW][C]27[/C][C]-0.108747[/C][C]-0.8493[/C][C]0.199506[/C][/ROW]
[ROW][C]28[/C][C]0.08375[/C][C]0.6541[/C][C]0.257749[/C][/ROW]
[ROW][C]29[/C][C]-0.220244[/C][C]-1.7202[/C][C]0.045236[/C][/ROW]
[ROW][C]30[/C][C]0.045837[/C][C]0.358[/C][C]0.360789[/C][/ROW]
[ROW][C]31[/C][C]-0.000309[/C][C]-0.0024[/C][C]0.499041[/C][/ROW]
[ROW][C]32[/C][C]-0.004352[/C][C]-0.034[/C][C]0.486499[/C][/ROW]
[ROW][C]33[/C][C]0.000353[/C][C]0.0028[/C][C]0.498905[/C][/ROW]
[ROW][C]34[/C][C]0.059956[/C][C]0.4683[/C][C]0.32063[/C][/ROW]
[ROW][C]35[/C][C]-0.104713[/C][C]-0.8178[/C][C]0.208317[/C][/ROW]
[ROW][C]36[/C][C]0.022433[/C][C]0.1752[/C][C]0.430748[/C][/ROW]
[ROW][C]37[/C][C]-0.082908[/C][C]-0.6475[/C][C]0.259858[/C][/ROW]
[ROW][C]38[/C][C]-0.073134[/C][C]-0.5712[/C][C]0.284984[/C][/ROW]
[ROW][C]39[/C][C]0.021117[/C][C]0.1649[/C][C]0.434772[/C][/ROW]
[ROW][C]40[/C][C]-0.088069[/C][C]-0.6878[/C][C]0.24708[/C][/ROW]
[ROW][C]41[/C][C]0.010903[/C][C]0.0852[/C][C]0.466208[/C][/ROW]
[ROW][C]42[/C][C]-0.050239[/C][C]-0.3924[/C][C]0.348074[/C][/ROW]
[ROW][C]43[/C][C]0.011773[/C][C]0.092[/C][C]0.463519[/C][/ROW]
[ROW][C]44[/C][C]0.051996[/C][C]0.4061[/C][C]0.343043[/C][/ROW]
[ROW][C]45[/C][C]0.126265[/C][C]0.9862[/C][C]0.163975[/C][/ROW]
[ROW][C]46[/C][C]-0.037702[/C][C]-0.2945[/C][C]0.384701[/C][/ROW]
[ROW][C]47[/C][C]0.062071[/C][C]0.4848[/C][C]0.31478[/C][/ROW]
[ROW][C]48[/C][C]-0.027252[/C][C]-0.2128[/C][C]0.416079[/C][/ROW]
[ROW][C]49[/C][C]0.007827[/C][C]0.0611[/C][C]0.475728[/C][/ROW]
[ROW][C]50[/C][C]-0.008874[/C][C]-0.0693[/C][C]0.472486[/C][/ROW]
[ROW][C]51[/C][C]-0.017264[/C][C]-0.1348[/C][C]0.446594[/C][/ROW]
[ROW][C]52[/C][C]0.026098[/C][C]0.2038[/C][C]0.419583[/C][/ROW]
[ROW][C]53[/C][C]-0.022603[/C][C]-0.1765[/C][C]0.430228[/C][/ROW]
[ROW][C]54[/C][C]0.022694[/C][C]0.1772[/C][C]0.429951[/C][/ROW]
[ROW][C]55[/C][C]-0.00345[/C][C]-0.0269[/C][C]0.489295[/C][/ROW]
[ROW][C]56[/C][C]-0.016506[/C][C]-0.1289[/C][C]0.448924[/C][/ROW]
[ROW][C]57[/C][C]0.030416[/C][C]0.2376[/C][C]0.406512[/C][/ROW]
[ROW][C]58[/C][C]0.052394[/C][C]0.4092[/C][C]0.341909[/C][/ROW]
[ROW][C]59[/C][C]-0.040247[/C][C]-0.3143[/C][C]0.377169[/C][/ROW]
[ROW][C]60[/C][C]-0.090347[/C][C]-0.7056[/C][C]0.24155[/C][/ROW]
[/TABLE]
Source: https://freestatistics.org/blog/index.php?pk=34319&T=2

Globally Unique Identifier (entire table): ba.freestatistics.org/blog/index.php?pk=34319&T=2

As an alternative you can also use a QR Code:  

The GUIDs for individual cells are displayed in the table below:

Partial Autocorrelation Function
Time lag kPACF(k)T-STATP-value
10.5664464.42412e-05
20.1319381.03050.153429
30.3443292.68930.004611
40.1998061.56050.061903
50.1013640.79170.215809
60.2932912.29070.012726
7-0.248276-1.93910.02856
80.2621242.04730.022474
9-0.281235-2.19650.015933
10-0.269301-2.10330.019785
110.260872.03750.022974
120.3114692.43270.008968
13-0.283189-2.21180.015369
14-0.068154-0.53230.298227
15-0.130898-1.02230.155327
16-0.07501-0.58580.280071
17-0.051057-0.39880.345728
18-0.039388-0.30760.379704
190.0431020.33660.368774
20-0.159325-1.24440.109062
210.0221050.17260.43175
22-0.047467-0.37070.356062
230.1247550.97440.166862
24-0.047218-0.36880.356783
250.0091010.07110.471783
260.0076490.05970.47628
27-0.108747-0.84930.199506
280.083750.65410.257749
29-0.220244-1.72020.045236
300.0458370.3580.360789
31-0.000309-0.00240.499041
32-0.004352-0.0340.486499
330.0003530.00280.498905
340.0599560.46830.32063
35-0.104713-0.81780.208317
360.0224330.17520.430748
37-0.082908-0.64750.259858
38-0.073134-0.57120.284984
390.0211170.16490.434772
40-0.088069-0.68780.24708
410.0109030.08520.466208
42-0.050239-0.39240.348074
430.0117730.0920.463519
440.0519960.40610.343043
450.1262650.98620.163975
46-0.037702-0.29450.384701
470.0620710.48480.31478
48-0.027252-0.21280.416079
490.0078270.06110.475728
50-0.008874-0.06930.472486
51-0.017264-0.13480.446594
520.0260980.20380.419583
53-0.022603-0.17650.430228
540.0226940.17720.429951
55-0.00345-0.02690.489295
56-0.016506-0.12890.448924
570.0304160.23760.406512
580.0523940.40920.341909
59-0.040247-0.31430.377169
60-0.090347-0.70560.24155


Parameters (Session):
par1 = 60 ; par2 = 1 ; par3 = 0 ; par4 = 0 ; par5 = 12 ;
Parameters (R input):
par1 = 60 ; par2 = 1 ; par3 = 0 ; par4 = 0 ; par5 = 12 ;
R code (references can be found in the software module):
if (par1 == 'Default') {
par1 = 10*log10(length(x))
} else {
par1 <- as.numeric(par1)
}
par2 <- as.numeric(par2)
par3 <- as.numeric(par3)
par4 <- as.numeric(par4)
par5 <- as.numeric(par5)
if (par2 == 0) {
x <- log(x)
} else {
x <- (x ^ par2 - 1) / par2
}
if (par3 > 0) x <- diff(x,lag=1,difference=par3)
if (par4 > 0) x <- diff(x,lag=par5,difference=par4)
bitmap(file='pic1.png')
racf <- acf(x,par1,main='Autocorrelation',xlab='lags',ylab='ACF')
dev.off()
bitmap(file='pic2.png')
rpacf <- pacf(x,par1,main='Partial Autocorrelation',xlab='lags',ylab='PACF')
dev.off()
(myacf <- c(racf$acf))
(mypacf <- c(rpacf$acf))
lengthx <- length(x)
sqrtn <- sqrt(lengthx)
load(file='createtable')
a<-table.start()
a<-table.row.start(a)
a<-table.element(a,'Autocorrelation Function',4,TRUE)
a<-table.row.end(a)
a<-table.row.start(a)
a<-table.element(a,'Time lag k',header=TRUE)
a<-table.element(a,hyperlink('basics.htm','ACF(k)','click here for more information about the Autocorrelation Function'),header=TRUE)
a<-table.element(a,'T-STAT',header=TRUE)
a<-table.element(a,'P-value',header=TRUE)
a<-table.row.end(a)
for (i in 2:(par1+1)) {
a<-table.row.start(a)
a<-table.element(a,i-1,header=TRUE)
a<-table.element(a,round(myacf[i],6))
mytstat <- myacf[i]*sqrtn
a<-table.element(a,round(mytstat,4))
a<-table.element(a,round(1-pt(abs(mytstat),lengthx),6))
a<-table.row.end(a)
}
a<-table.end(a)
table.save(a,file='mytable.tab')
a<-table.start()
a<-table.row.start(a)
a<-table.element(a,'Partial Autocorrelation Function',4,TRUE)
a<-table.row.end(a)
a<-table.row.start(a)
a<-table.element(a,'Time lag k',header=TRUE)
a<-table.element(a,hyperlink('basics.htm','PACF(k)','click here for more information about the Partial Autocorrelation Function'),header=TRUE)
a<-table.element(a,'T-STAT',header=TRUE)
a<-table.element(a,'P-value',header=TRUE)
a<-table.row.end(a)
for (i in 1:par1) {
a<-table.row.start(a)
a<-table.element(a,i,header=TRUE)
a<-table.element(a,round(mypacf[i],6))
mytstat <- mypacf[i]*sqrtn
a<-table.element(a,round(mytstat,4))
a<-table.element(a,round(1-pt(abs(mytstat),lengthx),6))
a<-table.row.end(a)
}
a<-table.end(a)
table.save(a,file='mytable1.tab')