Free Statistics
of Irreproducible Research!
Description of Statistical Computation | |||||||||||||||||||||||||||||||||||||||||
|---|---|---|---|---|---|---|---|---|---|---|---|---|---|---|---|---|---|---|---|---|---|---|---|---|---|---|---|---|---|---|---|---|---|---|---|---|---|---|---|---|---|
| Author's title | |||||||||||||||||||||||||||||||||||||||||
| Author | *The author of this computation has been verified* | ||||||||||||||||||||||||||||||||||||||||
| R Software Module | rwasp_univariatedataseries.wasp | ||||||||||||||||||||||||||||||||||||||||
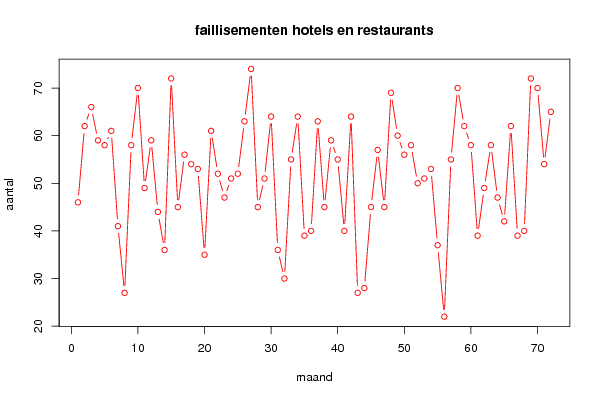
| Title produced by software | Univariate Data Series | ||||||||||||||||||||||||||||||||||||||||
| Date of computation | Sun, 14 Dec 2008 04:54:22 -0700 | ||||||||||||||||||||||||||||||||||||||||
| Cite this page as follows | Statistical Computations at FreeStatistics.org, Office for Research Development and Education, URL https://freestatistics.org/blog/index.php?v=date/2008/Dec/14/t1229255727km62w22368jblsu.htm/, Retrieved Wed, 13 May 2026 08:25:50 +0000 | ||||||||||||||||||||||||||||||||||||||||
| Statistical Computations at FreeStatistics.org, Office for Research Development and Education, URL https://freestatistics.org/blog/index.php?pk=33313, Retrieved Wed, 13 May 2026 08:25:50 +0000 | |||||||||||||||||||||||||||||||||||||||||
| QR Codes: | |||||||||||||||||||||||||||||||||||||||||
|
| |||||||||||||||||||||||||||||||||||||||||
| Original text written by user: | |||||||||||||||||||||||||||||||||||||||||
| IsPrivate? | No (this computation is public) | ||||||||||||||||||||||||||||||||||||||||
| User-defined keywords | |||||||||||||||||||||||||||||||||||||||||
| Estimated Impact | 1606 | ||||||||||||||||||||||||||||||||||||||||
Tree of Dependent Computations | |||||||||||||||||||||||||||||||||||||||||
| Family? (F = Feedback message, R = changed R code, M = changed R Module, P = changed Parameters, D = changed Data) | |||||||||||||||||||||||||||||||||||||||||
| - [Univariate Data Series] [] [2008-12-14 11:54:22] [f6a332ba2d530c028d935c5a5bbb53af] [Current] - P [Univariate Data Series] [] [2008-12-14 16:00:14] [02b59b53a6e71d56ed6fa0367fb87095] - MP [Univariate Data Series] [Data WS9 Faillise...] [2010-12-03 13:10:46] [6ca0fc48dd5333d51a15728999009c83] - RMP [(Partial) Autocorrelation Function] [workshop 9 - 1] [2010-12-03 13:15:48] [ec7b4b7cc1a30b20be5ec01cdf2adbbd] - RMP [(Partial) Autocorrelation Function] [workshop 9 - 1] [2010-12-03 13:19:03] [ec7b4b7cc1a30b20be5ec01cdf2adbbd] - PD [(Partial) Autocorrelation Function] [paper - time-seri...] [2010-12-10 14:01:10] [ec7b4b7cc1a30b20be5ec01cdf2adbbd] - PD [(Partial) Autocorrelation Function] [paper - time-seri...] [2010-12-10 15:30:46] [ec7b4b7cc1a30b20be5ec01cdf2adbbd] - RMPD [ARIMA Backward Selection] [paper - time-seri...] [2010-12-10 15:35:16] [ec7b4b7cc1a30b20be5ec01cdf2adbbd] - RMPD [ARIMA Forecasting] [paper - time-seri...] [2010-12-10 15:44:03] [ec7b4b7cc1a30b20be5ec01cdf2adbbd] - RMPD [One-Way-Between-Groups ANOVA- Free Statistics Software (Calculator)] [paper - one-way-a...] [2010-12-15 15:13:20] [ec7b4b7cc1a30b20be5ec01cdf2adbbd] - P [One-Way-Between-Groups ANOVA- Free Statistics Software (Calculator)] [paper - chi-squared] [2010-12-15 18:25:43] [ec7b4b7cc1a30b20be5ec01cdf2adbbd] - PD [(Partial) Autocorrelation Function] [paper - time-seri...] [2010-12-10 14:05:08] [ec7b4b7cc1a30b20be5ec01cdf2adbbd] - RMP [(Partial) Autocorrelation Function] [workshop 9 - 2] [2010-12-03 13:23:12] [ec7b4b7cc1a30b20be5ec01cdf2adbbd] - RMP [ARIMA Forecasting] [workshop 9 - 7] [2010-12-03 17:21:13] [ec7b4b7cc1a30b20be5ec01cdf2adbbd] - RMP [ARIMA Backward Selection] [workshop 9 - 8] [2010-12-03 17:23:59] [ec7b4b7cc1a30b20be5ec01cdf2adbbd] - MP [Univariate Data Series] [Data WS9 aantal f...] [2010-12-03 13:26:10] [49c7a512c56172bc46ae7e93e5b58c1c] - PD [Univariate Data Series] [Statistiek Paper 5] [2010-12-21 18:48:09] [a90833f600c49a37df2affa5b2163a2e] - RMP [(Partial) Autocorrelation Function] [WS9 autocorrelatie] [2010-12-03 14:37:51] [65eb19f81eab2b6e672eafaed2a27190] - [(Partial) Autocorrelation Function] [] [2010-12-07 21:29:26] [afdb2fc47981b6a655b732edc8065db9] - RMP [Variance Reduction Matrix] [WS9 VRM] [2010-12-03 14:47:00] [65eb19f81eab2b6e672eafaed2a27190] - P [Variance Reduction Matrix] [WS9 VRM] [2010-12-03 19:50:23] [65eb19f81eab2b6e672eafaed2a27190] - [Variance Reduction Matrix] [] [2010-12-07 21:53:22] [afdb2fc47981b6a655b732edc8065db9] - MP [Univariate Data Series] [ws9] [2010-12-06 10:48:40] [e4076051fbfb461c886b1e223cd7862f] - MP [Univariate Data Series] [tijdreeks WS9] [2010-12-06 18:54:58] [c289bfbb56808c5d93a0f55b5d39f5bd] - RMP [Standard Deviation-Mean Plot] [] [2010-12-07 09:03:14] [d7b28a0391ab3b2ddc9f9fba95a43f33] - RMP [(Partial) Autocorrelation Function] [] [2010-12-07 09:20:25] [d7b28a0391ab3b2ddc9f9fba95a43f33] - MP [Univariate Data Series] [workshop9data] [2010-12-07 09:35:28] [3fb95cad3bbcce10c72dbbcc5bec5662] - PD [Univariate Data Series] [WS10Appelsienen] [2010-12-14 18:01:47] [3fb95cad3bbcce10c72dbbcc5bec5662] - PD [Univariate Data Series] [WS10citroenen] [2010-12-14 18:05:44] [3fb95cad3bbcce10c72dbbcc5bec5662] - PD [Univariate Data Series] [WS10bananen] [2010-12-14 18:09:36] [3fb95cad3bbcce10c72dbbcc5bec5662] - RMP [(Partial) Autocorrelation Function] [] [2010-12-07 13:42:19] [dd4fe494cff2ee46c12b15bdc7b848ca] - P [(Partial) Autocorrelation Function] [] [2010-12-07 13:48:04] [dd4fe494cff2ee46c12b15bdc7b848ca] - [(Partial) Autocorrelation Function] [] [2010-12-07 13:50:06] [dd4fe494cff2ee46c12b15bdc7b848ca] - RM [Spectral Analysis] [] [2010-12-07 14:05:43] [dd4fe494cff2ee46c12b15bdc7b848ca] - [Spectral Analysis] [] [2010-12-07 14:08:00] [dd4fe494cff2ee46c12b15bdc7b848ca] - [Spectral Analysis] [] [2010-12-07 14:11:43] [dd4fe494cff2ee46c12b15bdc7b848ca] - RM [Variance Reduction Matrix] [] [2010-12-07 14:15:02] [dd4fe494cff2ee46c12b15bdc7b848ca] - PD [Variance Reduction Matrix] [] [2010-12-21 20:42:42] [dd4fe494cff2ee46c12b15bdc7b848ca] - RM [Standard Deviation-Mean Plot] [] [2010-12-07 14:26:40] [dd4fe494cff2ee46c12b15bdc7b848ca] - PD [Standard Deviation-Mean Plot] [] [2010-12-22 15:45:02] [dd4fe494cff2ee46c12b15bdc7b848ca] - P [Spectral Analysis] [] [2010-12-12 22:25:49] [5b5e2f42cf221276958b46f2b8444c18] - PD [Spectral Analysis] [] [2010-12-21 20:29:14] [dd4fe494cff2ee46c12b15bdc7b848ca] - PD [Spectral Analysis] [] [2010-12-21 20:38:56] [dd4fe494cff2ee46c12b15bdc7b848ca] - [(Partial) Autocorrelation Function] [WS 9 1] [2010-12-07 17:42:29] [eeb33d252044f8583501f5ba0605ad6d] - P [(Partial) Autocorrelation Function] [WS 9 2] [2010-12-07 17:56:04] [eeb33d252044f8583501f5ba0605ad6d] - P [(Partial) Autocorrelation Function] [WS 9 3] [2010-12-07 18:01:09] [eeb33d252044f8583501f5ba0605ad6d] - P [(Partial) Autocorrelation Function] [] [2010-12-12 16:46:37] [5b5e2f42cf221276958b46f2b8444c18] - P [(Partial) Autocorrelation Function] [] [2010-12-12 22:07:32] [5b5e2f42cf221276958b46f2b8444c18] - P [(Partial) Autocorrelation Function] [] [2010-12-12 22:07:32] [5b5e2f42cf221276958b46f2b8444c18] [Truncated] | |||||||||||||||||||||||||||||||||||||||||
| Feedback Forum | |||||||||||||||||||||||||||||||||||||||||
Post a new message | |||||||||||||||||||||||||||||||||||||||||
Dataset | |||||||||||||||||||||||||||||||||||||||||
| Dataseries X: | |||||||||||||||||||||||||||||||||||||||||
46 62 66 59 58 61 41 27 58 70 49 59 44 36 72 45 56 54 53 35 61 52 47 51 52 63 74 45 51 64 36 30 55 64 39 40 63 45 59 55 40 64 27 28 45 57 45 69 60 56 58 50 51 53 37 22 55 70 62 58 39 49 58 47 42 62 39 40 72 70 54 65 | |||||||||||||||||||||||||||||||||||||||||
Tables (Output of Computation) | |||||||||||||||||||||||||||||||||||||||||
| |||||||||||||||||||||||||||||||||||||||||
Figures (Output of Computation) | |||||||||||||||||||||||||||||||||||||||||
Input Parameters & R Code | |||||||||||||||||||||||||||||||||||||||||
| Parameters (Session): | |||||||||||||||||||||||||||||||||||||||||
| par1 = aantal faillisementen ; par2 = ecodata ; par3 = http://ecodata.economie.fgov.be/mdn/faillissementen.jsp?ROWDIMENSIONS=Jaar%2CActiviteit&ROWDIMENSIONS=Maand&COLUMNDIMENSIONS=Geografische+zone&STATISTICSPERMEASURE=number:SUM ; | |||||||||||||||||||||||||||||||||||||||||
| Parameters (R input): | |||||||||||||||||||||||||||||||||||||||||
| par1 = aantal faillisementen ; par2 = ecodata ; par3 = http://ecodata.economie.fgov.be/mdn/faillissementen.jsp?ROWDIMENSIONS=Jaar%2CActiviteit&ROWDIMENSIONS=Maand&COLUMNDIMENSIONS=Geografische+zone&STATISTICSPERMEASURE=number:SUM ; | |||||||||||||||||||||||||||||||||||||||||
| R code (references can be found in the software module): | |||||||||||||||||||||||||||||||||||||||||
bitmap(file='test1.png') | |||||||||||||||||||||||||||||||||||||||||