Free Statistics

of Irreproducible Research!

Author's title

Author*The author of this computation has been verified*
R Software Modulerwasp_cross.wasp
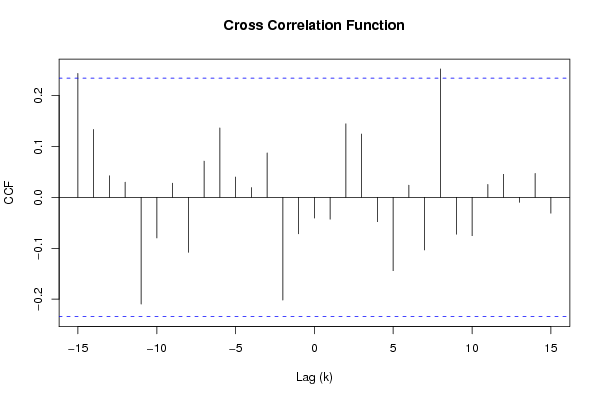
Title produced by softwareCross Correlation Function
Date of computationSat, 13 Dec 2008 05:06:25 -0700
Cite this page as followsStatistical Computations at FreeStatistics.org, Office for Research Development and Education, URL https://freestatistics.org/blog/index.php?v=date/2008/Dec/13/t1229170106kt4pxeud6zrwnkx.htm/, Retrieved Fri, 24 May 2024 21:16:17 +0000
Statistical Computations at FreeStatistics.org, Office for Research Development and Education, URL https://freestatistics.org/blog/index.php?pk=32994, Retrieved Fri, 24 May 2024 21:16:17 +0000
QR Codes:

Original text written by user:
IsPrivate?No (this computation is public)
User-defined keywords
Estimated Impact221
Family? (F = Feedback message, R = changed R code, M = changed R Module, P = changed Parameters, D = changed Data)
-     [(Partial) Autocorrelation Function] [ACF d=0 D=0 voor Xt] [2008-12-13 09:26:24] [b1bd16d1f47bfe13feacf1c27a0abba5]
-   PD  [(Partial) Autocorrelation Function] [ACF d=0 D=1] [2008-12-13 09:29:39] [b1bd16d1f47bfe13feacf1c27a0abba5]
- RMPD      [Cross Correlation Function] [CCF met transform...] [2008-12-13 12:06:25] [e7b1048c2c3a353441b9143db4404b91] [Current]
Feedback Forum

Post a new message
Dataseries X:
97.8
107.4
117.5
105.6
97.4
99.5
98
104.3
100.6
101.1
103.9
96.9
95.5
108.4
117
103.8
100.8
110.6
104
112.6
107.3
98.9
109.8
104.9
102.2
123.9
124.9
112.7
121.9
100.6
104.3
120.4
107.5
102.9
125.6
107.5
108.8
128.4
121.1
119.5
128.7
108.7
105.5
119.8
111.3
110.6
120.1
97.5
107.7
127.3
117.2
119.8
116.2
111
112.4
130.6
109.1
118.8
123.9
101.6
112.8
128
129.6
125.8
119.5
115.7
113.6
129.7
112
116.8
127
112.1
114.2
121.1
131.6
125
120.4
117.7
117.5
120.6
127.5
112.3
124.5
115.2
Dataseries Y:
6.4
6.8
7.5
7.5
7.6
7.6
7.4
7.3
7.1
6.9
6.8
7.5
7.6
7.8
8
8.1
8.2
8.3
8.2
8
7.9
7.6
7.6
8.2
8.3
8.4
8.4
8.4
8.6
8.9
8.8
8.3
7.5
7.2
7.5
8.8
9.3
9.3
8.7
8.2
8.3
8.5
8.6
8.6
8.2
8.1
8
8.6
8.7
8.8
8.5
8.4
8.5
8.7
8.7
8.6
8.5
8.3
8.1
8.2
8.1
8.1
7.9
7.9
7.9
8
8
7.9
8
7.7
7.2
7.5
7.3
7
7
7
7.2
7.3
7.1
6.8
6.6
6.2
6.2
6.8


Summary of computational transaction
Raw Inputview raw input (R code)
Raw Outputview raw output of R engine
Computing time1 seconds
R Server'George Udny Yule' @ 72.249.76.132

\begin{tabular}{lllllllll}
\hline
Summary of computational transaction \tabularnewline
Raw Input & view raw input (R code)  \tabularnewline
Raw Output & view raw output of R engine  \tabularnewline
Computing time & 1 seconds \tabularnewline
R Server & 'George Udny Yule' @ 72.249.76.132 \tabularnewline
\hline
\end{tabular}
%Source: https://freestatistics.org/blog/index.php?pk=32994&T=0

[TABLE]
[ROW][C]Summary of computational transaction[/C][/ROW]
[ROW][C]Raw Input[/C][C]view raw input (R code) [/C][/ROW]
[ROW][C]Raw Output[/C][C]view raw output of R engine [/C][/ROW]
[ROW][C]Computing time[/C][C]1 seconds[/C][/ROW]
[ROW][C]R Server[/C][C]'George Udny Yule' @ 72.249.76.132[/C][/ROW]
[/TABLE]
Source: https://freestatistics.org/blog/index.php?pk=32994&T=0

Globally Unique Identifier (entire table): ba.freestatistics.org/blog/index.php?pk=32994&T=0

As an alternative you can also use a QR Code:  

The GUIDs for individual cells are displayed in the table below:

Summary of computational transaction
Raw Inputview raw input (R code)
Raw Outputview raw output of R engine
Computing time1 seconds
R Server'George Udny Yule' @ 72.249.76.132


Cross Correlation Function
ParameterValue
Box-Cox transformation parameter (lambda) of X series1
Degree of non-seasonal differencing (d) of X series0
Degree of seasonal differencing (D) of X series1
Seasonal Period (s)12
Box-Cox transformation parameter (lambda) of Y series1
Degree of non-seasonal differencing (d) of Y series2
Degree of seasonal differencing (D) of Y series1
krho(Y[t],X[t+k])
-150.243124726832891
-140.133330475383114
-130.0423177122606378
-120.0297043767825506
-11-0.209570201479934
-10-0.0797845765427001
-90.0278782417043689
-8-0.107934194357760
-70.0710892336626931
-60.136213846559190
-50.0398527125885413
-40.0190980937897703
-30.0871230388692621
-2-0.201802060311448
-1-0.0715867565322901
0-0.0406838019275273
1-0.0430470355581162
20.144422973907546
30.124114994957619
4-0.0478413468469625
5-0.143914143700004
60.0237849853681368
7-0.103326454145012
80.252040562802835
9-0.0722765041469595
10-0.075188143667898
110.0252549393010384
120.0452406591195207
13-0.00988261336427377
140.0470159111769489
15-0.0310725646739439

\begin{tabular}{lllllllll}
\hline
Cross Correlation Function \tabularnewline
Parameter & Value \tabularnewline
Box-Cox transformation parameter (lambda) of X series & 1 \tabularnewline
Degree of non-seasonal differencing (d) of X series & 0 \tabularnewline
Degree of seasonal differencing (D) of X series & 1 \tabularnewline
Seasonal Period (s) & 12 \tabularnewline
Box-Cox transformation parameter (lambda) of Y series & 1 \tabularnewline
Degree of non-seasonal differencing (d) of Y series & 2 \tabularnewline
Degree of seasonal differencing (D) of Y series & 1 \tabularnewline
k & rho(Y[t],X[t+k]) \tabularnewline
-15 & 0.243124726832891 \tabularnewline
-14 & 0.133330475383114 \tabularnewline
-13 & 0.0423177122606378 \tabularnewline
-12 & 0.0297043767825506 \tabularnewline
-11 & -0.209570201479934 \tabularnewline
-10 & -0.0797845765427001 \tabularnewline
-9 & 0.0278782417043689 \tabularnewline
-8 & -0.107934194357760 \tabularnewline
-7 & 0.0710892336626931 \tabularnewline
-6 & 0.136213846559190 \tabularnewline
-5 & 0.0398527125885413 \tabularnewline
-4 & 0.0190980937897703 \tabularnewline
-3 & 0.0871230388692621 \tabularnewline
-2 & -0.201802060311448 \tabularnewline
-1 & -0.0715867565322901 \tabularnewline
0 & -0.0406838019275273 \tabularnewline
1 & -0.0430470355581162 \tabularnewline
2 & 0.144422973907546 \tabularnewline
3 & 0.124114994957619 \tabularnewline
4 & -0.0478413468469625 \tabularnewline
5 & -0.143914143700004 \tabularnewline
6 & 0.0237849853681368 \tabularnewline
7 & -0.103326454145012 \tabularnewline
8 & 0.252040562802835 \tabularnewline
9 & -0.0722765041469595 \tabularnewline
10 & -0.075188143667898 \tabularnewline
11 & 0.0252549393010384 \tabularnewline
12 & 0.0452406591195207 \tabularnewline
13 & -0.00988261336427377 \tabularnewline
14 & 0.0470159111769489 \tabularnewline
15 & -0.0310725646739439 \tabularnewline
\hline
\end{tabular}
%Source: https://freestatistics.org/blog/index.php?pk=32994&T=1

[TABLE]
[ROW][C]Cross Correlation Function[/C][/ROW]
[ROW][C]Parameter[/C][C]Value[/C][/ROW]
[ROW][C]Box-Cox transformation parameter (lambda) of X series[/C][C]1[/C][/ROW]
[ROW][C]Degree of non-seasonal differencing (d) of X series[/C][C]0[/C][/ROW]
[ROW][C]Degree of seasonal differencing (D) of X series[/C][C]1[/C][/ROW]
[ROW][C]Seasonal Period (s)[/C][C]12[/C][/ROW]
[ROW][C]Box-Cox transformation parameter (lambda) of Y series[/C][C]1[/C][/ROW]
[ROW][C]Degree of non-seasonal differencing (d) of Y series[/C][C]2[/C][/ROW]
[ROW][C]Degree of seasonal differencing (D) of Y series[/C][C]1[/C][/ROW]
[ROW][C]k[/C][C]rho(Y[t],X[t+k])[/C][/ROW]
[ROW][C]-15[/C][C]0.243124726832891[/C][/ROW]
[ROW][C]-14[/C][C]0.133330475383114[/C][/ROW]
[ROW][C]-13[/C][C]0.0423177122606378[/C][/ROW]
[ROW][C]-12[/C][C]0.0297043767825506[/C][/ROW]
[ROW][C]-11[/C][C]-0.209570201479934[/C][/ROW]
[ROW][C]-10[/C][C]-0.0797845765427001[/C][/ROW]
[ROW][C]-9[/C][C]0.0278782417043689[/C][/ROW]
[ROW][C]-8[/C][C]-0.107934194357760[/C][/ROW]
[ROW][C]-7[/C][C]0.0710892336626931[/C][/ROW]
[ROW][C]-6[/C][C]0.136213846559190[/C][/ROW]
[ROW][C]-5[/C][C]0.0398527125885413[/C][/ROW]
[ROW][C]-4[/C][C]0.0190980937897703[/C][/ROW]
[ROW][C]-3[/C][C]0.0871230388692621[/C][/ROW]
[ROW][C]-2[/C][C]-0.201802060311448[/C][/ROW]
[ROW][C]-1[/C][C]-0.0715867565322901[/C][/ROW]
[ROW][C]0[/C][C]-0.0406838019275273[/C][/ROW]
[ROW][C]1[/C][C]-0.0430470355581162[/C][/ROW]
[ROW][C]2[/C][C]0.144422973907546[/C][/ROW]
[ROW][C]3[/C][C]0.124114994957619[/C][/ROW]
[ROW][C]4[/C][C]-0.0478413468469625[/C][/ROW]
[ROW][C]5[/C][C]-0.143914143700004[/C][/ROW]
[ROW][C]6[/C][C]0.0237849853681368[/C][/ROW]
[ROW][C]7[/C][C]-0.103326454145012[/C][/ROW]
[ROW][C]8[/C][C]0.252040562802835[/C][/ROW]
[ROW][C]9[/C][C]-0.0722765041469595[/C][/ROW]
[ROW][C]10[/C][C]-0.075188143667898[/C][/ROW]
[ROW][C]11[/C][C]0.0252549393010384[/C][/ROW]
[ROW][C]12[/C][C]0.0452406591195207[/C][/ROW]
[ROW][C]13[/C][C]-0.00988261336427377[/C][/ROW]
[ROW][C]14[/C][C]0.0470159111769489[/C][/ROW]
[ROW][C]15[/C][C]-0.0310725646739439[/C][/ROW]
[/TABLE]
Source: https://freestatistics.org/blog/index.php?pk=32994&T=1

Globally Unique Identifier (entire table): ba.freestatistics.org/blog/index.php?pk=32994&T=1

As an alternative you can also use a QR Code:  

The GUIDs for individual cells are displayed in the table below:

Cross Correlation Function
ParameterValue
Box-Cox transformation parameter (lambda) of X series1
Degree of non-seasonal differencing (d) of X series0
Degree of seasonal differencing (D) of X series1
Seasonal Period (s)12
Box-Cox transformation parameter (lambda) of Y series1
Degree of non-seasonal differencing (d) of Y series2
Degree of seasonal differencing (D) of Y series1
krho(Y[t],X[t+k])
-150.243124726832891
-140.133330475383114
-130.0423177122606378
-120.0297043767825506
-11-0.209570201479934
-10-0.0797845765427001
-90.0278782417043689
-8-0.107934194357760
-70.0710892336626931
-60.136213846559190
-50.0398527125885413
-40.0190980937897703
-30.0871230388692621
-2-0.201802060311448
-1-0.0715867565322901
0-0.0406838019275273
1-0.0430470355581162
20.144422973907546
30.124114994957619
4-0.0478413468469625
5-0.143914143700004
60.0237849853681368
7-0.103326454145012
80.252040562802835
9-0.0722765041469595
10-0.075188143667898
110.0252549393010384
120.0452406591195207
13-0.00988261336427377
140.0470159111769489
15-0.0310725646739439


Parameters (Session):
par1 = 1 ; par2 = 0 ; par3 = 2 ; par4 = 12 ;
Parameters (R input):
par1 = 1 ; par2 = 0 ; par3 = 1 ; par4 = 12 ; par5 = 1 ; par6 = 2 ; par7 = 1 ;
R code (references can be found in the software module):
par1 <- as.numeric(par1)
par2 <- as.numeric(par2)
par3 <- as.numeric(par3)
par4 <- as.numeric(par4)
par5 <- as.numeric(par5)
par6 <- as.numeric(par6)
par7 <- as.numeric(par7)
if (par1 == 0) {
x <- log(x)
} else {
x <- (x ^ par1 - 1) / par1
}
if (par5 == 0) {
y <- log(y)
} else {
y <- (y ^ par5 - 1) / par5
}
if (par2 > 0) x <- diff(x,lag=1,difference=par2)
if (par6 > 0) y <- diff(y,lag=1,difference=par6)
if (par3 > 0) x <- diff(x,lag=par4,difference=par3)
if (par7 > 0) y <- diff(y,lag=par4,difference=par7)
x
y
bitmap(file='test1.png')
(r <- ccf(x,y,main='Cross Correlation Function',ylab='CCF',xlab='Lag (k)'))
dev.off()
load(file='createtable')
a<-table.start()
a<-table.row.start(a)
a<-table.element(a,'Cross Correlation Function',2,TRUE)
a<-table.row.end(a)
a<-table.row.start(a)
a<-table.element(a,'Parameter',header=TRUE)
a<-table.element(a,'Value',header=TRUE)
a<-table.row.end(a)
a<-table.row.start(a)
a<-table.element(a,'Box-Cox transformation parameter (lambda) of X series',header=TRUE)
a<-table.element(a,par1)
a<-table.row.end(a)
a<-table.row.start(a)
a<-table.element(a,'Degree of non-seasonal differencing (d) of X series',header=TRUE)
a<-table.element(a,par2)
a<-table.row.end(a)
a<-table.row.start(a)
a<-table.element(a,'Degree of seasonal differencing (D) of X series',header=TRUE)
a<-table.element(a,par3)
a<-table.row.end(a)
a<-table.row.start(a)
a<-table.element(a,'Seasonal Period (s)',header=TRUE)
a<-table.element(a,par4)
a<-table.row.end(a)
a<-table.row.start(a)
a<-table.element(a,'Box-Cox transformation parameter (lambda) of Y series',header=TRUE)
a<-table.element(a,par5)
a<-table.row.end(a)
a<-table.row.start(a)
a<-table.element(a,'Degree of non-seasonal differencing (d) of Y series',header=TRUE)
a<-table.element(a,par6)
a<-table.row.end(a)
a<-table.row.start(a)
a<-table.element(a,'Degree of seasonal differencing (D) of Y series',header=TRUE)
a<-table.element(a,par7)
a<-table.row.end(a)
a<-table.row.start(a)
a<-table.element(a,'k',header=TRUE)
a<-table.element(a,'rho(Y[t],X[t+k])',header=TRUE)
a<-table.row.end(a)
mylength <- length(r$acf)
myhalf <- floor((mylength-1)/2)
for (i in 1:mylength) {
a<-table.row.start(a)
a<-table.element(a,i-myhalf-1,header=TRUE)
a<-table.element(a,r$acf[i])
a<-table.row.end(a)
}
a<-table.end(a)
table.save(a,file='mytable.tab')