Free Statistics

of Irreproducible Research!

Author's title

Author*The author of this computation has been verified*
R Software Modulerwasp_autocorrelation.wasp
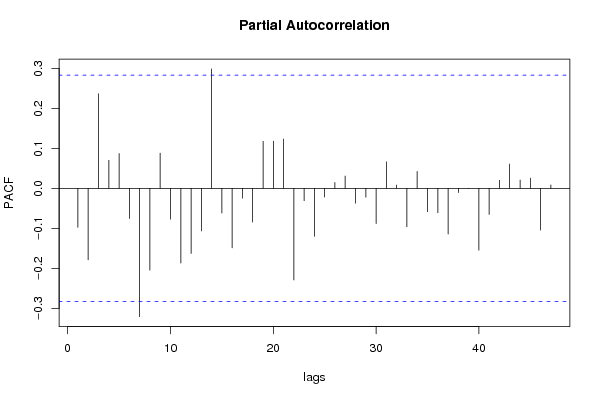
Title produced by software(Partial) Autocorrelation Function
Date of computationThu, 11 Dec 2008 10:22:27 -0700
Cite this page as followsStatistical Computations at FreeStatistics.org, Office for Research Development and Education, URL https://freestatistics.org/blog/index.php?v=date/2008/Dec/11/t1229016195vo5ny9ebb02ogi3.htm/, Retrieved Fri, 24 May 2024 20:55:19 +0000
Statistical Computations at FreeStatistics.org, Office for Research Development and Education, URL https://freestatistics.org/blog/index.php?pk=32361, Retrieved Fri, 24 May 2024 20:55:19 +0000
QR Codes:

Original text written by user:
IsPrivate?No (this computation is public)
User-defined keywords
Estimated Impact182
Family? (F = Feedback message, R = changed R code, M = changed R Module, P = changed Parameters, D = changed Data)
-     [Univariate Data Series] [Uitvoer.Nederland] [2008-12-03 15:11:10] [988ab43f527fc78aae41c84649095267]
-   P   [Univariate Data Series] [Export From Belgi...] [2008-12-03 15:52:29] [988ab43f527fc78aae41c84649095267]
- RMP     [(Partial) Autocorrelation Function] [Partial Autocorre...] [2008-12-03 16:01:07] [988ab43f527fc78aae41c84649095267]
-   PD        [(Partial) Autocorrelation Function] [Partial Autocorre...] [2008-12-11 17:22:27] [5d823194959040fa9b19b8c8302177e6] [Current]
Feedback Forum

Post a new message
Dataseries X:
13807.9
14101.7
16010.3
14633.1
14478.5
15327.3
14179.5
11398.2
16111.5
15887.4
14529.3
13923.1
13960.2
14807.8
17511.5
15845.9
14594.2
17252.2
14832.8
13132.1
17665.9
16913
17318.8
16224.2
15469.6
16557.5
19414.8
17335
16525.2
18160.4
15553.8
15262.2
18581
17564.1
18948.6
17187.8
17564.8
17668.4
20811.7
17257.8
18984.2
20532.6
17082.3
16894.9
20274.9
20078.6
19900.9
17012.2
19642.9
19024
21691
18835.9
19873.4
21468.2
19406.8
18385.3
20739.3
22268.3
21569
17514.8


Summary of computational transaction
Raw Inputview raw input (R code)
Raw Outputview raw output of R engine
Computing time2 seconds
R Server'George Udny Yule' @ 72.249.76.132

\begin{tabular}{lllllllll}
\hline
Summary of computational transaction \tabularnewline
Raw Input & view raw input (R code)  \tabularnewline
Raw Output & view raw output of R engine  \tabularnewline
Computing time & 2 seconds \tabularnewline
R Server & 'George Udny Yule' @ 72.249.76.132 \tabularnewline
\hline
\end{tabular}
%Source: https://freestatistics.org/blog/index.php?pk=32361&T=0

[TABLE]
[ROW][C]Summary of computational transaction[/C][/ROW]
[ROW][C]Raw Input[/C][C]view raw input (R code) [/C][/ROW]
[ROW][C]Raw Output[/C][C]view raw output of R engine [/C][/ROW]
[ROW][C]Computing time[/C][C]2 seconds[/C][/ROW]
[ROW][C]R Server[/C][C]'George Udny Yule' @ 72.249.76.132[/C][/ROW]
[/TABLE]
Source: https://freestatistics.org/blog/index.php?pk=32361&T=0

Globally Unique Identifier (entire table): ba.freestatistics.org/blog/index.php?pk=32361&T=0

As an alternative you can also use a QR Code:  

The GUIDs for individual cells are displayed in the table below:

Summary of computational transaction
Raw Inputview raw input (R code)
Raw Outputview raw output of R engine
Computing time2 seconds
R Server'George Udny Yule' @ 72.249.76.132


Autocorrelation Function
Time lag kACF(k)T-STATP-value
1-0.097429-0.6750.251454
2-0.167497-1.16050.125802
30.2632361.82380.03721
40.0465260.32230.374296
5-0.010402-0.07210.471423
6-0.028847-0.19990.421218
7-0.257074-1.78110.040615
8-0.069918-0.48440.31515
90.1552491.07560.143742
10-0.232097-1.6080.057195
11-0.260832-1.80710.038509
120.0203260.14080.444299
13-0.020082-0.13910.444965
140.1881151.30330.099345
15-0.151527-1.04980.149532
16-0.154447-1.070.144976
170.2863011.98360.026521
180.0680940.47180.319615
19-0.035178-0.24370.404243
200.0814260.56410.287643
210.1046110.72480.236057
22-0.042222-0.29250.385575
230.179881.24620.109361
24-0.174291-1.20750.116574
25-0.204292-1.41540.081707
260.1831071.26860.105351
27-0.028551-0.19780.422017
28-0.162232-1.1240.133307
29-0.020509-0.14210.443802
30-0.0938-0.64990.259439
310.0827310.57320.284601
320.0140380.09730.461464
33-0.139035-0.96330.170122
340.0789270.54680.293517
350.1375490.9530.172691
36-0.0861-0.59650.276816
37-0.002658-0.01840.492693
380.0275270.19070.424777
39-0.059286-0.41070.341543
400.08630.59790.276358
41-0.007057-0.04890.480605
42-0.097653-0.67660.250967
430.0680020.47110.319841
440.0313410.21710.414512
45-0.054478-0.37740.353757
460.0094940.06580.473915
470.0447130.30980.379034
48NANANA

\begin{tabular}{lllllllll}
\hline
Autocorrelation Function \tabularnewline
Time lag k & ACF(k) & T-STAT & P-value \tabularnewline
1 & -0.097429 & -0.675 & 0.251454 \tabularnewline
2 & -0.167497 & -1.1605 & 0.125802 \tabularnewline
3 & 0.263236 & 1.8238 & 0.03721 \tabularnewline
4 & 0.046526 & 0.3223 & 0.374296 \tabularnewline
5 & -0.010402 & -0.0721 & 0.471423 \tabularnewline
6 & -0.028847 & -0.1999 & 0.421218 \tabularnewline
7 & -0.257074 & -1.7811 & 0.040615 \tabularnewline
8 & -0.069918 & -0.4844 & 0.31515 \tabularnewline
9 & 0.155249 & 1.0756 & 0.143742 \tabularnewline
10 & -0.232097 & -1.608 & 0.057195 \tabularnewline
11 & -0.260832 & -1.8071 & 0.038509 \tabularnewline
12 & 0.020326 & 0.1408 & 0.444299 \tabularnewline
13 & -0.020082 & -0.1391 & 0.444965 \tabularnewline
14 & 0.188115 & 1.3033 & 0.099345 \tabularnewline
15 & -0.151527 & -1.0498 & 0.149532 \tabularnewline
16 & -0.154447 & -1.07 & 0.144976 \tabularnewline
17 & 0.286301 & 1.9836 & 0.026521 \tabularnewline
18 & 0.068094 & 0.4718 & 0.319615 \tabularnewline
19 & -0.035178 & -0.2437 & 0.404243 \tabularnewline
20 & 0.081426 & 0.5641 & 0.287643 \tabularnewline
21 & 0.104611 & 0.7248 & 0.236057 \tabularnewline
22 & -0.042222 & -0.2925 & 0.385575 \tabularnewline
23 & 0.17988 & 1.2462 & 0.109361 \tabularnewline
24 & -0.174291 & -1.2075 & 0.116574 \tabularnewline
25 & -0.204292 & -1.4154 & 0.081707 \tabularnewline
26 & 0.183107 & 1.2686 & 0.105351 \tabularnewline
27 & -0.028551 & -0.1978 & 0.422017 \tabularnewline
28 & -0.162232 & -1.124 & 0.133307 \tabularnewline
29 & -0.020509 & -0.1421 & 0.443802 \tabularnewline
30 & -0.0938 & -0.6499 & 0.259439 \tabularnewline
31 & 0.082731 & 0.5732 & 0.284601 \tabularnewline
32 & 0.014038 & 0.0973 & 0.461464 \tabularnewline
33 & -0.139035 & -0.9633 & 0.170122 \tabularnewline
34 & 0.078927 & 0.5468 & 0.293517 \tabularnewline
35 & 0.137549 & 0.953 & 0.172691 \tabularnewline
36 & -0.0861 & -0.5965 & 0.276816 \tabularnewline
37 & -0.002658 & -0.0184 & 0.492693 \tabularnewline
38 & 0.027527 & 0.1907 & 0.424777 \tabularnewline
39 & -0.059286 & -0.4107 & 0.341543 \tabularnewline
40 & 0.0863 & 0.5979 & 0.276358 \tabularnewline
41 & -0.007057 & -0.0489 & 0.480605 \tabularnewline
42 & -0.097653 & -0.6766 & 0.250967 \tabularnewline
43 & 0.068002 & 0.4711 & 0.319841 \tabularnewline
44 & 0.031341 & 0.2171 & 0.414512 \tabularnewline
45 & -0.054478 & -0.3774 & 0.353757 \tabularnewline
46 & 0.009494 & 0.0658 & 0.473915 \tabularnewline
47 & 0.044713 & 0.3098 & 0.379034 \tabularnewline
48 & NA & NA & NA \tabularnewline
\hline
\end{tabular}
%Source: https://freestatistics.org/blog/index.php?pk=32361&T=1

[TABLE]
[ROW][C]Autocorrelation Function[/C][/ROW]
[ROW][C]Time lag k[/C][C]ACF(k)[/C][C]T-STAT[/C][C]P-value[/C][/ROW]
[ROW][C]1[/C][C]-0.097429[/C][C]-0.675[/C][C]0.251454[/C][/ROW]
[ROW][C]2[/C][C]-0.167497[/C][C]-1.1605[/C][C]0.125802[/C][/ROW]
[ROW][C]3[/C][C]0.263236[/C][C]1.8238[/C][C]0.03721[/C][/ROW]
[ROW][C]4[/C][C]0.046526[/C][C]0.3223[/C][C]0.374296[/C][/ROW]
[ROW][C]5[/C][C]-0.010402[/C][C]-0.0721[/C][C]0.471423[/C][/ROW]
[ROW][C]6[/C][C]-0.028847[/C][C]-0.1999[/C][C]0.421218[/C][/ROW]
[ROW][C]7[/C][C]-0.257074[/C][C]-1.7811[/C][C]0.040615[/C][/ROW]
[ROW][C]8[/C][C]-0.069918[/C][C]-0.4844[/C][C]0.31515[/C][/ROW]
[ROW][C]9[/C][C]0.155249[/C][C]1.0756[/C][C]0.143742[/C][/ROW]
[ROW][C]10[/C][C]-0.232097[/C][C]-1.608[/C][C]0.057195[/C][/ROW]
[ROW][C]11[/C][C]-0.260832[/C][C]-1.8071[/C][C]0.038509[/C][/ROW]
[ROW][C]12[/C][C]0.020326[/C][C]0.1408[/C][C]0.444299[/C][/ROW]
[ROW][C]13[/C][C]-0.020082[/C][C]-0.1391[/C][C]0.444965[/C][/ROW]
[ROW][C]14[/C][C]0.188115[/C][C]1.3033[/C][C]0.099345[/C][/ROW]
[ROW][C]15[/C][C]-0.151527[/C][C]-1.0498[/C][C]0.149532[/C][/ROW]
[ROW][C]16[/C][C]-0.154447[/C][C]-1.07[/C][C]0.144976[/C][/ROW]
[ROW][C]17[/C][C]0.286301[/C][C]1.9836[/C][C]0.026521[/C][/ROW]
[ROW][C]18[/C][C]0.068094[/C][C]0.4718[/C][C]0.319615[/C][/ROW]
[ROW][C]19[/C][C]-0.035178[/C][C]-0.2437[/C][C]0.404243[/C][/ROW]
[ROW][C]20[/C][C]0.081426[/C][C]0.5641[/C][C]0.287643[/C][/ROW]
[ROW][C]21[/C][C]0.104611[/C][C]0.7248[/C][C]0.236057[/C][/ROW]
[ROW][C]22[/C][C]-0.042222[/C][C]-0.2925[/C][C]0.385575[/C][/ROW]
[ROW][C]23[/C][C]0.17988[/C][C]1.2462[/C][C]0.109361[/C][/ROW]
[ROW][C]24[/C][C]-0.174291[/C][C]-1.2075[/C][C]0.116574[/C][/ROW]
[ROW][C]25[/C][C]-0.204292[/C][C]-1.4154[/C][C]0.081707[/C][/ROW]
[ROW][C]26[/C][C]0.183107[/C][C]1.2686[/C][C]0.105351[/C][/ROW]
[ROW][C]27[/C][C]-0.028551[/C][C]-0.1978[/C][C]0.422017[/C][/ROW]
[ROW][C]28[/C][C]-0.162232[/C][C]-1.124[/C][C]0.133307[/C][/ROW]
[ROW][C]29[/C][C]-0.020509[/C][C]-0.1421[/C][C]0.443802[/C][/ROW]
[ROW][C]30[/C][C]-0.0938[/C][C]-0.6499[/C][C]0.259439[/C][/ROW]
[ROW][C]31[/C][C]0.082731[/C][C]0.5732[/C][C]0.284601[/C][/ROW]
[ROW][C]32[/C][C]0.014038[/C][C]0.0973[/C][C]0.461464[/C][/ROW]
[ROW][C]33[/C][C]-0.139035[/C][C]-0.9633[/C][C]0.170122[/C][/ROW]
[ROW][C]34[/C][C]0.078927[/C][C]0.5468[/C][C]0.293517[/C][/ROW]
[ROW][C]35[/C][C]0.137549[/C][C]0.953[/C][C]0.172691[/C][/ROW]
[ROW][C]36[/C][C]-0.0861[/C][C]-0.5965[/C][C]0.276816[/C][/ROW]
[ROW][C]37[/C][C]-0.002658[/C][C]-0.0184[/C][C]0.492693[/C][/ROW]
[ROW][C]38[/C][C]0.027527[/C][C]0.1907[/C][C]0.424777[/C][/ROW]
[ROW][C]39[/C][C]-0.059286[/C][C]-0.4107[/C][C]0.341543[/C][/ROW]
[ROW][C]40[/C][C]0.0863[/C][C]0.5979[/C][C]0.276358[/C][/ROW]
[ROW][C]41[/C][C]-0.007057[/C][C]-0.0489[/C][C]0.480605[/C][/ROW]
[ROW][C]42[/C][C]-0.097653[/C][C]-0.6766[/C][C]0.250967[/C][/ROW]
[ROW][C]43[/C][C]0.068002[/C][C]0.4711[/C][C]0.319841[/C][/ROW]
[ROW][C]44[/C][C]0.031341[/C][C]0.2171[/C][C]0.414512[/C][/ROW]
[ROW][C]45[/C][C]-0.054478[/C][C]-0.3774[/C][C]0.353757[/C][/ROW]
[ROW][C]46[/C][C]0.009494[/C][C]0.0658[/C][C]0.473915[/C][/ROW]
[ROW][C]47[/C][C]0.044713[/C][C]0.3098[/C][C]0.379034[/C][/ROW]
[ROW][C]48[/C][C]NA[/C][C]NA[/C][C]NA[/C][/ROW]
[/TABLE]
Source: https://freestatistics.org/blog/index.php?pk=32361&T=1

Globally Unique Identifier (entire table): ba.freestatistics.org/blog/index.php?pk=32361&T=1

As an alternative you can also use a QR Code:  

The GUIDs for individual cells are displayed in the table below:

Autocorrelation Function
Time lag kACF(k)T-STATP-value
1-0.097429-0.6750.251454
2-0.167497-1.16050.125802
30.2632361.82380.03721
40.0465260.32230.374296
5-0.010402-0.07210.471423
6-0.028847-0.19990.421218
7-0.257074-1.78110.040615
8-0.069918-0.48440.31515
90.1552491.07560.143742
10-0.232097-1.6080.057195
11-0.260832-1.80710.038509
120.0203260.14080.444299
13-0.020082-0.13910.444965
140.1881151.30330.099345
15-0.151527-1.04980.149532
16-0.154447-1.070.144976
170.2863011.98360.026521
180.0680940.47180.319615
19-0.035178-0.24370.404243
200.0814260.56410.287643
210.1046110.72480.236057
22-0.042222-0.29250.385575
230.179881.24620.109361
24-0.174291-1.20750.116574
25-0.204292-1.41540.081707
260.1831071.26860.105351
27-0.028551-0.19780.422017
28-0.162232-1.1240.133307
29-0.020509-0.14210.443802
30-0.0938-0.64990.259439
310.0827310.57320.284601
320.0140380.09730.461464
33-0.139035-0.96330.170122
340.0789270.54680.293517
350.1375490.9530.172691
36-0.0861-0.59650.276816
37-0.002658-0.01840.492693
380.0275270.19070.424777
39-0.059286-0.41070.341543
400.08630.59790.276358
41-0.007057-0.04890.480605
42-0.097653-0.67660.250967
430.0680020.47110.319841
440.0313410.21710.414512
45-0.054478-0.37740.353757
460.0094940.06580.473915
470.0447130.30980.379034
48NANANA


Partial Autocorrelation Function
Time lag kPACF(k)T-STATP-value
1-0.097429-0.6750.251454
2-0.178686-1.2380.110874
30.2363081.63720.054066
40.0698970.48430.315202
50.0866790.60050.275489
6-0.075621-0.52390.301375
7-0.320811-2.22260.015493
8-0.204626-1.41770.08137
90.0877060.60760.273145
10-0.077258-0.53530.297472
11-0.186861-1.29460.100824
12-0.162937-1.12890.132283
13-0.10672-0.73940.231639
140.298322.06680.022084
15-0.061896-0.42880.334983
16-0.148811-1.0310.153855
17-0.024628-0.17060.432618
18-0.084288-0.5840.280988
190.1175280.81430.209759
200.1176420.8150.209536
210.1232050.85360.198786
22-0.229152-1.58760.05947
23-0.031-0.21480.415427
24-0.120102-0.83210.20474
25-0.02177-0.15080.440373
260.014740.10210.459544
270.0306890.21260.416262
28-0.037278-0.25830.398651
29-0.02237-0.1550.438741
30-0.088206-0.61110.272005
310.0661390.45820.324431
320.0082060.05690.477449
33-0.096234-0.66670.25407
340.0421730.29220.385703
35-0.058726-0.40690.342958
36-0.061048-0.4230.337109
37-0.114252-0.79160.216256
38-0.010795-0.07480.470345
39-0.000807-0.00560.497781
40-0.154607-1.07120.144729
41-0.065335-0.45270.326418
420.0200510.13890.445049
430.0605430.41950.338377
440.0205760.14260.44362
450.0253440.17560.430677
46-0.104462-0.72370.23637
470.0083380.05780.477086
48NANANA

\begin{tabular}{lllllllll}
\hline
Partial Autocorrelation Function \tabularnewline
Time lag k & PACF(k) & T-STAT & P-value \tabularnewline
1 & -0.097429 & -0.675 & 0.251454 \tabularnewline
2 & -0.178686 & -1.238 & 0.110874 \tabularnewline
3 & 0.236308 & 1.6372 & 0.054066 \tabularnewline
4 & 0.069897 & 0.4843 & 0.315202 \tabularnewline
5 & 0.086679 & 0.6005 & 0.275489 \tabularnewline
6 & -0.075621 & -0.5239 & 0.301375 \tabularnewline
7 & -0.320811 & -2.2226 & 0.015493 \tabularnewline
8 & -0.204626 & -1.4177 & 0.08137 \tabularnewline
9 & 0.087706 & 0.6076 & 0.273145 \tabularnewline
10 & -0.077258 & -0.5353 & 0.297472 \tabularnewline
11 & -0.186861 & -1.2946 & 0.100824 \tabularnewline
12 & -0.162937 & -1.1289 & 0.132283 \tabularnewline
13 & -0.10672 & -0.7394 & 0.231639 \tabularnewline
14 & 0.29832 & 2.0668 & 0.022084 \tabularnewline
15 & -0.061896 & -0.4288 & 0.334983 \tabularnewline
16 & -0.148811 & -1.031 & 0.153855 \tabularnewline
17 & -0.024628 & -0.1706 & 0.432618 \tabularnewline
18 & -0.084288 & -0.584 & 0.280988 \tabularnewline
19 & 0.117528 & 0.8143 & 0.209759 \tabularnewline
20 & 0.117642 & 0.815 & 0.209536 \tabularnewline
21 & 0.123205 & 0.8536 & 0.198786 \tabularnewline
22 & -0.229152 & -1.5876 & 0.05947 \tabularnewline
23 & -0.031 & -0.2148 & 0.415427 \tabularnewline
24 & -0.120102 & -0.8321 & 0.20474 \tabularnewline
25 & -0.02177 & -0.1508 & 0.440373 \tabularnewline
26 & 0.01474 & 0.1021 & 0.459544 \tabularnewline
27 & 0.030689 & 0.2126 & 0.416262 \tabularnewline
28 & -0.037278 & -0.2583 & 0.398651 \tabularnewline
29 & -0.02237 & -0.155 & 0.438741 \tabularnewline
30 & -0.088206 & -0.6111 & 0.272005 \tabularnewline
31 & 0.066139 & 0.4582 & 0.324431 \tabularnewline
32 & 0.008206 & 0.0569 & 0.477449 \tabularnewline
33 & -0.096234 & -0.6667 & 0.25407 \tabularnewline
34 & 0.042173 & 0.2922 & 0.385703 \tabularnewline
35 & -0.058726 & -0.4069 & 0.342958 \tabularnewline
36 & -0.061048 & -0.423 & 0.337109 \tabularnewline
37 & -0.114252 & -0.7916 & 0.216256 \tabularnewline
38 & -0.010795 & -0.0748 & 0.470345 \tabularnewline
39 & -0.000807 & -0.0056 & 0.497781 \tabularnewline
40 & -0.154607 & -1.0712 & 0.144729 \tabularnewline
41 & -0.065335 & -0.4527 & 0.326418 \tabularnewline
42 & 0.020051 & 0.1389 & 0.445049 \tabularnewline
43 & 0.060543 & 0.4195 & 0.338377 \tabularnewline
44 & 0.020576 & 0.1426 & 0.44362 \tabularnewline
45 & 0.025344 & 0.1756 & 0.430677 \tabularnewline
46 & -0.104462 & -0.7237 & 0.23637 \tabularnewline
47 & 0.008338 & 0.0578 & 0.477086 \tabularnewline
48 & NA & NA & NA \tabularnewline
\hline
\end{tabular}
%Source: https://freestatistics.org/blog/index.php?pk=32361&T=2

[TABLE]
[ROW][C]Partial Autocorrelation Function[/C][/ROW]
[ROW][C]Time lag k[/C][C]PACF(k)[/C][C]T-STAT[/C][C]P-value[/C][/ROW]
[ROW][C]1[/C][C]-0.097429[/C][C]-0.675[/C][C]0.251454[/C][/ROW]
[ROW][C]2[/C][C]-0.178686[/C][C]-1.238[/C][C]0.110874[/C][/ROW]
[ROW][C]3[/C][C]0.236308[/C][C]1.6372[/C][C]0.054066[/C][/ROW]
[ROW][C]4[/C][C]0.069897[/C][C]0.4843[/C][C]0.315202[/C][/ROW]
[ROW][C]5[/C][C]0.086679[/C][C]0.6005[/C][C]0.275489[/C][/ROW]
[ROW][C]6[/C][C]-0.075621[/C][C]-0.5239[/C][C]0.301375[/C][/ROW]
[ROW][C]7[/C][C]-0.320811[/C][C]-2.2226[/C][C]0.015493[/C][/ROW]
[ROW][C]8[/C][C]-0.204626[/C][C]-1.4177[/C][C]0.08137[/C][/ROW]
[ROW][C]9[/C][C]0.087706[/C][C]0.6076[/C][C]0.273145[/C][/ROW]
[ROW][C]10[/C][C]-0.077258[/C][C]-0.5353[/C][C]0.297472[/C][/ROW]
[ROW][C]11[/C][C]-0.186861[/C][C]-1.2946[/C][C]0.100824[/C][/ROW]
[ROW][C]12[/C][C]-0.162937[/C][C]-1.1289[/C][C]0.132283[/C][/ROW]
[ROW][C]13[/C][C]-0.10672[/C][C]-0.7394[/C][C]0.231639[/C][/ROW]
[ROW][C]14[/C][C]0.29832[/C][C]2.0668[/C][C]0.022084[/C][/ROW]
[ROW][C]15[/C][C]-0.061896[/C][C]-0.4288[/C][C]0.334983[/C][/ROW]
[ROW][C]16[/C][C]-0.148811[/C][C]-1.031[/C][C]0.153855[/C][/ROW]
[ROW][C]17[/C][C]-0.024628[/C][C]-0.1706[/C][C]0.432618[/C][/ROW]
[ROW][C]18[/C][C]-0.084288[/C][C]-0.584[/C][C]0.280988[/C][/ROW]
[ROW][C]19[/C][C]0.117528[/C][C]0.8143[/C][C]0.209759[/C][/ROW]
[ROW][C]20[/C][C]0.117642[/C][C]0.815[/C][C]0.209536[/C][/ROW]
[ROW][C]21[/C][C]0.123205[/C][C]0.8536[/C][C]0.198786[/C][/ROW]
[ROW][C]22[/C][C]-0.229152[/C][C]-1.5876[/C][C]0.05947[/C][/ROW]
[ROW][C]23[/C][C]-0.031[/C][C]-0.2148[/C][C]0.415427[/C][/ROW]
[ROW][C]24[/C][C]-0.120102[/C][C]-0.8321[/C][C]0.20474[/C][/ROW]
[ROW][C]25[/C][C]-0.02177[/C][C]-0.1508[/C][C]0.440373[/C][/ROW]
[ROW][C]26[/C][C]0.01474[/C][C]0.1021[/C][C]0.459544[/C][/ROW]
[ROW][C]27[/C][C]0.030689[/C][C]0.2126[/C][C]0.416262[/C][/ROW]
[ROW][C]28[/C][C]-0.037278[/C][C]-0.2583[/C][C]0.398651[/C][/ROW]
[ROW][C]29[/C][C]-0.02237[/C][C]-0.155[/C][C]0.438741[/C][/ROW]
[ROW][C]30[/C][C]-0.088206[/C][C]-0.6111[/C][C]0.272005[/C][/ROW]
[ROW][C]31[/C][C]0.066139[/C][C]0.4582[/C][C]0.324431[/C][/ROW]
[ROW][C]32[/C][C]0.008206[/C][C]0.0569[/C][C]0.477449[/C][/ROW]
[ROW][C]33[/C][C]-0.096234[/C][C]-0.6667[/C][C]0.25407[/C][/ROW]
[ROW][C]34[/C][C]0.042173[/C][C]0.2922[/C][C]0.385703[/C][/ROW]
[ROW][C]35[/C][C]-0.058726[/C][C]-0.4069[/C][C]0.342958[/C][/ROW]
[ROW][C]36[/C][C]-0.061048[/C][C]-0.423[/C][C]0.337109[/C][/ROW]
[ROW][C]37[/C][C]-0.114252[/C][C]-0.7916[/C][C]0.216256[/C][/ROW]
[ROW][C]38[/C][C]-0.010795[/C][C]-0.0748[/C][C]0.470345[/C][/ROW]
[ROW][C]39[/C][C]-0.000807[/C][C]-0.0056[/C][C]0.497781[/C][/ROW]
[ROW][C]40[/C][C]-0.154607[/C][C]-1.0712[/C][C]0.144729[/C][/ROW]
[ROW][C]41[/C][C]-0.065335[/C][C]-0.4527[/C][C]0.326418[/C][/ROW]
[ROW][C]42[/C][C]0.020051[/C][C]0.1389[/C][C]0.445049[/C][/ROW]
[ROW][C]43[/C][C]0.060543[/C][C]0.4195[/C][C]0.338377[/C][/ROW]
[ROW][C]44[/C][C]0.020576[/C][C]0.1426[/C][C]0.44362[/C][/ROW]
[ROW][C]45[/C][C]0.025344[/C][C]0.1756[/C][C]0.430677[/C][/ROW]
[ROW][C]46[/C][C]-0.104462[/C][C]-0.7237[/C][C]0.23637[/C][/ROW]
[ROW][C]47[/C][C]0.008338[/C][C]0.0578[/C][C]0.477086[/C][/ROW]
[ROW][C]48[/C][C]NA[/C][C]NA[/C][C]NA[/C][/ROW]
[/TABLE]
Source: https://freestatistics.org/blog/index.php?pk=32361&T=2

Globally Unique Identifier (entire table): ba.freestatistics.org/blog/index.php?pk=32361&T=2

As an alternative you can also use a QR Code:  

The GUIDs for individual cells are displayed in the table below:

Partial Autocorrelation Function
Time lag kPACF(k)T-STATP-value
1-0.097429-0.6750.251454
2-0.178686-1.2380.110874
30.2363081.63720.054066
40.0698970.48430.315202
50.0866790.60050.275489
6-0.075621-0.52390.301375
7-0.320811-2.22260.015493
8-0.204626-1.41770.08137
90.0877060.60760.273145
10-0.077258-0.53530.297472
11-0.186861-1.29460.100824
12-0.162937-1.12890.132283
13-0.10672-0.73940.231639
140.298322.06680.022084
15-0.061896-0.42880.334983
16-0.148811-1.0310.153855
17-0.024628-0.17060.432618
18-0.084288-0.5840.280988
190.1175280.81430.209759
200.1176420.8150.209536
210.1232050.85360.198786
22-0.229152-1.58760.05947
23-0.031-0.21480.415427
24-0.120102-0.83210.20474
25-0.02177-0.15080.440373
260.014740.10210.459544
270.0306890.21260.416262
28-0.037278-0.25830.398651
29-0.02237-0.1550.438741
30-0.088206-0.61110.272005
310.0661390.45820.324431
320.0082060.05690.477449
33-0.096234-0.66670.25407
340.0421730.29220.385703
35-0.058726-0.40690.342958
36-0.061048-0.4230.337109
37-0.114252-0.79160.216256
38-0.010795-0.07480.470345
39-0.000807-0.00560.497781
40-0.154607-1.07120.144729
41-0.065335-0.45270.326418
420.0200510.13890.445049
430.0605430.41950.338377
440.0205760.14260.44362
450.0253440.17560.430677
46-0.104462-0.72370.23637
470.0083380.05780.477086
48NANANA


Parameters (Session):
par1 = 48 ; par2 = 1 ; par3 = 0 ; par4 = 1 ; par5 = 12 ;
Parameters (R input):
par1 = 48 ; par2 = 1 ; par3 = 0 ; par4 = 1 ; par5 = 12 ;
R code (references can be found in the software module):
if (par1 == 'Default') {
par1 = 10*log10(length(x))
} else {
par1 <- as.numeric(par1)
}
par2 <- as.numeric(par2)
par3 <- as.numeric(par3)
par4 <- as.numeric(par4)
par5 <- as.numeric(par5)
if (par2 == 0) {
x <- log(x)
} else {
x <- (x ^ par2 - 1) / par2
}
if (par3 > 0) x <- diff(x,lag=1,difference=par3)
if (par4 > 0) x <- diff(x,lag=par5,difference=par4)
bitmap(file='pic1.png')
racf <- acf(x,par1,main='Autocorrelation',xlab='lags',ylab='ACF')
dev.off()
bitmap(file='pic2.png')
rpacf <- pacf(x,par1,main='Partial Autocorrelation',xlab='lags',ylab='PACF')
dev.off()
(myacf <- c(racf$acf))
(mypacf <- c(rpacf$acf))
lengthx <- length(x)
sqrtn <- sqrt(lengthx)
load(file='createtable')
a<-table.start()
a<-table.row.start(a)
a<-table.element(a,'Autocorrelation Function',4,TRUE)
a<-table.row.end(a)
a<-table.row.start(a)
a<-table.element(a,'Time lag k',header=TRUE)
a<-table.element(a,hyperlink('basics.htm','ACF(k)','click here for more information about the Autocorrelation Function'),header=TRUE)
a<-table.element(a,'T-STAT',header=TRUE)
a<-table.element(a,'P-value',header=TRUE)
a<-table.row.end(a)
for (i in 2:(par1+1)) {
a<-table.row.start(a)
a<-table.element(a,i-1,header=TRUE)
a<-table.element(a,round(myacf[i],6))
mytstat <- myacf[i]*sqrtn
a<-table.element(a,round(mytstat,4))
a<-table.element(a,round(1-pt(abs(mytstat),lengthx),6))
a<-table.row.end(a)
}
a<-table.end(a)
table.save(a,file='mytable.tab')
a<-table.start()
a<-table.row.start(a)
a<-table.element(a,'Partial Autocorrelation Function',4,TRUE)
a<-table.row.end(a)
a<-table.row.start(a)
a<-table.element(a,'Time lag k',header=TRUE)
a<-table.element(a,hyperlink('basics.htm','PACF(k)','click here for more information about the Partial Autocorrelation Function'),header=TRUE)
a<-table.element(a,'T-STAT',header=TRUE)
a<-table.element(a,'P-value',header=TRUE)
a<-table.row.end(a)
for (i in 1:par1) {
a<-table.row.start(a)
a<-table.element(a,i,header=TRUE)
a<-table.element(a,round(mypacf[i],6))
mytstat <- mypacf[i]*sqrtn
a<-table.element(a,round(mytstat,4))
a<-table.element(a,round(1-pt(abs(mytstat),lengthx),6))
a<-table.row.end(a)
}
a<-table.end(a)
table.save(a,file='mytable1.tab')