Free Statistics

of Irreproducible Research!

Author's title

Author*Unverified author*
R Software Modulerwasp_autocorrelation.wasp
Title produced by software(Partial) Autocorrelation Function
Date of computationWed, 10 Dec 2008 11:56:25 -0700
Cite this page as followsStatistical Computations at FreeStatistics.org, Office for Research Development and Education, URL https://freestatistics.org/blog/index.php?v=date/2008/Dec/10/t12289355030ycjbdgz9kvrkmd.htm/, Retrieved Wed, 15 May 2024 14:25:41 +0000
Statistical Computations at FreeStatistics.org, Office for Research Development and Education, URL https://freestatistics.org/blog/index.php?pk=32076, Retrieved Wed, 15 May 2024 14:25:41 +0000
QR Codes:

Original text written by user:
IsPrivate?No (this computation is public)
User-defined keywords
Estimated Impact193
Family? (F = Feedback message, R = changed R code, M = changed R Module, P = changed Parameters, D = changed Data)
-       [(Partial) Autocorrelation Function] [autocorrelation d...] [2008-12-10 18:56:25] [d41d8cd98f00b204e9800998ecf8427e] [Current]
-  MPD    [(Partial) Autocorrelation Function] [(partial) autocor...] [2009-12-12 10:03:05] [960f506a46b790b06fab7ca57984a121]
Feedback Forum

Post a new message
Dataseries X:
3230.66
3361.13
3484.74
3411.13
3288.18
3280.37
3173.95
3165.26
3092.71
3053.05
3181.96
2999.93
3249.57
3210.52
3030.29
2803.47
2767.63
2882.6
2863.36
2897.06
3012.61
3142.95
3032.93
3045.78
3110.52
3013.24
2987.1
2995.55
2833.18
2848.96
2794.83
2845.26
2915.02
2892.63
2604.42
2641.65
2659.81
2638.53
2720.25
2745.88
2735.7
2811.7
2799.43
2555.28
2304.98
2214.95
2065.81
1940.49
2042
1995.37
1946.81
1765.9
1635.25
1833.42
1910.43
1959.67
1969.6
2061.41
2093.48
2120.88
2174.56
2196.72
2350.44
2440.25
2408.64
2472.81
2407.6
2454.62
2448.05
2497.84
2645.64
2756.76
2849.27
2921.44
2981.85
3080.58
3106.22
3119.31
3061.26
3097.31
3161.69
3257.16
3277.01
3295.32
3363.99
3494.17
3667.03
3813.06
3917.96
3895.51
3801.06
3570.12
3701.61
3862.27
3970.1
4138.52
4199.75
4290.89
4443.91
4502.64
4356.98
4591.27
4696.96
4621.4
4562.84
4202.52
4296.49
4435.23
4105.18
4116.68
3844.49
3720.98
3674.4
3857.62
3801.06
3504.37
3032.6
3047.03
2962.34
2197.82
2014.45


Summary of computational transaction
Raw Inputview raw input (R code)
Raw Outputview raw output of R engine
Computing time2 seconds
R Server'Sir Ronald Aylmer Fisher' @ 193.190.124.24

\begin{tabular}{lllllllll}
\hline
Summary of computational transaction \tabularnewline
Raw Input & view raw input (R code)  \tabularnewline
Raw Output & view raw output of R engine  \tabularnewline
Computing time & 2 seconds \tabularnewline
R Server & 'Sir Ronald Aylmer Fisher' @ 193.190.124.24 \tabularnewline
\hline
\end{tabular}
%Source: https://freestatistics.org/blog/index.php?pk=32076&T=0

[TABLE]
[ROW][C]Summary of computational transaction[/C][/ROW]
[ROW][C]Raw Input[/C][C]view raw input (R code) [/C][/ROW]
[ROW][C]Raw Output[/C][C]view raw output of R engine [/C][/ROW]
[ROW][C]Computing time[/C][C]2 seconds[/C][/ROW]
[ROW][C]R Server[/C][C]'Sir Ronald Aylmer Fisher' @ 193.190.124.24[/C][/ROW]
[/TABLE]
Source: https://freestatistics.org/blog/index.php?pk=32076&T=0

Globally Unique Identifier (entire table): ba.freestatistics.org/blog/index.php?pk=32076&T=0

As an alternative you can also use a QR Code:  

The GUIDs for individual cells are displayed in the table below:

Summary of computational transaction
Raw Inputview raw input (R code)
Raw Outputview raw output of R engine
Computing time2 seconds
R Server'Sir Ronald Aylmer Fisher' @ 193.190.124.24


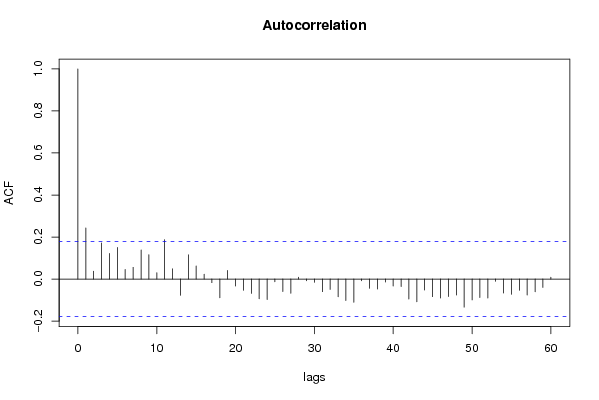
Autocorrelation Function
Time lag kACF(k)T-STATP-value
10.2431632.66370.004395
20.0370490.40590.342787
30.1721441.88570.030873
40.121991.33630.091984
50.1505561.64930.050856
60.0451930.49510.31073
70.0556480.60960.271643
80.1380361.51210.066568
90.1157731.26820.103585
100.0304170.33320.36978
110.1870042.04850.021345
120.0485120.53140.298054
13-0.076754-0.84080.201068
140.1151581.26150.104789
150.0621510.68080.248647
160.0225950.24750.402468
17-0.017242-0.18890.425256
18-0.088721-0.97190.166531
190.0412370.45170.326141
20-0.032996-0.36140.3592
21-0.053783-0.58920.27843
22-0.068239-0.74750.228104
23-0.093416-1.02330.154109
24-0.097248-1.06530.144439
25-0.012682-0.13890.44487
26-0.059494-0.65170.257913
27-0.067954-0.74440.229046
280.0088430.09690.461495
29-0.008421-0.09220.463327
30-0.015091-0.16530.434488
31-0.059843-0.65550.256685
32-0.049325-0.54030.294987
33-0.084255-0.9230.178937
34-0.101879-1.1160.133319
35-0.110808-1.21380.113597
36-0.007813-0.08560.46597
37-0.043571-0.47730.317011
38-0.047172-0.51670.303142
39-0.014266-0.15630.43804
40-0.033435-0.36630.357409
41-0.035642-0.39040.348452
42-0.094896-1.03950.150324
43-0.107793-1.18080.120006
44-0.051907-0.56860.285339
45-0.083742-0.91730.1804
46-0.089864-0.98440.163447
47-0.083196-0.91140.181964
48-0.075946-0.83190.203547
49-0.133796-1.46570.072678
50-0.099271-1.08750.139507
51-0.087462-0.95810.16997
52-0.090707-0.99360.161198
53-0.010666-0.11680.45359
54-0.066265-0.72590.234656
55-0.072226-0.79120.215196
56-0.053843-0.58980.278212
57-0.075695-0.82920.20432
58-0.060463-0.66230.254511
59-0.03985-0.43650.331615
600.0088880.09740.461298

\begin{tabular}{lllllllll}
\hline
Autocorrelation Function \tabularnewline
Time lag k & ACF(k) & T-STAT & P-value \tabularnewline
1 & 0.243163 & 2.6637 & 0.004395 \tabularnewline
2 & 0.037049 & 0.4059 & 0.342787 \tabularnewline
3 & 0.172144 & 1.8857 & 0.030873 \tabularnewline
4 & 0.12199 & 1.3363 & 0.091984 \tabularnewline
5 & 0.150556 & 1.6493 & 0.050856 \tabularnewline
6 & 0.045193 & 0.4951 & 0.31073 \tabularnewline
7 & 0.055648 & 0.6096 & 0.271643 \tabularnewline
8 & 0.138036 & 1.5121 & 0.066568 \tabularnewline
9 & 0.115773 & 1.2682 & 0.103585 \tabularnewline
10 & 0.030417 & 0.3332 & 0.36978 \tabularnewline
11 & 0.187004 & 2.0485 & 0.021345 \tabularnewline
12 & 0.048512 & 0.5314 & 0.298054 \tabularnewline
13 & -0.076754 & -0.8408 & 0.201068 \tabularnewline
14 & 0.115158 & 1.2615 & 0.104789 \tabularnewline
15 & 0.062151 & 0.6808 & 0.248647 \tabularnewline
16 & 0.022595 & 0.2475 & 0.402468 \tabularnewline
17 & -0.017242 & -0.1889 & 0.425256 \tabularnewline
18 & -0.088721 & -0.9719 & 0.166531 \tabularnewline
19 & 0.041237 & 0.4517 & 0.326141 \tabularnewline
20 & -0.032996 & -0.3614 & 0.3592 \tabularnewline
21 & -0.053783 & -0.5892 & 0.27843 \tabularnewline
22 & -0.068239 & -0.7475 & 0.228104 \tabularnewline
23 & -0.093416 & -1.0233 & 0.154109 \tabularnewline
24 & -0.097248 & -1.0653 & 0.144439 \tabularnewline
25 & -0.012682 & -0.1389 & 0.44487 \tabularnewline
26 & -0.059494 & -0.6517 & 0.257913 \tabularnewline
27 & -0.067954 & -0.7444 & 0.229046 \tabularnewline
28 & 0.008843 & 0.0969 & 0.461495 \tabularnewline
29 & -0.008421 & -0.0922 & 0.463327 \tabularnewline
30 & -0.015091 & -0.1653 & 0.434488 \tabularnewline
31 & -0.059843 & -0.6555 & 0.256685 \tabularnewline
32 & -0.049325 & -0.5403 & 0.294987 \tabularnewline
33 & -0.084255 & -0.923 & 0.178937 \tabularnewline
34 & -0.101879 & -1.116 & 0.133319 \tabularnewline
35 & -0.110808 & -1.2138 & 0.113597 \tabularnewline
36 & -0.007813 & -0.0856 & 0.46597 \tabularnewline
37 & -0.043571 & -0.4773 & 0.317011 \tabularnewline
38 & -0.047172 & -0.5167 & 0.303142 \tabularnewline
39 & -0.014266 & -0.1563 & 0.43804 \tabularnewline
40 & -0.033435 & -0.3663 & 0.357409 \tabularnewline
41 & -0.035642 & -0.3904 & 0.348452 \tabularnewline
42 & -0.094896 & -1.0395 & 0.150324 \tabularnewline
43 & -0.107793 & -1.1808 & 0.120006 \tabularnewline
44 & -0.051907 & -0.5686 & 0.285339 \tabularnewline
45 & -0.083742 & -0.9173 & 0.1804 \tabularnewline
46 & -0.089864 & -0.9844 & 0.163447 \tabularnewline
47 & -0.083196 & -0.9114 & 0.181964 \tabularnewline
48 & -0.075946 & -0.8319 & 0.203547 \tabularnewline
49 & -0.133796 & -1.4657 & 0.072678 \tabularnewline
50 & -0.099271 & -1.0875 & 0.139507 \tabularnewline
51 & -0.087462 & -0.9581 & 0.16997 \tabularnewline
52 & -0.090707 & -0.9936 & 0.161198 \tabularnewline
53 & -0.010666 & -0.1168 & 0.45359 \tabularnewline
54 & -0.066265 & -0.7259 & 0.234656 \tabularnewline
55 & -0.072226 & -0.7912 & 0.215196 \tabularnewline
56 & -0.053843 & -0.5898 & 0.278212 \tabularnewline
57 & -0.075695 & -0.8292 & 0.20432 \tabularnewline
58 & -0.060463 & -0.6623 & 0.254511 \tabularnewline
59 & -0.03985 & -0.4365 & 0.331615 \tabularnewline
60 & 0.008888 & 0.0974 & 0.461298 \tabularnewline
\hline
\end{tabular}
%Source: https://freestatistics.org/blog/index.php?pk=32076&T=1

[TABLE]
[ROW][C]Autocorrelation Function[/C][/ROW]
[ROW][C]Time lag k[/C][C]ACF(k)[/C][C]T-STAT[/C][C]P-value[/C][/ROW]
[ROW][C]1[/C][C]0.243163[/C][C]2.6637[/C][C]0.004395[/C][/ROW]
[ROW][C]2[/C][C]0.037049[/C][C]0.4059[/C][C]0.342787[/C][/ROW]
[ROW][C]3[/C][C]0.172144[/C][C]1.8857[/C][C]0.030873[/C][/ROW]
[ROW][C]4[/C][C]0.12199[/C][C]1.3363[/C][C]0.091984[/C][/ROW]
[ROW][C]5[/C][C]0.150556[/C][C]1.6493[/C][C]0.050856[/C][/ROW]
[ROW][C]6[/C][C]0.045193[/C][C]0.4951[/C][C]0.31073[/C][/ROW]
[ROW][C]7[/C][C]0.055648[/C][C]0.6096[/C][C]0.271643[/C][/ROW]
[ROW][C]8[/C][C]0.138036[/C][C]1.5121[/C][C]0.066568[/C][/ROW]
[ROW][C]9[/C][C]0.115773[/C][C]1.2682[/C][C]0.103585[/C][/ROW]
[ROW][C]10[/C][C]0.030417[/C][C]0.3332[/C][C]0.36978[/C][/ROW]
[ROW][C]11[/C][C]0.187004[/C][C]2.0485[/C][C]0.021345[/C][/ROW]
[ROW][C]12[/C][C]0.048512[/C][C]0.5314[/C][C]0.298054[/C][/ROW]
[ROW][C]13[/C][C]-0.076754[/C][C]-0.8408[/C][C]0.201068[/C][/ROW]
[ROW][C]14[/C][C]0.115158[/C][C]1.2615[/C][C]0.104789[/C][/ROW]
[ROW][C]15[/C][C]0.062151[/C][C]0.6808[/C][C]0.248647[/C][/ROW]
[ROW][C]16[/C][C]0.022595[/C][C]0.2475[/C][C]0.402468[/C][/ROW]
[ROW][C]17[/C][C]-0.017242[/C][C]-0.1889[/C][C]0.425256[/C][/ROW]
[ROW][C]18[/C][C]-0.088721[/C][C]-0.9719[/C][C]0.166531[/C][/ROW]
[ROW][C]19[/C][C]0.041237[/C][C]0.4517[/C][C]0.326141[/C][/ROW]
[ROW][C]20[/C][C]-0.032996[/C][C]-0.3614[/C][C]0.3592[/C][/ROW]
[ROW][C]21[/C][C]-0.053783[/C][C]-0.5892[/C][C]0.27843[/C][/ROW]
[ROW][C]22[/C][C]-0.068239[/C][C]-0.7475[/C][C]0.228104[/C][/ROW]
[ROW][C]23[/C][C]-0.093416[/C][C]-1.0233[/C][C]0.154109[/C][/ROW]
[ROW][C]24[/C][C]-0.097248[/C][C]-1.0653[/C][C]0.144439[/C][/ROW]
[ROW][C]25[/C][C]-0.012682[/C][C]-0.1389[/C][C]0.44487[/C][/ROW]
[ROW][C]26[/C][C]-0.059494[/C][C]-0.6517[/C][C]0.257913[/C][/ROW]
[ROW][C]27[/C][C]-0.067954[/C][C]-0.7444[/C][C]0.229046[/C][/ROW]
[ROW][C]28[/C][C]0.008843[/C][C]0.0969[/C][C]0.461495[/C][/ROW]
[ROW][C]29[/C][C]-0.008421[/C][C]-0.0922[/C][C]0.463327[/C][/ROW]
[ROW][C]30[/C][C]-0.015091[/C][C]-0.1653[/C][C]0.434488[/C][/ROW]
[ROW][C]31[/C][C]-0.059843[/C][C]-0.6555[/C][C]0.256685[/C][/ROW]
[ROW][C]32[/C][C]-0.049325[/C][C]-0.5403[/C][C]0.294987[/C][/ROW]
[ROW][C]33[/C][C]-0.084255[/C][C]-0.923[/C][C]0.178937[/C][/ROW]
[ROW][C]34[/C][C]-0.101879[/C][C]-1.116[/C][C]0.133319[/C][/ROW]
[ROW][C]35[/C][C]-0.110808[/C][C]-1.2138[/C][C]0.113597[/C][/ROW]
[ROW][C]36[/C][C]-0.007813[/C][C]-0.0856[/C][C]0.46597[/C][/ROW]
[ROW][C]37[/C][C]-0.043571[/C][C]-0.4773[/C][C]0.317011[/C][/ROW]
[ROW][C]38[/C][C]-0.047172[/C][C]-0.5167[/C][C]0.303142[/C][/ROW]
[ROW][C]39[/C][C]-0.014266[/C][C]-0.1563[/C][C]0.43804[/C][/ROW]
[ROW][C]40[/C][C]-0.033435[/C][C]-0.3663[/C][C]0.357409[/C][/ROW]
[ROW][C]41[/C][C]-0.035642[/C][C]-0.3904[/C][C]0.348452[/C][/ROW]
[ROW][C]42[/C][C]-0.094896[/C][C]-1.0395[/C][C]0.150324[/C][/ROW]
[ROW][C]43[/C][C]-0.107793[/C][C]-1.1808[/C][C]0.120006[/C][/ROW]
[ROW][C]44[/C][C]-0.051907[/C][C]-0.5686[/C][C]0.285339[/C][/ROW]
[ROW][C]45[/C][C]-0.083742[/C][C]-0.9173[/C][C]0.1804[/C][/ROW]
[ROW][C]46[/C][C]-0.089864[/C][C]-0.9844[/C][C]0.163447[/C][/ROW]
[ROW][C]47[/C][C]-0.083196[/C][C]-0.9114[/C][C]0.181964[/C][/ROW]
[ROW][C]48[/C][C]-0.075946[/C][C]-0.8319[/C][C]0.203547[/C][/ROW]
[ROW][C]49[/C][C]-0.133796[/C][C]-1.4657[/C][C]0.072678[/C][/ROW]
[ROW][C]50[/C][C]-0.099271[/C][C]-1.0875[/C][C]0.139507[/C][/ROW]
[ROW][C]51[/C][C]-0.087462[/C][C]-0.9581[/C][C]0.16997[/C][/ROW]
[ROW][C]52[/C][C]-0.090707[/C][C]-0.9936[/C][C]0.161198[/C][/ROW]
[ROW][C]53[/C][C]-0.010666[/C][C]-0.1168[/C][C]0.45359[/C][/ROW]
[ROW][C]54[/C][C]-0.066265[/C][C]-0.7259[/C][C]0.234656[/C][/ROW]
[ROW][C]55[/C][C]-0.072226[/C][C]-0.7912[/C][C]0.215196[/C][/ROW]
[ROW][C]56[/C][C]-0.053843[/C][C]-0.5898[/C][C]0.278212[/C][/ROW]
[ROW][C]57[/C][C]-0.075695[/C][C]-0.8292[/C][C]0.20432[/C][/ROW]
[ROW][C]58[/C][C]-0.060463[/C][C]-0.6623[/C][C]0.254511[/C][/ROW]
[ROW][C]59[/C][C]-0.03985[/C][C]-0.4365[/C][C]0.331615[/C][/ROW]
[ROW][C]60[/C][C]0.008888[/C][C]0.0974[/C][C]0.461298[/C][/ROW]
[/TABLE]
Source: https://freestatistics.org/blog/index.php?pk=32076&T=1

Globally Unique Identifier (entire table): ba.freestatistics.org/blog/index.php?pk=32076&T=1

As an alternative you can also use a QR Code:  

The GUIDs for individual cells are displayed in the table below:

Autocorrelation Function
Time lag kACF(k)T-STATP-value
10.2431632.66370.004395
20.0370490.40590.342787
30.1721441.88570.030873
40.121991.33630.091984
50.1505561.64930.050856
60.0451930.49510.31073
70.0556480.60960.271643
80.1380361.51210.066568
90.1157731.26820.103585
100.0304170.33320.36978
110.1870042.04850.021345
120.0485120.53140.298054
13-0.076754-0.84080.201068
140.1151581.26150.104789
150.0621510.68080.248647
160.0225950.24750.402468
17-0.017242-0.18890.425256
18-0.088721-0.97190.166531
190.0412370.45170.326141
20-0.032996-0.36140.3592
21-0.053783-0.58920.27843
22-0.068239-0.74750.228104
23-0.093416-1.02330.154109
24-0.097248-1.06530.144439
25-0.012682-0.13890.44487
26-0.059494-0.65170.257913
27-0.067954-0.74440.229046
280.0088430.09690.461495
29-0.008421-0.09220.463327
30-0.015091-0.16530.434488
31-0.059843-0.65550.256685
32-0.049325-0.54030.294987
33-0.084255-0.9230.178937
34-0.101879-1.1160.133319
35-0.110808-1.21380.113597
36-0.007813-0.08560.46597
37-0.043571-0.47730.317011
38-0.047172-0.51670.303142
39-0.014266-0.15630.43804
40-0.033435-0.36630.357409
41-0.035642-0.39040.348452
42-0.094896-1.03950.150324
43-0.107793-1.18080.120006
44-0.051907-0.56860.285339
45-0.083742-0.91730.1804
46-0.089864-0.98440.163447
47-0.083196-0.91140.181964
48-0.075946-0.83190.203547
49-0.133796-1.46570.072678
50-0.099271-1.08750.139507
51-0.087462-0.95810.16997
52-0.090707-0.99360.161198
53-0.010666-0.11680.45359
54-0.066265-0.72590.234656
55-0.072226-0.79120.215196
56-0.053843-0.58980.278212
57-0.075695-0.82920.20432
58-0.060463-0.66230.254511
59-0.03985-0.43650.331615
600.0088880.09740.461298


Partial Autocorrelation Function
Time lag kPACF(k)T-STATP-value
10.2431632.66370.004395
2-0.023467-0.25710.398785
30.1793261.96440.025896
40.0410290.44950.326957
50.1272151.39360.083011
6-0.047251-0.51760.302843
70.0451180.49420.311019
80.0758040.83040.203983
90.0599860.65710.256183
10-0.032414-0.35510.361576
110.18161.98930.02447
12-0.094745-1.03790.150706
13-0.090135-0.98740.16272
140.0996951.09210.138487
15-0.009498-0.1040.458654
16-0.01205-0.1320.447602
17-0.045969-0.50360.307746
18-0.091901-1.00670.158047
190.0269160.29480.38431
20-0.084817-0.92910.177345
210.0330020.36150.359172
22-0.108582-1.18950.118303
23-0.055513-0.60810.27213
24-0.043272-0.4740.318175
250.0308110.33750.368157
26-0.055031-0.60280.273877
270.0442220.48440.314483
280.0338860.37120.355571
290.0589820.64610.25972
30-0.033402-0.36590.357542
31-0.004806-0.05260.479051
320.0161520.17690.429927
33-0.083356-0.91310.181506
34-0.027334-0.29940.382565
35-0.068451-0.74980.227409
360.0474540.51980.30207
37-0.028475-0.31190.377818
380.0379070.41530.339348
39-0.01539-0.16860.433202
40-0.023285-0.25510.399549
41-0.015995-0.17520.430602
42-0.062418-0.68380.247725
43-0.07711-0.84470.199979
44-0.014118-0.15470.438676
45-0.048174-0.52770.299335
46-0.029073-0.31850.375338
47-0.061297-0.67150.251604
48-0.017108-0.18740.425827
49-0.09522-1.04310.149503
50-0.014349-0.15720.437681
51-0.041329-0.45270.325777
52-0.002712-0.02970.488176
530.0444420.48680.313631
540.011910.13050.448206
55-0.062312-0.68260.248089
560.0074060.08110.467738
57-0.058952-0.64580.259826
580.0013970.01530.493909
59-0.003958-0.04340.482742
600.0877680.96140.169131

\begin{tabular}{lllllllll}
\hline
Partial Autocorrelation Function \tabularnewline
Time lag k & PACF(k) & T-STAT & P-value \tabularnewline
1 & 0.243163 & 2.6637 & 0.004395 \tabularnewline
2 & -0.023467 & -0.2571 & 0.398785 \tabularnewline
3 & 0.179326 & 1.9644 & 0.025896 \tabularnewline
4 & 0.041029 & 0.4495 & 0.326957 \tabularnewline
5 & 0.127215 & 1.3936 & 0.083011 \tabularnewline
6 & -0.047251 & -0.5176 & 0.302843 \tabularnewline
7 & 0.045118 & 0.4942 & 0.311019 \tabularnewline
8 & 0.075804 & 0.8304 & 0.203983 \tabularnewline
9 & 0.059986 & 0.6571 & 0.256183 \tabularnewline
10 & -0.032414 & -0.3551 & 0.361576 \tabularnewline
11 & 0.1816 & 1.9893 & 0.02447 \tabularnewline
12 & -0.094745 & -1.0379 & 0.150706 \tabularnewline
13 & -0.090135 & -0.9874 & 0.16272 \tabularnewline
14 & 0.099695 & 1.0921 & 0.138487 \tabularnewline
15 & -0.009498 & -0.104 & 0.458654 \tabularnewline
16 & -0.01205 & -0.132 & 0.447602 \tabularnewline
17 & -0.045969 & -0.5036 & 0.307746 \tabularnewline
18 & -0.091901 & -1.0067 & 0.158047 \tabularnewline
19 & 0.026916 & 0.2948 & 0.38431 \tabularnewline
20 & -0.084817 & -0.9291 & 0.177345 \tabularnewline
21 & 0.033002 & 0.3615 & 0.359172 \tabularnewline
22 & -0.108582 & -1.1895 & 0.118303 \tabularnewline
23 & -0.055513 & -0.6081 & 0.27213 \tabularnewline
24 & -0.043272 & -0.474 & 0.318175 \tabularnewline
25 & 0.030811 & 0.3375 & 0.368157 \tabularnewline
26 & -0.055031 & -0.6028 & 0.273877 \tabularnewline
27 & 0.044222 & 0.4844 & 0.314483 \tabularnewline
28 & 0.033886 & 0.3712 & 0.355571 \tabularnewline
29 & 0.058982 & 0.6461 & 0.25972 \tabularnewline
30 & -0.033402 & -0.3659 & 0.357542 \tabularnewline
31 & -0.004806 & -0.0526 & 0.479051 \tabularnewline
32 & 0.016152 & 0.1769 & 0.429927 \tabularnewline
33 & -0.083356 & -0.9131 & 0.181506 \tabularnewline
34 & -0.027334 & -0.2994 & 0.382565 \tabularnewline
35 & -0.068451 & -0.7498 & 0.227409 \tabularnewline
36 & 0.047454 & 0.5198 & 0.30207 \tabularnewline
37 & -0.028475 & -0.3119 & 0.377818 \tabularnewline
38 & 0.037907 & 0.4153 & 0.339348 \tabularnewline
39 & -0.01539 & -0.1686 & 0.433202 \tabularnewline
40 & -0.023285 & -0.2551 & 0.399549 \tabularnewline
41 & -0.015995 & -0.1752 & 0.430602 \tabularnewline
42 & -0.062418 & -0.6838 & 0.247725 \tabularnewline
43 & -0.07711 & -0.8447 & 0.199979 \tabularnewline
44 & -0.014118 & -0.1547 & 0.438676 \tabularnewline
45 & -0.048174 & -0.5277 & 0.299335 \tabularnewline
46 & -0.029073 & -0.3185 & 0.375338 \tabularnewline
47 & -0.061297 & -0.6715 & 0.251604 \tabularnewline
48 & -0.017108 & -0.1874 & 0.425827 \tabularnewline
49 & -0.09522 & -1.0431 & 0.149503 \tabularnewline
50 & -0.014349 & -0.1572 & 0.437681 \tabularnewline
51 & -0.041329 & -0.4527 & 0.325777 \tabularnewline
52 & -0.002712 & -0.0297 & 0.488176 \tabularnewline
53 & 0.044442 & 0.4868 & 0.313631 \tabularnewline
54 & 0.01191 & 0.1305 & 0.448206 \tabularnewline
55 & -0.062312 & -0.6826 & 0.248089 \tabularnewline
56 & 0.007406 & 0.0811 & 0.467738 \tabularnewline
57 & -0.058952 & -0.6458 & 0.259826 \tabularnewline
58 & 0.001397 & 0.0153 & 0.493909 \tabularnewline
59 & -0.003958 & -0.0434 & 0.482742 \tabularnewline
60 & 0.087768 & 0.9614 & 0.169131 \tabularnewline
\hline
\end{tabular}
%Source: https://freestatistics.org/blog/index.php?pk=32076&T=2

[TABLE]
[ROW][C]Partial Autocorrelation Function[/C][/ROW]
[ROW][C]Time lag k[/C][C]PACF(k)[/C][C]T-STAT[/C][C]P-value[/C][/ROW]
[ROW][C]1[/C][C]0.243163[/C][C]2.6637[/C][C]0.004395[/C][/ROW]
[ROW][C]2[/C][C]-0.023467[/C][C]-0.2571[/C][C]0.398785[/C][/ROW]
[ROW][C]3[/C][C]0.179326[/C][C]1.9644[/C][C]0.025896[/C][/ROW]
[ROW][C]4[/C][C]0.041029[/C][C]0.4495[/C][C]0.326957[/C][/ROW]
[ROW][C]5[/C][C]0.127215[/C][C]1.3936[/C][C]0.083011[/C][/ROW]
[ROW][C]6[/C][C]-0.047251[/C][C]-0.5176[/C][C]0.302843[/C][/ROW]
[ROW][C]7[/C][C]0.045118[/C][C]0.4942[/C][C]0.311019[/C][/ROW]
[ROW][C]8[/C][C]0.075804[/C][C]0.8304[/C][C]0.203983[/C][/ROW]
[ROW][C]9[/C][C]0.059986[/C][C]0.6571[/C][C]0.256183[/C][/ROW]
[ROW][C]10[/C][C]-0.032414[/C][C]-0.3551[/C][C]0.361576[/C][/ROW]
[ROW][C]11[/C][C]0.1816[/C][C]1.9893[/C][C]0.02447[/C][/ROW]
[ROW][C]12[/C][C]-0.094745[/C][C]-1.0379[/C][C]0.150706[/C][/ROW]
[ROW][C]13[/C][C]-0.090135[/C][C]-0.9874[/C][C]0.16272[/C][/ROW]
[ROW][C]14[/C][C]0.099695[/C][C]1.0921[/C][C]0.138487[/C][/ROW]
[ROW][C]15[/C][C]-0.009498[/C][C]-0.104[/C][C]0.458654[/C][/ROW]
[ROW][C]16[/C][C]-0.01205[/C][C]-0.132[/C][C]0.447602[/C][/ROW]
[ROW][C]17[/C][C]-0.045969[/C][C]-0.5036[/C][C]0.307746[/C][/ROW]
[ROW][C]18[/C][C]-0.091901[/C][C]-1.0067[/C][C]0.158047[/C][/ROW]
[ROW][C]19[/C][C]0.026916[/C][C]0.2948[/C][C]0.38431[/C][/ROW]
[ROW][C]20[/C][C]-0.084817[/C][C]-0.9291[/C][C]0.177345[/C][/ROW]
[ROW][C]21[/C][C]0.033002[/C][C]0.3615[/C][C]0.359172[/C][/ROW]
[ROW][C]22[/C][C]-0.108582[/C][C]-1.1895[/C][C]0.118303[/C][/ROW]
[ROW][C]23[/C][C]-0.055513[/C][C]-0.6081[/C][C]0.27213[/C][/ROW]
[ROW][C]24[/C][C]-0.043272[/C][C]-0.474[/C][C]0.318175[/C][/ROW]
[ROW][C]25[/C][C]0.030811[/C][C]0.3375[/C][C]0.368157[/C][/ROW]
[ROW][C]26[/C][C]-0.055031[/C][C]-0.6028[/C][C]0.273877[/C][/ROW]
[ROW][C]27[/C][C]0.044222[/C][C]0.4844[/C][C]0.314483[/C][/ROW]
[ROW][C]28[/C][C]0.033886[/C][C]0.3712[/C][C]0.355571[/C][/ROW]
[ROW][C]29[/C][C]0.058982[/C][C]0.6461[/C][C]0.25972[/C][/ROW]
[ROW][C]30[/C][C]-0.033402[/C][C]-0.3659[/C][C]0.357542[/C][/ROW]
[ROW][C]31[/C][C]-0.004806[/C][C]-0.0526[/C][C]0.479051[/C][/ROW]
[ROW][C]32[/C][C]0.016152[/C][C]0.1769[/C][C]0.429927[/C][/ROW]
[ROW][C]33[/C][C]-0.083356[/C][C]-0.9131[/C][C]0.181506[/C][/ROW]
[ROW][C]34[/C][C]-0.027334[/C][C]-0.2994[/C][C]0.382565[/C][/ROW]
[ROW][C]35[/C][C]-0.068451[/C][C]-0.7498[/C][C]0.227409[/C][/ROW]
[ROW][C]36[/C][C]0.047454[/C][C]0.5198[/C][C]0.30207[/C][/ROW]
[ROW][C]37[/C][C]-0.028475[/C][C]-0.3119[/C][C]0.377818[/C][/ROW]
[ROW][C]38[/C][C]0.037907[/C][C]0.4153[/C][C]0.339348[/C][/ROW]
[ROW][C]39[/C][C]-0.01539[/C][C]-0.1686[/C][C]0.433202[/C][/ROW]
[ROW][C]40[/C][C]-0.023285[/C][C]-0.2551[/C][C]0.399549[/C][/ROW]
[ROW][C]41[/C][C]-0.015995[/C][C]-0.1752[/C][C]0.430602[/C][/ROW]
[ROW][C]42[/C][C]-0.062418[/C][C]-0.6838[/C][C]0.247725[/C][/ROW]
[ROW][C]43[/C][C]-0.07711[/C][C]-0.8447[/C][C]0.199979[/C][/ROW]
[ROW][C]44[/C][C]-0.014118[/C][C]-0.1547[/C][C]0.438676[/C][/ROW]
[ROW][C]45[/C][C]-0.048174[/C][C]-0.5277[/C][C]0.299335[/C][/ROW]
[ROW][C]46[/C][C]-0.029073[/C][C]-0.3185[/C][C]0.375338[/C][/ROW]
[ROW][C]47[/C][C]-0.061297[/C][C]-0.6715[/C][C]0.251604[/C][/ROW]
[ROW][C]48[/C][C]-0.017108[/C][C]-0.1874[/C][C]0.425827[/C][/ROW]
[ROW][C]49[/C][C]-0.09522[/C][C]-1.0431[/C][C]0.149503[/C][/ROW]
[ROW][C]50[/C][C]-0.014349[/C][C]-0.1572[/C][C]0.437681[/C][/ROW]
[ROW][C]51[/C][C]-0.041329[/C][C]-0.4527[/C][C]0.325777[/C][/ROW]
[ROW][C]52[/C][C]-0.002712[/C][C]-0.0297[/C][C]0.488176[/C][/ROW]
[ROW][C]53[/C][C]0.044442[/C][C]0.4868[/C][C]0.313631[/C][/ROW]
[ROW][C]54[/C][C]0.01191[/C][C]0.1305[/C][C]0.448206[/C][/ROW]
[ROW][C]55[/C][C]-0.062312[/C][C]-0.6826[/C][C]0.248089[/C][/ROW]
[ROW][C]56[/C][C]0.007406[/C][C]0.0811[/C][C]0.467738[/C][/ROW]
[ROW][C]57[/C][C]-0.058952[/C][C]-0.6458[/C][C]0.259826[/C][/ROW]
[ROW][C]58[/C][C]0.001397[/C][C]0.0153[/C][C]0.493909[/C][/ROW]
[ROW][C]59[/C][C]-0.003958[/C][C]-0.0434[/C][C]0.482742[/C][/ROW]
[ROW][C]60[/C][C]0.087768[/C][C]0.9614[/C][C]0.169131[/C][/ROW]
[/TABLE]
Source: https://freestatistics.org/blog/index.php?pk=32076&T=2

Globally Unique Identifier (entire table): ba.freestatistics.org/blog/index.php?pk=32076&T=2

As an alternative you can also use a QR Code:  

The GUIDs for individual cells are displayed in the table below:

Partial Autocorrelation Function
Time lag kPACF(k)T-STATP-value
10.2431632.66370.004395
2-0.023467-0.25710.398785
30.1793261.96440.025896
40.0410290.44950.326957
50.1272151.39360.083011
6-0.047251-0.51760.302843
70.0451180.49420.311019
80.0758040.83040.203983
90.0599860.65710.256183
10-0.032414-0.35510.361576
110.18161.98930.02447
12-0.094745-1.03790.150706
13-0.090135-0.98740.16272
140.0996951.09210.138487
15-0.009498-0.1040.458654
16-0.01205-0.1320.447602
17-0.045969-0.50360.307746
18-0.091901-1.00670.158047
190.0269160.29480.38431
20-0.084817-0.92910.177345
210.0330020.36150.359172
22-0.108582-1.18950.118303
23-0.055513-0.60810.27213
24-0.043272-0.4740.318175
250.0308110.33750.368157
26-0.055031-0.60280.273877
270.0442220.48440.314483
280.0338860.37120.355571
290.0589820.64610.25972
30-0.033402-0.36590.357542
31-0.004806-0.05260.479051
320.0161520.17690.429927
33-0.083356-0.91310.181506
34-0.027334-0.29940.382565
35-0.068451-0.74980.227409
360.0474540.51980.30207
37-0.028475-0.31190.377818
380.0379070.41530.339348
39-0.01539-0.16860.433202
40-0.023285-0.25510.399549
41-0.015995-0.17520.430602
42-0.062418-0.68380.247725
43-0.07711-0.84470.199979
44-0.014118-0.15470.438676
45-0.048174-0.52770.299335
46-0.029073-0.31850.375338
47-0.061297-0.67150.251604
48-0.017108-0.18740.425827
49-0.09522-1.04310.149503
50-0.014349-0.15720.437681
51-0.041329-0.45270.325777
52-0.002712-0.02970.488176
530.0444420.48680.313631
540.011910.13050.448206
55-0.062312-0.68260.248089
560.0074060.08110.467738
57-0.058952-0.64580.259826
580.0013970.01530.493909
59-0.003958-0.04340.482742
600.0877680.96140.169131


Parameters (Session):
par1 = 60 ; par2 = 1 ; par3 = 1 ; par4 = 0 ; par5 = 12 ;
Parameters (R input):
par1 = 60 ; par2 = 1 ; par3 = 1 ; par4 = 0 ; par5 = 12 ;
R code (references can be found in the software module):
if (par1 == 'Default') {
par1 = 10*log10(length(x))
} else {
par1 <- as.numeric(par1)
}
par2 <- as.numeric(par2)
par3 <- as.numeric(par3)
par4 <- as.numeric(par4)
par5 <- as.numeric(par5)
if (par2 == 0) {
x <- log(x)
} else {
x <- (x ^ par2 - 1) / par2
}
if (par3 > 0) x <- diff(x,lag=1,difference=par3)
if (par4 > 0) x <- diff(x,lag=par5,difference=par4)
bitmap(file='pic1.png')
racf <- acf(x,par1,main='Autocorrelation',xlab='lags',ylab='ACF')
dev.off()
bitmap(file='pic2.png')
rpacf <- pacf(x,par1,main='Partial Autocorrelation',xlab='lags',ylab='PACF')
dev.off()
(myacf <- c(racf$acf))
(mypacf <- c(rpacf$acf))
lengthx <- length(x)
sqrtn <- sqrt(lengthx)
load(file='createtable')
a<-table.start()
a<-table.row.start(a)
a<-table.element(a,'Autocorrelation Function',4,TRUE)
a<-table.row.end(a)
a<-table.row.start(a)
a<-table.element(a,'Time lag k',header=TRUE)
a<-table.element(a,hyperlink('basics.htm','ACF(k)','click here for more information about the Autocorrelation Function'),header=TRUE)
a<-table.element(a,'T-STAT',header=TRUE)
a<-table.element(a,'P-value',header=TRUE)
a<-table.row.end(a)
for (i in 2:(par1+1)) {
a<-table.row.start(a)
a<-table.element(a,i-1,header=TRUE)
a<-table.element(a,round(myacf[i],6))
mytstat <- myacf[i]*sqrtn
a<-table.element(a,round(mytstat,4))
a<-table.element(a,round(1-pt(abs(mytstat),lengthx),6))
a<-table.row.end(a)
}
a<-table.end(a)
table.save(a,file='mytable.tab')
a<-table.start()
a<-table.row.start(a)
a<-table.element(a,'Partial Autocorrelation Function',4,TRUE)
a<-table.row.end(a)
a<-table.row.start(a)
a<-table.element(a,'Time lag k',header=TRUE)
a<-table.element(a,hyperlink('basics.htm','PACF(k)','click here for more information about the Partial Autocorrelation Function'),header=TRUE)
a<-table.element(a,'T-STAT',header=TRUE)
a<-table.element(a,'P-value',header=TRUE)
a<-table.row.end(a)
for (i in 1:par1) {
a<-table.row.start(a)
a<-table.element(a,i,header=TRUE)
a<-table.element(a,round(mypacf[i],6))
mytstat <- mypacf[i]*sqrtn
a<-table.element(a,round(mytstat,4))
a<-table.element(a,round(1-pt(abs(mytstat),lengthx),6))
a<-table.row.end(a)
}
a<-table.end(a)
table.save(a,file='mytable1.tab')