Free Statistics

of Irreproducible Research!

Author's title

Author*Unverified author*
R Software Modulerwasp_arimaforecasting.wasp
Title produced by softwareARIMA Forecasting
Date of computationWed, 10 Dec 2008 09:51:29 -0700
Cite this page as followsStatistical Computations at FreeStatistics.org, Office for Research Development and Education, URL https://freestatistics.org/blog/index.php?v=date/2008/Dec/10/t1228927916tizkvkkwdzgbx5d.htm/, Retrieved Sun, 26 May 2024 07:22:22 +0000
Statistical Computations at FreeStatistics.org, Office for Research Development and Education, URL https://freestatistics.org/blog/index.php?pk=32031, Retrieved Sun, 26 May 2024 07:22:22 +0000
QR Codes:

Original text written by user:
IsPrivate?No (this computation is public)
User-defined keywordsjulie WS6
Estimated Impact171
Family? (F = Feedback message, R = changed R code, M = changed R Module, P = changed Parameters, D = changed Data)
F       [ARIMA Forecasting] [arima proces] [2008-12-10 16:51:29] [02bc582261bca489735616f51251e20c] [Current]
Feedback Forum
2008-12-17 21:18:47 [Julie Govaerts] [reply
step 1 -->
De 12 laatste maanden van de tijdreeks worden weggelaten. Er wordt een voorspelling gemaakt van die 12 laatste maanden aan de hand van de resterende (niet weggelaten) maanden. De voorspelling wordt dan vergeleken met de werkelijke waarden.
F(t) = forecast = een extrapolatie naar de toekomst toe gebaseerd op het verleden.
p –waarde = met als 0-hypothese dat de waarde uit de dataset en de voorspelde waarde niet significant van elkaar verschillen
De voorspelde waarden en de werkelijke waarden leunen dicht bij elkaar aan, dit wijst op een goed model.
2008-12-19 10:03:19 [Natalie De Wilde] [reply
Step 1: ok, je zegt wat er in de eerste tabel staat. De laatste 12 maanden van de tijdreeks worden weggelaten en de computer gaat daarvan de parameters bepalen.Er wordt een voorspelling gemaakt zonder rekening te houden de gegevens die zijn weggelaten.
De tweede tabel geeft de procentuele standaardfout weer van de voorspelde waarde tov de werkelijke waarde.
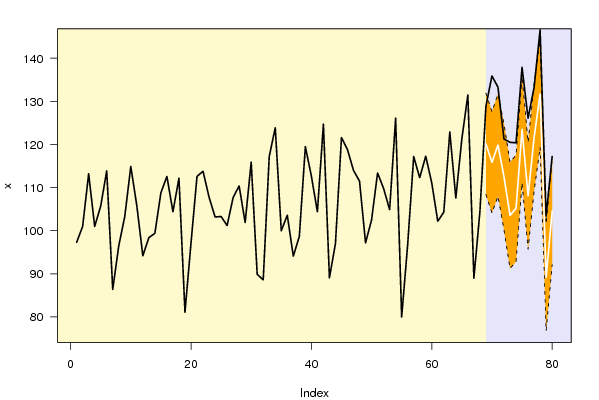
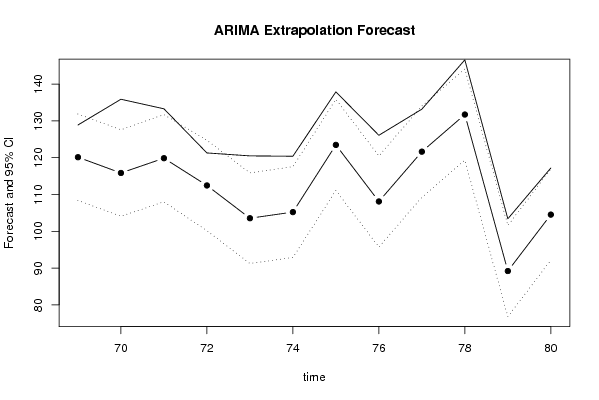
In de eerste grafiek worden in het grijze deel de 12 laatste maanden afgeknipt. In de tweede grafiek worden deze uitvergroot.
De stippellijnen geven het betrouwbaarheidsinterval weer. De volle lijn stelt de werkelijke waarden voor en de lijn met bolletjes stelt de voorspelling rond de laatste 12 maanden voor.
We zien in de grafiek dat de werkelijke waarden en de voorspelling dezelfde trend vertonen, de werkelijke waarden buiten het betrouwbaarheidsinterval liggen, de voorspelde waarden liggen erbinnen.
2008-12-19 10:05:10 [Natalie De Wilde] [reply
Step 2: goed. De bespreking van de grafiek heb ik al bij step 1 geschreven.
2008-12-19 10:07:22 [Natalie De Wilde] [reply
Step 3: zeer goede bespreking, ik heb hier geen verdere aanvullingen aan toe te voegen.
2008-12-19 10:08:07 [Natalie De Wilde] [reply
step 5: ok

Post a new message
Dataseries X:
97.3
101
113.2
101
105.7
113.9
86.4
96.5
103.3
114.9
105.8
94.2
98.4
99.4
108.8
112.6
104.4
112.2
81.1
97.1
112.6
113.8
107.8
103.2
103.3
101.2
107.7
110.4
101.9
115.9
89.9
88.6
117.2
123.9
100
103.6
94.1
98.7
119.5
112.7
104.4
124.7
89.1
97
121.6
118.8
114
111.5
97.2
102.5
113.4
109.8
104.9
126.1
80
96.8
117.2
112.3
117.3
111.1
102.2
104.3
122.9
107.6
121.3
131.5
89
104.4
128.9
135.9
133.3
121.3
120.5
120.4
137.9
126.1
133.2
146.6
103.4
117.2


Summary of computational transaction
Raw Inputview raw input (R code)
Raw Outputview raw output of R engine
Computing time2 seconds
R Server'George Udny Yule' @ 72.249.76.132

\begin{tabular}{lllllllll}
\hline
Summary of computational transaction \tabularnewline
Raw Input & view raw input (R code)  \tabularnewline
Raw Output & view raw output of R engine  \tabularnewline
Computing time & 2 seconds \tabularnewline
R Server & 'George Udny Yule' @ 72.249.76.132 \tabularnewline
\hline
\end{tabular}
%Source: https://freestatistics.org/blog/index.php?pk=32031&T=0

[TABLE]
[ROW][C]Summary of computational transaction[/C][/ROW]
[ROW][C]Raw Input[/C][C]view raw input (R code) [/C][/ROW]
[ROW][C]Raw Output[/C][C]view raw output of R engine [/C][/ROW]
[ROW][C]Computing time[/C][C]2 seconds[/C][/ROW]
[ROW][C]R Server[/C][C]'George Udny Yule' @ 72.249.76.132[/C][/ROW]
[/TABLE]
Source: https://freestatistics.org/blog/index.php?pk=32031&T=0

Globally Unique Identifier (entire table): ba.freestatistics.org/blog/index.php?pk=32031&T=0

As an alternative you can also use a QR Code:  

The GUIDs for individual cells are displayed in the table below:

Summary of computational transaction
Raw Inputview raw input (R code)
Raw Outputview raw output of R engine
Computing time2 seconds
R Server'George Udny Yule' @ 72.249.76.132


Univariate ARIMA Extrapolation Forecast
timeY[t]F[t]95% LB95% UBp-value(H0: Y[t] = F[t])P(F[t]>Y[t-1])P(F[t]>Y[t-s])P(F[t]>Y[68])
5696.8-------
57117.2-------
58112.3-------
59117.3-------
60111.1-------
61102.2-------
62104.3-------
63122.9-------
64107.6-------
65121.3-------
66131.5-------
6789-------
68104.4-------
69128.9120.1393108.3943131.88430.07190.99570.68810.9957
70135.9115.854104.1015127.60644e-040.01480.72330.9719
71133.3119.8699108.0091131.73070.01320.0040.66450.9947
72121.3112.4626100.1576124.76770.07965e-040.58590.9005
73120.5103.552491.2393115.86550.00350.00240.58520.4463
74120.4105.224192.879117.56920.0080.00760.55830.5521
75137.9123.4824111.0989135.86580.01120.68720.53670.9987
76126.1108.109695.7231120.49620.002200.53210.7214
77133.2121.6456109.2533134.0380.03380.24060.52180.9968
78146.6131.7379119.3416144.13420.00940.40860.5151
79103.489.192476.7953101.58940.012300.51210.0081
80117.2104.53292.1341116.930.02260.5710.50830.5083

\begin{tabular}{lllllllll}
\hline
Univariate ARIMA Extrapolation Forecast \tabularnewline
time & Y[t] & F[t] & 95% LB & 95% UB & p-value(H0: Y[t] = F[t]) & P(F[t]>Y[t-1]) & P(F[t]>Y[t-s]) & P(F[t]>Y[68]) \tabularnewline
56 & 96.8 & - & - & - & - & - & - & - \tabularnewline
57 & 117.2 & - & - & - & - & - & - & - \tabularnewline
58 & 112.3 & - & - & - & - & - & - & - \tabularnewline
59 & 117.3 & - & - & - & - & - & - & - \tabularnewline
60 & 111.1 & - & - & - & - & - & - & - \tabularnewline
61 & 102.2 & - & - & - & - & - & - & - \tabularnewline
62 & 104.3 & - & - & - & - & - & - & - \tabularnewline
63 & 122.9 & - & - & - & - & - & - & - \tabularnewline
64 & 107.6 & - & - & - & - & - & - & - \tabularnewline
65 & 121.3 & - & - & - & - & - & - & - \tabularnewline
66 & 131.5 & - & - & - & - & - & - & - \tabularnewline
67 & 89 & - & - & - & - & - & - & - \tabularnewline
68 & 104.4 & - & - & - & - & - & - & - \tabularnewline
69 & 128.9 & 120.1393 & 108.3943 & 131.8843 & 0.0719 & 0.9957 & 0.6881 & 0.9957 \tabularnewline
70 & 135.9 & 115.854 & 104.1015 & 127.6064 & 4e-04 & 0.0148 & 0.7233 & 0.9719 \tabularnewline
71 & 133.3 & 119.8699 & 108.0091 & 131.7307 & 0.0132 & 0.004 & 0.6645 & 0.9947 \tabularnewline
72 & 121.3 & 112.4626 & 100.1576 & 124.7677 & 0.0796 & 5e-04 & 0.5859 & 0.9005 \tabularnewline
73 & 120.5 & 103.5524 & 91.2393 & 115.8655 & 0.0035 & 0.0024 & 0.5852 & 0.4463 \tabularnewline
74 & 120.4 & 105.2241 & 92.879 & 117.5692 & 0.008 & 0.0076 & 0.5583 & 0.5521 \tabularnewline
75 & 137.9 & 123.4824 & 111.0989 & 135.8658 & 0.0112 & 0.6872 & 0.5367 & 0.9987 \tabularnewline
76 & 126.1 & 108.1096 & 95.7231 & 120.4962 & 0.0022 & 0 & 0.5321 & 0.7214 \tabularnewline
77 & 133.2 & 121.6456 & 109.2533 & 134.038 & 0.0338 & 0.2406 & 0.5218 & 0.9968 \tabularnewline
78 & 146.6 & 131.7379 & 119.3416 & 144.1342 & 0.0094 & 0.4086 & 0.515 & 1 \tabularnewline
79 & 103.4 & 89.1924 & 76.7953 & 101.5894 & 0.0123 & 0 & 0.5121 & 0.0081 \tabularnewline
80 & 117.2 & 104.532 & 92.1341 & 116.93 & 0.0226 & 0.571 & 0.5083 & 0.5083 \tabularnewline
\hline
\end{tabular}
%Source: https://freestatistics.org/blog/index.php?pk=32031&T=1

[TABLE]
[ROW][C]Univariate ARIMA Extrapolation Forecast[/C][/ROW]
[ROW][C]time[/C][C]Y[t][/C][C]F[t][/C][C]95% LB[/C][C]95% UB[/C][C]p-value(H0: Y[t] = F[t])[/C][C]P(F[t]>Y[t-1])[/C][C]P(F[t]>Y[t-s])[/C][C]P(F[t]>Y[68])[/C][/ROW]
[ROW][C]56[/C][C]96.8[/C][C]-[/C][C]-[/C][C]-[/C][C]-[/C][C]-[/C][C]-[/C][C]-[/C][/ROW]
[ROW][C]57[/C][C]117.2[/C][C]-[/C][C]-[/C][C]-[/C][C]-[/C][C]-[/C][C]-[/C][C]-[/C][/ROW]
[ROW][C]58[/C][C]112.3[/C][C]-[/C][C]-[/C][C]-[/C][C]-[/C][C]-[/C][C]-[/C][C]-[/C][/ROW]
[ROW][C]59[/C][C]117.3[/C][C]-[/C][C]-[/C][C]-[/C][C]-[/C][C]-[/C][C]-[/C][C]-[/C][/ROW]
[ROW][C]60[/C][C]111.1[/C][C]-[/C][C]-[/C][C]-[/C][C]-[/C][C]-[/C][C]-[/C][C]-[/C][/ROW]
[ROW][C]61[/C][C]102.2[/C][C]-[/C][C]-[/C][C]-[/C][C]-[/C][C]-[/C][C]-[/C][C]-[/C][/ROW]
[ROW][C]62[/C][C]104.3[/C][C]-[/C][C]-[/C][C]-[/C][C]-[/C][C]-[/C][C]-[/C][C]-[/C][/ROW]
[ROW][C]63[/C][C]122.9[/C][C]-[/C][C]-[/C][C]-[/C][C]-[/C][C]-[/C][C]-[/C][C]-[/C][/ROW]
[ROW][C]64[/C][C]107.6[/C][C]-[/C][C]-[/C][C]-[/C][C]-[/C][C]-[/C][C]-[/C][C]-[/C][/ROW]
[ROW][C]65[/C][C]121.3[/C][C]-[/C][C]-[/C][C]-[/C][C]-[/C][C]-[/C][C]-[/C][C]-[/C][/ROW]
[ROW][C]66[/C][C]131.5[/C][C]-[/C][C]-[/C][C]-[/C][C]-[/C][C]-[/C][C]-[/C][C]-[/C][/ROW]
[ROW][C]67[/C][C]89[/C][C]-[/C][C]-[/C][C]-[/C][C]-[/C][C]-[/C][C]-[/C][C]-[/C][/ROW]
[ROW][C]68[/C][C]104.4[/C][C]-[/C][C]-[/C][C]-[/C][C]-[/C][C]-[/C][C]-[/C][C]-[/C][/ROW]
[ROW][C]69[/C][C]128.9[/C][C]120.1393[/C][C]108.3943[/C][C]131.8843[/C][C]0.0719[/C][C]0.9957[/C][C]0.6881[/C][C]0.9957[/C][/ROW]
[ROW][C]70[/C][C]135.9[/C][C]115.854[/C][C]104.1015[/C][C]127.6064[/C][C]4e-04[/C][C]0.0148[/C][C]0.7233[/C][C]0.9719[/C][/ROW]
[ROW][C]71[/C][C]133.3[/C][C]119.8699[/C][C]108.0091[/C][C]131.7307[/C][C]0.0132[/C][C]0.004[/C][C]0.6645[/C][C]0.9947[/C][/ROW]
[ROW][C]72[/C][C]121.3[/C][C]112.4626[/C][C]100.1576[/C][C]124.7677[/C][C]0.0796[/C][C]5e-04[/C][C]0.5859[/C][C]0.9005[/C][/ROW]
[ROW][C]73[/C][C]120.5[/C][C]103.5524[/C][C]91.2393[/C][C]115.8655[/C][C]0.0035[/C][C]0.0024[/C][C]0.5852[/C][C]0.4463[/C][/ROW]
[ROW][C]74[/C][C]120.4[/C][C]105.2241[/C][C]92.879[/C][C]117.5692[/C][C]0.008[/C][C]0.0076[/C][C]0.5583[/C][C]0.5521[/C][/ROW]
[ROW][C]75[/C][C]137.9[/C][C]123.4824[/C][C]111.0989[/C][C]135.8658[/C][C]0.0112[/C][C]0.6872[/C][C]0.5367[/C][C]0.9987[/C][/ROW]
[ROW][C]76[/C][C]126.1[/C][C]108.1096[/C][C]95.7231[/C][C]120.4962[/C][C]0.0022[/C][C]0[/C][C]0.5321[/C][C]0.7214[/C][/ROW]
[ROW][C]77[/C][C]133.2[/C][C]121.6456[/C][C]109.2533[/C][C]134.038[/C][C]0.0338[/C][C]0.2406[/C][C]0.5218[/C][C]0.9968[/C][/ROW]
[ROW][C]78[/C][C]146.6[/C][C]131.7379[/C][C]119.3416[/C][C]144.1342[/C][C]0.0094[/C][C]0.4086[/C][C]0.515[/C][C]1[/C][/ROW]
[ROW][C]79[/C][C]103.4[/C][C]89.1924[/C][C]76.7953[/C][C]101.5894[/C][C]0.0123[/C][C]0[/C][C]0.5121[/C][C]0.0081[/C][/ROW]
[ROW][C]80[/C][C]117.2[/C][C]104.532[/C][C]92.1341[/C][C]116.93[/C][C]0.0226[/C][C]0.571[/C][C]0.5083[/C][C]0.5083[/C][/ROW]
[/TABLE]
Source: https://freestatistics.org/blog/index.php?pk=32031&T=1

Globally Unique Identifier (entire table): ba.freestatistics.org/blog/index.php?pk=32031&T=1

As an alternative you can also use a QR Code:  

The GUIDs for individual cells are displayed in the table below:

Univariate ARIMA Extrapolation Forecast
timeY[t]F[t]95% LB95% UBp-value(H0: Y[t] = F[t])P(F[t]>Y[t-1])P(F[t]>Y[t-s])P(F[t]>Y[68])
5696.8-------
57117.2-------
58112.3-------
59117.3-------
60111.1-------
61102.2-------
62104.3-------
63122.9-------
64107.6-------
65121.3-------
66131.5-------
6789-------
68104.4-------
69128.9120.1393108.3943131.88430.07190.99570.68810.9957
70135.9115.854104.1015127.60644e-040.01480.72330.9719
71133.3119.8699108.0091131.73070.01320.0040.66450.9947
72121.3112.4626100.1576124.76770.07965e-040.58590.9005
73120.5103.552491.2393115.86550.00350.00240.58520.4463
74120.4105.224192.879117.56920.0080.00760.55830.5521
75137.9123.4824111.0989135.86580.01120.68720.53670.9987
76126.1108.109695.7231120.49620.002200.53210.7214
77133.2121.6456109.2533134.0380.03380.24060.52180.9968
78146.6131.7379119.3416144.13420.00940.40860.5151
79103.489.192476.7953101.58940.012300.51210.0081
80117.2104.53292.1341116.930.02260.5710.50830.5083


Univariate ARIMA Extrapolation Forecast Performance
time% S.E.PEMAPESq.EMSERMSE
690.04990.07290.006176.74966.39582.529
700.05180.1730.0144401.844133.4875.7868
710.05050.1120.0093180.367115.03063.8769
720.05580.07860.006578.09886.50822.5511
730.06070.16370.0136287.22123.93514.8923
740.05990.14420.012230.307119.19234.3809
750.05120.11680.0097207.868117.32234.162
760.05850.16640.0139323.652726.97115.1934
770.0520.0950.0079133.50411.12533.3355
780.0480.11280.0094220.881618.40684.2903
790.07090.15930.0133201.857116.82144.1014
800.06050.12120.0101160.477513.37313.6569

\begin{tabular}{lllllllll}
\hline
Univariate ARIMA Extrapolation Forecast Performance \tabularnewline
time & % S.E. & PE & MAPE & Sq.E & MSE & RMSE \tabularnewline
69 & 0.0499 & 0.0729 & 0.0061 & 76.7496 & 6.3958 & 2.529 \tabularnewline
70 & 0.0518 & 0.173 & 0.0144 & 401.8441 & 33.487 & 5.7868 \tabularnewline
71 & 0.0505 & 0.112 & 0.0093 & 180.3671 & 15.0306 & 3.8769 \tabularnewline
72 & 0.0558 & 0.0786 & 0.0065 & 78.0988 & 6.5082 & 2.5511 \tabularnewline
73 & 0.0607 & 0.1637 & 0.0136 & 287.221 & 23.9351 & 4.8923 \tabularnewline
74 & 0.0599 & 0.1442 & 0.012 & 230.3071 & 19.1923 & 4.3809 \tabularnewline
75 & 0.0512 & 0.1168 & 0.0097 & 207.8681 & 17.3223 & 4.162 \tabularnewline
76 & 0.0585 & 0.1664 & 0.0139 & 323.6527 & 26.9711 & 5.1934 \tabularnewline
77 & 0.052 & 0.095 & 0.0079 & 133.504 & 11.1253 & 3.3355 \tabularnewline
78 & 0.048 & 0.1128 & 0.0094 & 220.8816 & 18.4068 & 4.2903 \tabularnewline
79 & 0.0709 & 0.1593 & 0.0133 & 201.8571 & 16.8214 & 4.1014 \tabularnewline
80 & 0.0605 & 0.1212 & 0.0101 & 160.4775 & 13.3731 & 3.6569 \tabularnewline
\hline
\end{tabular}
%Source: https://freestatistics.org/blog/index.php?pk=32031&T=2

[TABLE]
[ROW][C]Univariate ARIMA Extrapolation Forecast Performance[/C][/ROW]
[ROW][C]time[/C][C]% S.E.[/C][C]PE[/C][C]MAPE[/C][C]Sq.E[/C][C]MSE[/C][C]RMSE[/C][/ROW]
[ROW][C]69[/C][C]0.0499[/C][C]0.0729[/C][C]0.0061[/C][C]76.7496[/C][C]6.3958[/C][C]2.529[/C][/ROW]
[ROW][C]70[/C][C]0.0518[/C][C]0.173[/C][C]0.0144[/C][C]401.8441[/C][C]33.487[/C][C]5.7868[/C][/ROW]
[ROW][C]71[/C][C]0.0505[/C][C]0.112[/C][C]0.0093[/C][C]180.3671[/C][C]15.0306[/C][C]3.8769[/C][/ROW]
[ROW][C]72[/C][C]0.0558[/C][C]0.0786[/C][C]0.0065[/C][C]78.0988[/C][C]6.5082[/C][C]2.5511[/C][/ROW]
[ROW][C]73[/C][C]0.0607[/C][C]0.1637[/C][C]0.0136[/C][C]287.221[/C][C]23.9351[/C][C]4.8923[/C][/ROW]
[ROW][C]74[/C][C]0.0599[/C][C]0.1442[/C][C]0.012[/C][C]230.3071[/C][C]19.1923[/C][C]4.3809[/C][/ROW]
[ROW][C]75[/C][C]0.0512[/C][C]0.1168[/C][C]0.0097[/C][C]207.8681[/C][C]17.3223[/C][C]4.162[/C][/ROW]
[ROW][C]76[/C][C]0.0585[/C][C]0.1664[/C][C]0.0139[/C][C]323.6527[/C][C]26.9711[/C][C]5.1934[/C][/ROW]
[ROW][C]77[/C][C]0.052[/C][C]0.095[/C][C]0.0079[/C][C]133.504[/C][C]11.1253[/C][C]3.3355[/C][/ROW]
[ROW][C]78[/C][C]0.048[/C][C]0.1128[/C][C]0.0094[/C][C]220.8816[/C][C]18.4068[/C][C]4.2903[/C][/ROW]
[ROW][C]79[/C][C]0.0709[/C][C]0.1593[/C][C]0.0133[/C][C]201.8571[/C][C]16.8214[/C][C]4.1014[/C][/ROW]
[ROW][C]80[/C][C]0.0605[/C][C]0.1212[/C][C]0.0101[/C][C]160.4775[/C][C]13.3731[/C][C]3.6569[/C][/ROW]
[/TABLE]
Source: https://freestatistics.org/blog/index.php?pk=32031&T=2

Globally Unique Identifier (entire table): ba.freestatistics.org/blog/index.php?pk=32031&T=2

As an alternative you can also use a QR Code:  

The GUIDs for individual cells are displayed in the table below:

Univariate ARIMA Extrapolation Forecast Performance
time% S.E.PEMAPESq.EMSERMSE
690.04990.07290.006176.74966.39582.529
700.05180.1730.0144401.844133.4875.7868
710.05050.1120.0093180.367115.03063.8769
720.05580.07860.006578.09886.50822.5511
730.06070.16370.0136287.22123.93514.8923
740.05990.14420.012230.307119.19234.3809
750.05120.11680.0097207.868117.32234.162
760.05850.16640.0139323.652726.97115.1934
770.0520.0950.0079133.50411.12533.3355
780.0480.11280.0094220.881618.40684.2903
790.07090.15930.0133201.857116.82144.1014
800.06050.12120.0101160.477513.37313.6569


Parameters (Session):
par1 = 12 ; par2 = 1 ; par3 = 0 ; par4 = 1 ; par5 = 12 ; par6 = 3 ; par7 = 0 ; par8 = 0 ; par9 = 0 ; par10 = FALSE ;
Parameters (R input):
par1 = 12 ; par2 = 1 ; par3 = 0 ; par4 = 1 ; par5 = 12 ; par6 = 3 ; par7 = 0 ; par8 = 0 ; par9 = 0 ; par10 = FALSE ;
R code (references can be found in the software module):
par1 <- as.numeric(par1) #cut off periods
par2 <- as.numeric(par2) #lambda
par3 <- as.numeric(par3) #degree of non-seasonal differencing
par4 <- as.numeric(par4) #degree of seasonal differencing
par5 <- as.numeric(par5) #seasonal period
par6 <- as.numeric(par6) #p
par7 <- as.numeric(par7) #q
par8 <- as.numeric(par8) #P
par9 <- as.numeric(par9) #Q
if (par10 == 'TRUE') par10 <- TRUE
if (par10 == 'FALSE') par10 <- FALSE
if (par2 == 0) x <- log(x)
if (par2 != 0) x <- x^par2
lx <- length(x)
first <- lx - 2*par1
nx <- lx - par1
nx1 <- nx + 1
fx <- lx - nx
if (fx < 1) {
fx <- par5
nx1 <- lx + fx - 1
first <- lx - 2*fx
}
first <- 1
if (fx < 3) fx <- round(lx/10,0)
(arima.out <- arima(x[1:nx], order=c(par6,par3,par7), seasonal=list(order=c(par8,par4,par9), period=par5), include.mean=par10, method='ML'))
(forecast <- predict(arima.out,fx))
(lb <- forecast$pred - 1.96 * forecast$se)
(ub <- forecast$pred + 1.96 * forecast$se)
if (par2 == 0) {
x <- exp(x)
forecast$pred <- exp(forecast$pred)
lb <- exp(lb)
ub <- exp(ub)
}
if (par2 != 0) {
x <- x^(1/par2)
forecast$pred <- forecast$pred^(1/par2)
lb <- lb^(1/par2)
ub <- ub^(1/par2)
}
if (par2 < 0) {
olb <- lb
lb <- ub
ub <- olb
}
(actandfor <- c(x[1:nx], forecast$pred))
(perc.se <- (ub-forecast$pred)/1.96/forecast$pred)
bitmap(file='test1.png')
opar <- par(mar=c(4,4,2,2),las=1)
ylim <- c( min(x[first:nx],lb), max(x[first:nx],ub))
plot(x,ylim=ylim,type='n',xlim=c(first,lx))
usr <- par('usr')
rect(usr[1],usr[3],nx+1,usr[4],border=NA,col='lemonchiffon')
rect(nx1,usr[3],usr[2],usr[4],border=NA,col='lavender')
abline(h= (-3:3)*2 , col ='gray', lty =3)
polygon( c(nx1:lx,lx:nx1), c(lb,rev(ub)), col = 'orange', lty=2,border=NA)
lines(nx1:lx, lb , lty=2)
lines(nx1:lx, ub , lty=2)
lines(x, lwd=2)
lines(nx1:lx, forecast$pred , lwd=2 , col ='white')
box()
par(opar)
dev.off()
prob.dec <- array(NA, dim=fx)
prob.sdec <- array(NA, dim=fx)
prob.ldec <- array(NA, dim=fx)
prob.pval <- array(NA, dim=fx)
perf.pe <- array(0, dim=fx)
perf.mape <- array(0, dim=fx)
perf.se <- array(0, dim=fx)
perf.mse <- array(0, dim=fx)
perf.rmse <- array(0, dim=fx)
for (i in 1:fx) {
locSD <- (ub[i] - forecast$pred[i]) / 1.96
perf.pe[i] = (x[nx+i] - forecast$pred[i]) / forecast$pred[i]
perf.mape[i] = perf.mape[i] + abs(perf.pe[i])
perf.se[i] = (x[nx+i] - forecast$pred[i])^2
perf.mse[i] = perf.mse[i] + perf.se[i]
prob.dec[i] = pnorm((x[nx+i-1] - forecast$pred[i]) / locSD)
prob.sdec[i] = pnorm((x[nx+i-par5] - forecast$pred[i]) / locSD)
prob.ldec[i] = pnorm((x[nx] - forecast$pred[i]) / locSD)
prob.pval[i] = pnorm(abs(x[nx+i] - forecast$pred[i]) / locSD)
}
perf.mape = perf.mape / fx
perf.mse = perf.mse / fx
perf.rmse = sqrt(perf.mse)
bitmap(file='test2.png')
plot(forecast$pred, pch=19, type='b',main='ARIMA Extrapolation Forecast', ylab='Forecast and 95% CI', xlab='time',ylim=c(min(lb),max(ub)))
dum <- forecast$pred
dum[1:12] <- x[(nx+1):lx]
lines(dum, lty=1)
lines(ub,lty=3)
lines(lb,lty=3)
dev.off()
load(file='createtable')
a<-table.start()
a<-table.row.start(a)
a<-table.element(a,'Univariate ARIMA Extrapolation Forecast',9,TRUE)
a<-table.row.end(a)
a<-table.row.start(a)
a<-table.element(a,'time',1,header=TRUE)
a<-table.element(a,'Y[t]',1,header=TRUE)
a<-table.element(a,'F[t]',1,header=TRUE)
a<-table.element(a,'95% LB',1,header=TRUE)
a<-table.element(a,'95% UB',1,header=TRUE)
a<-table.element(a,'p-value
(H0: Y[t] = F[t])',1,header=TRUE)
a<-table.element(a,'P(F[t]>Y[t-1])',1,header=TRUE)
a<-table.element(a,'P(F[t]>Y[t-s])',1,header=TRUE)
mylab <- paste('P(F[t]>Y[',nx,sep='')
mylab <- paste(mylab,'])',sep='')
a<-table.element(a,mylab,1,header=TRUE)
a<-table.row.end(a)
for (i in (nx-par5):nx) {
a<-table.row.start(a)
a<-table.element(a,i,header=TRUE)
a<-table.element(a,x[i])
a<-table.element(a,'-')
a<-table.row.end(a)
}
for (i in 1:fx) {
a<-table.row.start(a)
a<-table.element(a,nx+i,header=TRUE)
a<-table.element(a,round(x[nx+i],4))
a<-table.element(a,round(forecast$pred[i],4))
a<-table.element(a,round(lb[i],4))
a<-table.element(a,round(ub[i],4))
a<-table.element(a,round((1-prob.pval[i]),4))
a<-table.element(a,round((1-prob.dec[i]),4))
a<-table.element(a,round((1-prob.sdec[i]),4))
a<-table.element(a,round((1-prob.ldec[i]),4))
a<-table.row.end(a)
}
a<-table.end(a)
table.save(a,file='mytable.tab')
a<-table.start()
a<-table.row.start(a)
a<-table.element(a,'Univariate ARIMA Extrapolation Forecast Performance',7,TRUE)
a<-table.row.end(a)
a<-table.row.start(a)
a<-table.element(a,'time',1,header=TRUE)
a<-table.element(a,'% S.E.',1,header=TRUE)
a<-table.element(a,'PE',1,header=TRUE)
a<-table.element(a,'MAPE',1,header=TRUE)
a<-table.element(a,'Sq.E',1,header=TRUE)
a<-table.element(a,'MSE',1,header=TRUE)
a<-table.element(a,'RMSE',1,header=TRUE)
a<-table.row.end(a)
for (i in 1:fx) {
a<-table.row.start(a)
a<-table.element(a,nx+i,header=TRUE)
a<-table.element(a,round(perc.se[i],4))
a<-table.element(a,round(perf.pe[i],4))
a<-table.element(a,round(perf.mape[i],4))
a<-table.element(a,round(perf.se[i],4))
a<-table.element(a,round(perf.mse[i],4))
a<-table.element(a,round(perf.rmse[i],4))
a<-table.row.end(a)
}
a<-table.end(a)
table.save(a,file='mytable1.tab')