Free Statistics
of Irreproducible Research!
Description of Statistical Computation | |||||||||||||||||||||||||||||||||||||||||
|---|---|---|---|---|---|---|---|---|---|---|---|---|---|---|---|---|---|---|---|---|---|---|---|---|---|---|---|---|---|---|---|---|---|---|---|---|---|---|---|---|---|
| Author's title | |||||||||||||||||||||||||||||||||||||||||
| Author | *Unverified author* | ||||||||||||||||||||||||||||||||||||||||
| R Software Module | rwasp_univariatedataseries.wasp | ||||||||||||||||||||||||||||||||||||||||
| Title produced by software | Univariate Data Series | ||||||||||||||||||||||||||||||||||||||||
| Date of computation | Wed, 10 Dec 2008 07:09:01 -0700 | ||||||||||||||||||||||||||||||||||||||||
| Cite this page as follows | Statistical Computations at FreeStatistics.org, Office for Research Development and Education, URL https://freestatistics.org/blog/index.php?v=date/2008/Dec/10/t1228918258r7rvnwglk3pbhzv.htm/, Retrieved Fri, 04 Jul 2025 11:23:51 +0000 | ||||||||||||||||||||||||||||||||||||||||
| Statistical Computations at FreeStatistics.org, Office for Research Development and Education, URL https://freestatistics.org/blog/index.php?pk=31966, Retrieved Fri, 04 Jul 2025 11:23:51 +0000 | |||||||||||||||||||||||||||||||||||||||||
| QR Codes: | |||||||||||||||||||||||||||||||||||||||||
|
| |||||||||||||||||||||||||||||||||||||||||
| Original text written by user: | |||||||||||||||||||||||||||||||||||||||||
| IsPrivate? | No (this computation is public) | ||||||||||||||||||||||||||||||||||||||||
| User-defined keywords | |||||||||||||||||||||||||||||||||||||||||
| Estimated Impact | 311 | ||||||||||||||||||||||||||||||||||||||||
Tree of Dependent Computations | |||||||||||||||||||||||||||||||||||||||||
| Family? (F = Feedback message, R = changed R code, M = changed R Module, P = changed Parameters, D = changed Data) | |||||||||||||||||||||||||||||||||||||||||
| - [Univariate Data Series] [] [2008-12-10 14:09:01] [fdca7b9f854bfffb453280beefa0aca5] [Current] - RMP [Histogram] [histogram bij ver...] [2009-01-03 16:24:32] [a18c43c8b63fa6800a53bb187b9ddd45] - [Histogram] [MaximeJonckheere ...] [2009-03-02 21:52:37] [74be16979710d4c4e7c6647856088456] | |||||||||||||||||||||||||||||||||||||||||
| Feedback Forum | |||||||||||||||||||||||||||||||||||||||||
Post a new message | |||||||||||||||||||||||||||||||||||||||||
Dataset | |||||||||||||||||||||||||||||||||||||||||
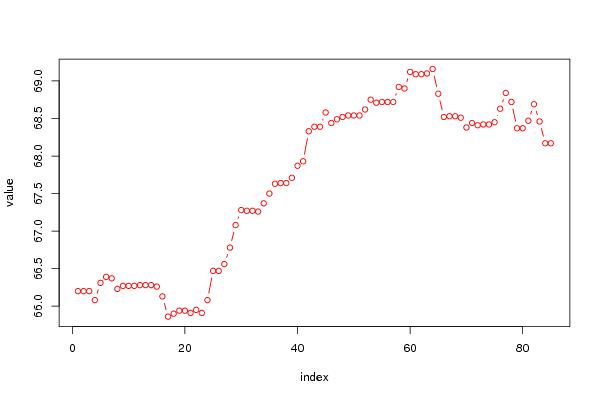
| Dataseries X: | |||||||||||||||||||||||||||||||||||||||||
66.2 66.2 66.2 66.08 66.31 66.39 66.37 66.23 66.27 66.27 66.27 66.28 66.28 66.28 66.26 66.13 65.86 65.9 65.94 65.94 65.91 65.95 65.91 66.08 66.47 66.47 66.56 66.78 67.08 67.28 67.27 67.27 67.26 67.37 67.5 67.63 67.64 67.64 67.71 67.87 67.93 68.33 68.39 68.39 68.58 68.44 68.49 68.52 68.54 68.54 68.54 68.62 68.75 68.71 68.72 68.72 68.72 68.92 68.9 69.12 69.09 69.09 69.1 69.16 68.83 68.52 68.53 68.53 68.51 68.38 68.44 68.41 68.42 68.42 68.45 68.63 68.84 68.72 68.37 68.37 68.47 68.69 68.46 68.17 68.17 | |||||||||||||||||||||||||||||||||||||||||
Tables (Output of Computation) | |||||||||||||||||||||||||||||||||||||||||
| |||||||||||||||||||||||||||||||||||||||||
Figures (Output of Computation) | |||||||||||||||||||||||||||||||||||||||||
Input Parameters & R Code | |||||||||||||||||||||||||||||||||||||||||
| Parameters (Session): | |||||||||||||||||||||||||||||||||||||||||
| par1 = Gemiddelde prijs van tennisschoenen. ; par2 = http://www.belgostat.be ; | |||||||||||||||||||||||||||||||||||||||||
| Parameters (R input): | |||||||||||||||||||||||||||||||||||||||||
| par1 = Gemiddelde prijs van tennisschoenen. ; par2 = http://www.belgostat.be ; par3 = ; | |||||||||||||||||||||||||||||||||||||||||
| R code (references can be found in the software module): | |||||||||||||||||||||||||||||||||||||||||
bitmap(file='test1.png') | |||||||||||||||||||||||||||||||||||||||||