Free Statistics

of Irreproducible Research!

Author's title

Author*Unverified author*
R Software Modulerwasp_arimabackwardselection.wasp
Title produced by softwareARIMA Backward Selection
Date of computationTue, 09 Dec 2008 12:17:56 -0700
Cite this page as followsStatistical Computations at FreeStatistics.org, Office for Research Development and Education, URL https://freestatistics.org/blog/index.php?v=date/2008/Dec/09/t1228850303mxmxr09l20009vq.htm/, Retrieved Sat, 25 May 2024 04:56:57 +0000
Statistical Computations at FreeStatistics.org, Office for Research Development and Education, URL https://freestatistics.org/blog/index.php?pk=31721, Retrieved Sat, 25 May 2024 04:56:57 +0000
QR Codes:

Original text written by user:
IsPrivate?No (this computation is public)
User-defined keywords
Estimated Impact162
Family? (F = Feedback message, R = changed R code, M = changed R Module, P = changed Parameters, D = changed Data)
-     [Univariate Data Series] [data set] [2008-12-01 19:54:57] [b98453cac15ba1066b407e146608df68]
F RMP   [Standard Deviation-Mean Plot] [step 1] [2008-12-06 15:53:54] [74be16979710d4c4e7c6647856088456]
- RMPD      [ARIMA Backward Selection] [step 5] [2008-12-09 19:17:56] [d41d8cd98f00b204e9800998ecf8427e] [Current]
Feedback Forum

Post a new message
Dataseries X:
113438
109416
109406
105645
101328
97686
93093
91382
122257
139183
139887
131822
116805
113706
113012
110452
107005
102841
98173
98181
137277
147579
146571
138920
130340
128140
127059
122860
117702
113537
108366
111078
150739
159129
157928
147768
137507
136919
136151
133001
125554
119647
114158
116193
152803
161761
160942
149470
139208
134588
130322
126611
122401
117352
112135
112879
148729
157230
157221
146681
136524
132111
125326
122716
116615
113719
110737
112093
143565
149946
149147
134339
122683
115614
116566
111272
104609
101802
94542
93051
124129
130374
123946
114971
105531
104919
104782
101281
94545
93248
84031
87486
115867
120327
117008
108811
104519


Summary of computational transaction
Raw Inputview raw input (R code)
Raw Outputview raw output of R engine
Computing time18 seconds
R Server'Herman Ole Andreas Wold' @ 193.190.124.10:1001

\begin{tabular}{lllllllll}
\hline
Summary of computational transaction \tabularnewline
Raw Input & view raw input (R code)  \tabularnewline
Raw Output & view raw output of R engine  \tabularnewline
Computing time & 18 seconds \tabularnewline
R Server & 'Herman Ole Andreas Wold' @ 193.190.124.10:1001 \tabularnewline
\hline
\end{tabular}
%Source: https://freestatistics.org/blog/index.php?pk=31721&T=0

[TABLE]
[ROW][C]Summary of computational transaction[/C][/ROW]
[ROW][C]Raw Input[/C][C]view raw input (R code) [/C][/ROW]
[ROW][C]Raw Output[/C][C]view raw output of R engine [/C][/ROW]
[ROW][C]Computing time[/C][C]18 seconds[/C][/ROW]
[ROW][C]R Server[/C][C]'Herman Ole Andreas Wold' @ 193.190.124.10:1001[/C][/ROW]
[/TABLE]
Source: https://freestatistics.org/blog/index.php?pk=31721&T=0

Globally Unique Identifier (entire table): ba.freestatistics.org/blog/index.php?pk=31721&T=0

As an alternative you can also use a QR Code:  

The GUIDs for individual cells are displayed in the table below:

Summary of computational transaction
Raw Inputview raw input (R code)
Raw Outputview raw output of R engine
Computing time18 seconds
R Server'Herman Ole Andreas Wold' @ 193.190.124.10:1001


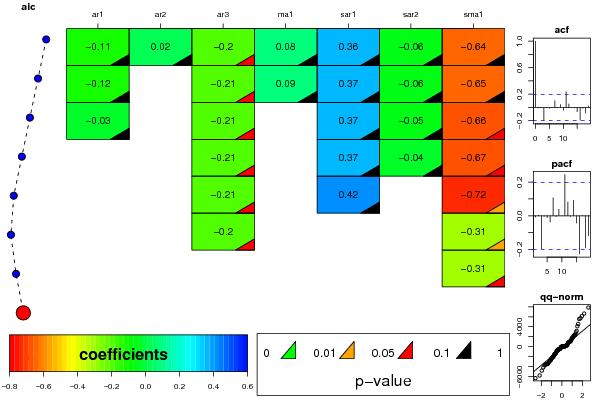
ARIMA Parameter Estimation and Backward Selection
Iterationar1ar2ar3ma1sar1sar2sma1
Estimates ( 1 )-0.10550.0178-0.20370.08130.3559-0.0644-0.6427
(p-val)(0.8303 )(0.8749 )(0.071 )(0.8685 )(0.3638 )(0.7514 )(0.1044 )
Estimates ( 2 )-0.1170-0.20560.09050.3659-0.06-0.6498
(p-val)(0.8122 )(NA )(0.064 )(0.8518 )(0.3527 )(0.7687 )(0.1048 )
Estimates ( 3 )-0.02730-0.206900.3723-0.0518-0.6604
(p-val)(0.8148 )(NA )(0.0609 )(NA )(0.3441 )(0.7967 )(0.0972 )
Estimates ( 4 )00-0.207300.3697-0.0418-0.6687
(p-val)(NA )(NA )(0.0605 )(NA )(0.3447 )(0.834 )(0.0904 )
Estimates ( 5 )00-0.207600.41550-0.7218
(p-val)(NA )(NA )(0.0603 )(NA )(0.182 )(NA )(0.0133 )
Estimates ( 6 )00-0.1983000-0.3114
(p-val)(NA )(NA )(0.0723 )(NA )(NA )(NA )(0.049 )
Estimates ( 7 )000000-0.3058
(p-val)(NA )(NA )(NA )(NA )(NA )(NA )(0.0582 )
Estimates ( 8 )0000000
(p-val)(NA )(NA )(NA )(NA )(NA )(NA )(NA )
Estimates ( 9 )NANANANANANANA
(p-val)(NA )(NA )(NA )(NA )(NA )(NA )(NA )
Estimates ( 10 )NANANANANANANA
(p-val)(NA )(NA )(NA )(NA )(NA )(NA )(NA )
Estimates ( 11 )NANANANANANANA
(p-val)(NA )(NA )(NA )(NA )(NA )(NA )(NA )
Estimates ( 12 )NANANANANANANA
(p-val)(NA )(NA )(NA )(NA )(NA )(NA )(NA )
Estimates ( 13 )NANANANANANANA
(p-val)(NA )(NA )(NA )(NA )(NA )(NA )(NA )

\begin{tabular}{lllllllll}
\hline
ARIMA Parameter Estimation and Backward Selection \tabularnewline
Iteration & ar1 & ar2 & ar3 & ma1 & sar1 & sar2 & sma1 \tabularnewline
Estimates ( 1 ) & -0.1055 & 0.0178 & -0.2037 & 0.0813 & 0.3559 & -0.0644 & -0.6427 \tabularnewline
(p-val) & (0.8303 ) & (0.8749 ) & (0.071 ) & (0.8685 ) & (0.3638 ) & (0.7514 ) & (0.1044 ) \tabularnewline
Estimates ( 2 ) & -0.117 & 0 & -0.2056 & 0.0905 & 0.3659 & -0.06 & -0.6498 \tabularnewline
(p-val) & (0.8122 ) & (NA ) & (0.064 ) & (0.8518 ) & (0.3527 ) & (0.7687 ) & (0.1048 ) \tabularnewline
Estimates ( 3 ) & -0.0273 & 0 & -0.2069 & 0 & 0.3723 & -0.0518 & -0.6604 \tabularnewline
(p-val) & (0.8148 ) & (NA ) & (0.0609 ) & (NA ) & (0.3441 ) & (0.7967 ) & (0.0972 ) \tabularnewline
Estimates ( 4 ) & 0 & 0 & -0.2073 & 0 & 0.3697 & -0.0418 & -0.6687 \tabularnewline
(p-val) & (NA ) & (NA ) & (0.0605 ) & (NA ) & (0.3447 ) & (0.834 ) & (0.0904 ) \tabularnewline
Estimates ( 5 ) & 0 & 0 & -0.2076 & 0 & 0.4155 & 0 & -0.7218 \tabularnewline
(p-val) & (NA ) & (NA ) & (0.0603 ) & (NA ) & (0.182 ) & (NA ) & (0.0133 ) \tabularnewline
Estimates ( 6 ) & 0 & 0 & -0.1983 & 0 & 0 & 0 & -0.3114 \tabularnewline
(p-val) & (NA ) & (NA ) & (0.0723 ) & (NA ) & (NA ) & (NA ) & (0.049 ) \tabularnewline
Estimates ( 7 ) & 0 & 0 & 0 & 0 & 0 & 0 & -0.3058 \tabularnewline
(p-val) & (NA ) & (NA ) & (NA ) & (NA ) & (NA ) & (NA ) & (0.0582 ) \tabularnewline
Estimates ( 8 ) & 0 & 0 & 0 & 0 & 0 & 0 & 0 \tabularnewline
(p-val) & (NA ) & (NA ) & (NA ) & (NA ) & (NA ) & (NA ) & (NA ) \tabularnewline
Estimates ( 9 ) & NA & NA & NA & NA & NA & NA & NA \tabularnewline
(p-val) & (NA ) & (NA ) & (NA ) & (NA ) & (NA ) & (NA ) & (NA ) \tabularnewline
Estimates ( 10 ) & NA & NA & NA & NA & NA & NA & NA \tabularnewline
(p-val) & (NA ) & (NA ) & (NA ) & (NA ) & (NA ) & (NA ) & (NA ) \tabularnewline
Estimates ( 11 ) & NA & NA & NA & NA & NA & NA & NA \tabularnewline
(p-val) & (NA ) & (NA ) & (NA ) & (NA ) & (NA ) & (NA ) & (NA ) \tabularnewline
Estimates ( 12 ) & NA & NA & NA & NA & NA & NA & NA \tabularnewline
(p-val) & (NA ) & (NA ) & (NA ) & (NA ) & (NA ) & (NA ) & (NA ) \tabularnewline
Estimates ( 13 ) & NA & NA & NA & NA & NA & NA & NA \tabularnewline
(p-val) & (NA ) & (NA ) & (NA ) & (NA ) & (NA ) & (NA ) & (NA ) \tabularnewline
\hline
\end{tabular}
%Source: https://freestatistics.org/blog/index.php?pk=31721&T=1

[TABLE]
[ROW][C]ARIMA Parameter Estimation and Backward Selection[/C][/ROW]
[ROW][C]Iteration[/C][C]ar1[/C][C]ar2[/C][C]ar3[/C][C]ma1[/C][C]sar1[/C][C]sar2[/C][C]sma1[/C][/ROW]
[ROW][C]Estimates ( 1 )[/C][C]-0.1055[/C][C]0.0178[/C][C]-0.2037[/C][C]0.0813[/C][C]0.3559[/C][C]-0.0644[/C][C]-0.6427[/C][/ROW]
[ROW][C](p-val)[/C][C](0.8303 )[/C][C](0.8749 )[/C][C](0.071 )[/C][C](0.8685 )[/C][C](0.3638 )[/C][C](0.7514 )[/C][C](0.1044 )[/C][/ROW]
[ROW][C]Estimates ( 2 )[/C][C]-0.117[/C][C]0[/C][C]-0.2056[/C][C]0.0905[/C][C]0.3659[/C][C]-0.06[/C][C]-0.6498[/C][/ROW]
[ROW][C](p-val)[/C][C](0.8122 )[/C][C](NA )[/C][C](0.064 )[/C][C](0.8518 )[/C][C](0.3527 )[/C][C](0.7687 )[/C][C](0.1048 )[/C][/ROW]
[ROW][C]Estimates ( 3 )[/C][C]-0.0273[/C][C]0[/C][C]-0.2069[/C][C]0[/C][C]0.3723[/C][C]-0.0518[/C][C]-0.6604[/C][/ROW]
[ROW][C](p-val)[/C][C](0.8148 )[/C][C](NA )[/C][C](0.0609 )[/C][C](NA )[/C][C](0.3441 )[/C][C](0.7967 )[/C][C](0.0972 )[/C][/ROW]
[ROW][C]Estimates ( 4 )[/C][C]0[/C][C]0[/C][C]-0.2073[/C][C]0[/C][C]0.3697[/C][C]-0.0418[/C][C]-0.6687[/C][/ROW]
[ROW][C](p-val)[/C][C](NA )[/C][C](NA )[/C][C](0.0605 )[/C][C](NA )[/C][C](0.3447 )[/C][C](0.834 )[/C][C](0.0904 )[/C][/ROW]
[ROW][C]Estimates ( 5 )[/C][C]0[/C][C]0[/C][C]-0.2076[/C][C]0[/C][C]0.4155[/C][C]0[/C][C]-0.7218[/C][/ROW]
[ROW][C](p-val)[/C][C](NA )[/C][C](NA )[/C][C](0.0603 )[/C][C](NA )[/C][C](0.182 )[/C][C](NA )[/C][C](0.0133 )[/C][/ROW]
[ROW][C]Estimates ( 6 )[/C][C]0[/C][C]0[/C][C]-0.1983[/C][C]0[/C][C]0[/C][C]0[/C][C]-0.3114[/C][/ROW]
[ROW][C](p-val)[/C][C](NA )[/C][C](NA )[/C][C](0.0723 )[/C][C](NA )[/C][C](NA )[/C][C](NA )[/C][C](0.049 )[/C][/ROW]
[ROW][C]Estimates ( 7 )[/C][C]0[/C][C]0[/C][C]0[/C][C]0[/C][C]0[/C][C]0[/C][C]-0.3058[/C][/ROW]
[ROW][C](p-val)[/C][C](NA )[/C][C](NA )[/C][C](NA )[/C][C](NA )[/C][C](NA )[/C][C](NA )[/C][C](0.0582 )[/C][/ROW]
[ROW][C]Estimates ( 8 )[/C][C]0[/C][C]0[/C][C]0[/C][C]0[/C][C]0[/C][C]0[/C][C]0[/C][/ROW]
[ROW][C](p-val)[/C][C](NA )[/C][C](NA )[/C][C](NA )[/C][C](NA )[/C][C](NA )[/C][C](NA )[/C][C](NA )[/C][/ROW]
[ROW][C]Estimates ( 9 )[/C][C]NA[/C][C]NA[/C][C]NA[/C][C]NA[/C][C]NA[/C][C]NA[/C][C]NA[/C][/ROW]
[ROW][C](p-val)[/C][C](NA )[/C][C](NA )[/C][C](NA )[/C][C](NA )[/C][C](NA )[/C][C](NA )[/C][C](NA )[/C][/ROW]
[ROW][C]Estimates ( 10 )[/C][C]NA[/C][C]NA[/C][C]NA[/C][C]NA[/C][C]NA[/C][C]NA[/C][C]NA[/C][/ROW]
[ROW][C](p-val)[/C][C](NA )[/C][C](NA )[/C][C](NA )[/C][C](NA )[/C][C](NA )[/C][C](NA )[/C][C](NA )[/C][/ROW]
[ROW][C]Estimates ( 11 )[/C][C]NA[/C][C]NA[/C][C]NA[/C][C]NA[/C][C]NA[/C][C]NA[/C][C]NA[/C][/ROW]
[ROW][C](p-val)[/C][C](NA )[/C][C](NA )[/C][C](NA )[/C][C](NA )[/C][C](NA )[/C][C](NA )[/C][C](NA )[/C][/ROW]
[ROW][C]Estimates ( 12 )[/C][C]NA[/C][C]NA[/C][C]NA[/C][C]NA[/C][C]NA[/C][C]NA[/C][C]NA[/C][/ROW]
[ROW][C](p-val)[/C][C](NA )[/C][C](NA )[/C][C](NA )[/C][C](NA )[/C][C](NA )[/C][C](NA )[/C][C](NA )[/C][/ROW]
[ROW][C]Estimates ( 13 )[/C][C]NA[/C][C]NA[/C][C]NA[/C][C]NA[/C][C]NA[/C][C]NA[/C][C]NA[/C][/ROW]
[ROW][C](p-val)[/C][C](NA )[/C][C](NA )[/C][C](NA )[/C][C](NA )[/C][C](NA )[/C][C](NA )[/C][C](NA )[/C][/ROW]
[/TABLE]
Source: https://freestatistics.org/blog/index.php?pk=31721&T=1

Globally Unique Identifier (entire table): ba.freestatistics.org/blog/index.php?pk=31721&T=1

As an alternative you can also use a QR Code:  

The GUIDs for individual cells are displayed in the table below:

ARIMA Parameter Estimation and Backward Selection
Iterationar1ar2ar3ma1sar1sar2sma1
Estimates ( 1 )-0.10550.0178-0.20370.08130.3559-0.0644-0.6427
(p-val)(0.8303 )(0.8749 )(0.071 )(0.8685 )(0.3638 )(0.7514 )(0.1044 )
Estimates ( 2 )-0.1170-0.20560.09050.3659-0.06-0.6498
(p-val)(0.8122 )(NA )(0.064 )(0.8518 )(0.3527 )(0.7687 )(0.1048 )
Estimates ( 3 )-0.02730-0.206900.3723-0.0518-0.6604
(p-val)(0.8148 )(NA )(0.0609 )(NA )(0.3441 )(0.7967 )(0.0972 )
Estimates ( 4 )00-0.207300.3697-0.0418-0.6687
(p-val)(NA )(NA )(0.0605 )(NA )(0.3447 )(0.834 )(0.0904 )
Estimates ( 5 )00-0.207600.41550-0.7218
(p-val)(NA )(NA )(0.0603 )(NA )(0.182 )(NA )(0.0133 )
Estimates ( 6 )00-0.1983000-0.3114
(p-val)(NA )(NA )(0.0723 )(NA )(NA )(NA )(0.049 )
Estimates ( 7 )000000-0.3058
(p-val)(NA )(NA )(NA )(NA )(NA )(NA )(0.0582 )
Estimates ( 8 )0000000
(p-val)(NA )(NA )(NA )(NA )(NA )(NA )(NA )
Estimates ( 9 )NANANANANANANA
(p-val)(NA )(NA )(NA )(NA )(NA )(NA )(NA )
Estimates ( 10 )NANANANANANANA
(p-val)(NA )(NA )(NA )(NA )(NA )(NA )(NA )
Estimates ( 11 )NANANANANANANA
(p-val)(NA )(NA )(NA )(NA )(NA )(NA )(NA )
Estimates ( 12 )NANANANANANANA
(p-val)(NA )(NA )(NA )(NA )(NA )(NA )(NA )
Estimates ( 13 )NANANANANANANA
(p-val)(NA )(NA )(NA )(NA )(NA )(NA )(NA )


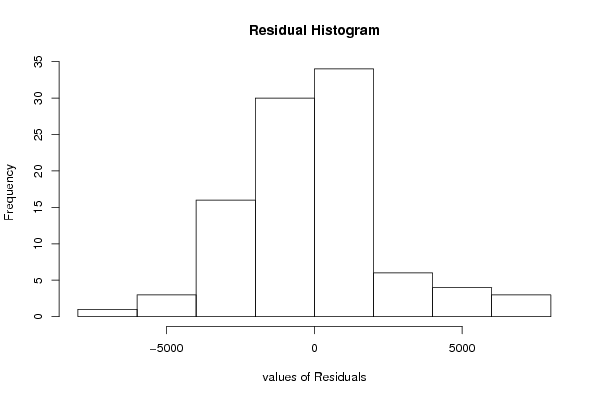
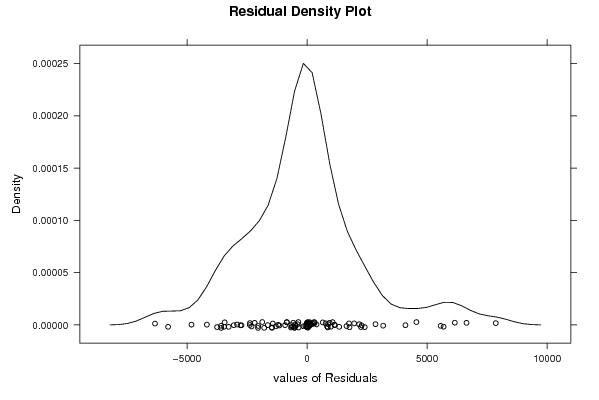
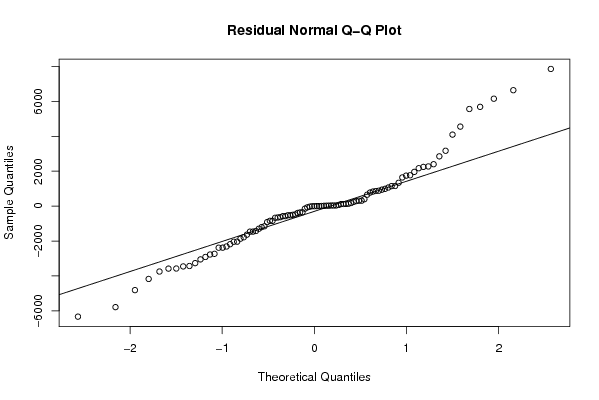
Estimated ARIMA Residuals
Value
-391.065212849852
882.580096678144
-654.196965758033
1148.36472918591
831.805674530045
-499.368218613105
-71.9376529715412
1643.60752886361
7861.33446127487
-6334.71431242082
-1637.49766664867
395.518525005844
6155.13884607858
1152.50629859505
-576.016355483729
-1297.98564981457
-1461.90725930116
-146.451669126676
-521.953079473839
3172.00518233227
2852.61837036763
-3749.58535590759
-669.204332297215
-2383.81664236380
118.563334879994
1962.32317272189
137.495512971553
653.393694446455
-2733.28013280259
-1785.94637530956
-476.809028511811
289.079272243204
-2181.28895194848
-573.903585516959
178.095510373861
-2037.35013981804
35.1010912156396
-3431.99812108978
-3455.84775018342
-361.244801799057
2401.35203377101
312.024742300138
126.234929440299
-1202.58667430050
-1426.7713301824
-632.420604041167
864.413880643712
309.170626169259
115.726401589987
-842.51311475509
-3575.79754337789
990.52698866533
-1156.65522606141
2248.41085896986
2273.59566675953
244.244411121187
-4814.29556035879
-2313.38871327012
-525.657805395579
-4173.44111510558
-1463.60575628692
-2913.65038155836
6643.47345176528
-2381.08348086148
-915.719655112186
776.592505819336
-3582.70433653836
-2772.30610080798
-1866.27247064645
-843.463543096172
-5789.75111125196
4556.70705141341
1768.41014058929
5565.96574389044
942.664929981161
1064.83210667104
-353.039572747195
1747.49254992533
-3052.63985294052
4098.19079787151
-3267.73152924246
-2042.94261846488
1338.41496215816
2171.50321673153
5688.80382288017

\begin{tabular}{lllllllll}
\hline
Estimated ARIMA Residuals \tabularnewline
Value \tabularnewline
-391.065212849852 \tabularnewline
882.580096678144 \tabularnewline
-654.196965758033 \tabularnewline
1148.36472918591 \tabularnewline
831.805674530045 \tabularnewline
-499.368218613105 \tabularnewline
-71.9376529715412 \tabularnewline
1643.60752886361 \tabularnewline
7861.33446127487 \tabularnewline
-6334.71431242082 \tabularnewline
-1637.49766664867 \tabularnewline
395.518525005844 \tabularnewline
6155.13884607858 \tabularnewline
1152.50629859505 \tabularnewline
-576.016355483729 \tabularnewline
-1297.98564981457 \tabularnewline
-1461.90725930116 \tabularnewline
-146.451669126676 \tabularnewline
-521.953079473839 \tabularnewline
3172.00518233227 \tabularnewline
2852.61837036763 \tabularnewline
-3749.58535590759 \tabularnewline
-669.204332297215 \tabularnewline
-2383.81664236380 \tabularnewline
118.563334879994 \tabularnewline
1962.32317272189 \tabularnewline
137.495512971553 \tabularnewline
653.393694446455 \tabularnewline
-2733.28013280259 \tabularnewline
-1785.94637530956 \tabularnewline
-476.809028511811 \tabularnewline
289.079272243204 \tabularnewline
-2181.28895194848 \tabularnewline
-573.903585516959 \tabularnewline
178.095510373861 \tabularnewline
-2037.35013981804 \tabularnewline
35.1010912156396 \tabularnewline
-3431.99812108978 \tabularnewline
-3455.84775018342 \tabularnewline
-361.244801799057 \tabularnewline
2401.35203377101 \tabularnewline
312.024742300138 \tabularnewline
126.234929440299 \tabularnewline
-1202.58667430050 \tabularnewline
-1426.7713301824 \tabularnewline
-632.420604041167 \tabularnewline
864.413880643712 \tabularnewline
309.170626169259 \tabularnewline
115.726401589987 \tabularnewline
-842.51311475509 \tabularnewline
-3575.79754337789 \tabularnewline
990.52698866533 \tabularnewline
-1156.65522606141 \tabularnewline
2248.41085896986 \tabularnewline
2273.59566675953 \tabularnewline
244.244411121187 \tabularnewline
-4814.29556035879 \tabularnewline
-2313.38871327012 \tabularnewline
-525.657805395579 \tabularnewline
-4173.44111510558 \tabularnewline
-1463.60575628692 \tabularnewline
-2913.65038155836 \tabularnewline
6643.47345176528 \tabularnewline
-2381.08348086148 \tabularnewline
-915.719655112186 \tabularnewline
776.592505819336 \tabularnewline
-3582.70433653836 \tabularnewline
-2772.30610080798 \tabularnewline
-1866.27247064645 \tabularnewline
-843.463543096172 \tabularnewline
-5789.75111125196 \tabularnewline
4556.70705141341 \tabularnewline
1768.41014058929 \tabularnewline
5565.96574389044 \tabularnewline
942.664929981161 \tabularnewline
1064.83210667104 \tabularnewline
-353.039572747195 \tabularnewline
1747.49254992533 \tabularnewline
-3052.63985294052 \tabularnewline
4098.19079787151 \tabularnewline
-3267.73152924246 \tabularnewline
-2042.94261846488 \tabularnewline
1338.41496215816 \tabularnewline
2171.50321673153 \tabularnewline
5688.80382288017 \tabularnewline
\hline
\end{tabular}
%Source: https://freestatistics.org/blog/index.php?pk=31721&T=2

[TABLE]
[ROW][C]Estimated ARIMA Residuals[/C][/ROW]
[ROW][C]Value[/C][/ROW]
[ROW][C]-391.065212849852[/C][/ROW]
[ROW][C]882.580096678144[/C][/ROW]
[ROW][C]-654.196965758033[/C][/ROW]
[ROW][C]1148.36472918591[/C][/ROW]
[ROW][C]831.805674530045[/C][/ROW]
[ROW][C]-499.368218613105[/C][/ROW]
[ROW][C]-71.9376529715412[/C][/ROW]
[ROW][C]1643.60752886361[/C][/ROW]
[ROW][C]7861.33446127487[/C][/ROW]
[ROW][C]-6334.71431242082[/C][/ROW]
[ROW][C]-1637.49766664867[/C][/ROW]
[ROW][C]395.518525005844[/C][/ROW]
[ROW][C]6155.13884607858[/C][/ROW]
[ROW][C]1152.50629859505[/C][/ROW]
[ROW][C]-576.016355483729[/C][/ROW]
[ROW][C]-1297.98564981457[/C][/ROW]
[ROW][C]-1461.90725930116[/C][/ROW]
[ROW][C]-146.451669126676[/C][/ROW]
[ROW][C]-521.953079473839[/C][/ROW]
[ROW][C]3172.00518233227[/C][/ROW]
[ROW][C]2852.61837036763[/C][/ROW]
[ROW][C]-3749.58535590759[/C][/ROW]
[ROW][C]-669.204332297215[/C][/ROW]
[ROW][C]-2383.81664236380[/C][/ROW]
[ROW][C]118.563334879994[/C][/ROW]
[ROW][C]1962.32317272189[/C][/ROW]
[ROW][C]137.495512971553[/C][/ROW]
[ROW][C]653.393694446455[/C][/ROW]
[ROW][C]-2733.28013280259[/C][/ROW]
[ROW][C]-1785.94637530956[/C][/ROW]
[ROW][C]-476.809028511811[/C][/ROW]
[ROW][C]289.079272243204[/C][/ROW]
[ROW][C]-2181.28895194848[/C][/ROW]
[ROW][C]-573.903585516959[/C][/ROW]
[ROW][C]178.095510373861[/C][/ROW]
[ROW][C]-2037.35013981804[/C][/ROW]
[ROW][C]35.1010912156396[/C][/ROW]
[ROW][C]-3431.99812108978[/C][/ROW]
[ROW][C]-3455.84775018342[/C][/ROW]
[ROW][C]-361.244801799057[/C][/ROW]
[ROW][C]2401.35203377101[/C][/ROW]
[ROW][C]312.024742300138[/C][/ROW]
[ROW][C]126.234929440299[/C][/ROW]
[ROW][C]-1202.58667430050[/C][/ROW]
[ROW][C]-1426.7713301824[/C][/ROW]
[ROW][C]-632.420604041167[/C][/ROW]
[ROW][C]864.413880643712[/C][/ROW]
[ROW][C]309.170626169259[/C][/ROW]
[ROW][C]115.726401589987[/C][/ROW]
[ROW][C]-842.51311475509[/C][/ROW]
[ROW][C]-3575.79754337789[/C][/ROW]
[ROW][C]990.52698866533[/C][/ROW]
[ROW][C]-1156.65522606141[/C][/ROW]
[ROW][C]2248.41085896986[/C][/ROW]
[ROW][C]2273.59566675953[/C][/ROW]
[ROW][C]244.244411121187[/C][/ROW]
[ROW][C]-4814.29556035879[/C][/ROW]
[ROW][C]-2313.38871327012[/C][/ROW]
[ROW][C]-525.657805395579[/C][/ROW]
[ROW][C]-4173.44111510558[/C][/ROW]
[ROW][C]-1463.60575628692[/C][/ROW]
[ROW][C]-2913.65038155836[/C][/ROW]
[ROW][C]6643.47345176528[/C][/ROW]
[ROW][C]-2381.08348086148[/C][/ROW]
[ROW][C]-915.719655112186[/C][/ROW]
[ROW][C]776.592505819336[/C][/ROW]
[ROW][C]-3582.70433653836[/C][/ROW]
[ROW][C]-2772.30610080798[/C][/ROW]
[ROW][C]-1866.27247064645[/C][/ROW]
[ROW][C]-843.463543096172[/C][/ROW]
[ROW][C]-5789.75111125196[/C][/ROW]
[ROW][C]4556.70705141341[/C][/ROW]
[ROW][C]1768.41014058929[/C][/ROW]
[ROW][C]5565.96574389044[/C][/ROW]
[ROW][C]942.664929981161[/C][/ROW]
[ROW][C]1064.83210667104[/C][/ROW]
[ROW][C]-353.039572747195[/C][/ROW]
[ROW][C]1747.49254992533[/C][/ROW]
[ROW][C]-3052.63985294052[/C][/ROW]
[ROW][C]4098.19079787151[/C][/ROW]
[ROW][C]-3267.73152924246[/C][/ROW]
[ROW][C]-2042.94261846488[/C][/ROW]
[ROW][C]1338.41496215816[/C][/ROW]
[ROW][C]2171.50321673153[/C][/ROW]
[ROW][C]5688.80382288017[/C][/ROW]
[/TABLE]
Source: https://freestatistics.org/blog/index.php?pk=31721&T=2

Globally Unique Identifier (entire table): ba.freestatistics.org/blog/index.php?pk=31721&T=2

As an alternative you can also use a QR Code:  

The GUIDs for individual cells are displayed in the table below:

Estimated ARIMA Residuals
Value
-391.065212849852
882.580096678144
-654.196965758033
1148.36472918591
831.805674530045
-499.368218613105
-71.9376529715412
1643.60752886361
7861.33446127487
-6334.71431242082
-1637.49766664867
395.518525005844
6155.13884607858
1152.50629859505
-576.016355483729
-1297.98564981457
-1461.90725930116
-146.451669126676
-521.953079473839
3172.00518233227
2852.61837036763
-3749.58535590759
-669.204332297215
-2383.81664236380
118.563334879994
1962.32317272189
137.495512971553
653.393694446455
-2733.28013280259
-1785.94637530956
-476.809028511811
289.079272243204
-2181.28895194848
-573.903585516959
178.095510373861
-2037.35013981804
35.1010912156396
-3431.99812108978
-3455.84775018342
-361.244801799057
2401.35203377101
312.024742300138
126.234929440299
-1202.58667430050
-1426.7713301824
-632.420604041167
864.413880643712
309.170626169259
115.726401589987
-842.51311475509
-3575.79754337789
990.52698866533
-1156.65522606141
2248.41085896986
2273.59566675953
244.244411121187
-4814.29556035879
-2313.38871327012
-525.657805395579
-4173.44111510558
-1463.60575628692
-2913.65038155836
6643.47345176528
-2381.08348086148
-915.719655112186
776.592505819336
-3582.70433653836
-2772.30610080798
-1866.27247064645
-843.463543096172
-5789.75111125196
4556.70705141341
1768.41014058929
5565.96574389044
942.664929981161
1064.83210667104
-353.039572747195
1747.49254992533
-3052.63985294052
4098.19079787151
-3267.73152924246
-2042.94261846488
1338.41496215816
2171.50321673153
5688.80382288017


Parameters (Session):
par1 = FALSE ; par2 = 1 ; par3 = 1 ; par4 = 1 ; par5 = 12 ; par6 = 3 ; par7 = 1 ; par8 = 2 ; par9 = 1 ;
Parameters (R input):
par1 = FALSE ; par2 = 1 ; par3 = 1 ; par4 = 1 ; par5 = 12 ; par6 = 3 ; par7 = 1 ; par8 = 2 ; par9 = 1 ;
R code (references can be found in the software module):
library(lattice)
if (par1 == 'TRUE') par1 <- TRUE
if (par1 == 'FALSE') par1 <- FALSE
par2 <- as.numeric(par2) #Box-Cox lambda transformation parameter
par3 <- as.numeric(par3) #degree of non-seasonal differencing
par4 <- as.numeric(par4) #degree of seasonal differencing
par5 <- as.numeric(par5) #seasonal period
par6 <- as.numeric(par6) #degree (p) of the non-seasonal AR(p) polynomial
par7 <- as.numeric(par7) #degree (q) of the non-seasonal MA(q) polynomial
par8 <- as.numeric(par8) #degree (P) of the seasonal AR(P) polynomial
par9 <- as.numeric(par9) #degree (Q) of the seasonal MA(Q) polynomial
armaGR <- function(arima.out, names, n){
try1 <- arima.out$coef
try2 <- sqrt(diag(arima.out$var.coef))
try.data.frame <- data.frame(matrix(NA,ncol=4,nrow=length(names)))
dimnames(try.data.frame) <- list(names,c('coef','std','tstat','pv'))
try.data.frame[,1] <- try1
for(i in 1:length(try2)) try.data.frame[which(rownames(try.data.frame)==names(try2)[i]),2] <- try2[i]
try.data.frame[,3] <- try.data.frame[,1] / try.data.frame[,2]
try.data.frame[,4] <- round((1-pt(abs(try.data.frame[,3]),df=n-(length(try2)+1)))*2,5)
vector <- rep(NA,length(names))
vector[is.na(try.data.frame[,4])] <- 0
maxi <- which.max(try.data.frame[,4])
continue <- max(try.data.frame[,4],na.rm=TRUE) > .05
vector[maxi] <- 0
list(summary=try.data.frame,next.vector=vector,continue=continue)
}
arimaSelect <- function(series, order=c(13,0,0), seasonal=list(order=c(2,0,0),period=12), include.mean=F){
nrc <- order[1]+order[3]+seasonal$order[1]+seasonal$order[3]
coeff <- matrix(NA, nrow=nrc*2, ncol=nrc)
pval <- matrix(NA, nrow=nrc*2, ncol=nrc)
mylist <- rep(list(NULL), nrc)
names <- NULL
if(order[1] > 0) names <- paste('ar',1:order[1],sep='')
if(order[3] > 0) names <- c( names , paste('ma',1:order[3],sep='') )
if(seasonal$order[1] > 0) names <- c(names, paste('sar',1:seasonal$order[1],sep=''))
if(seasonal$order[3] > 0) names <- c(names, paste('sma',1:seasonal$order[3],sep=''))
arima.out <- arima(series, order=order, seasonal=seasonal, include.mean=include.mean, method='ML')
mylist[[1]] <- arima.out
last.arma <- armaGR(arima.out, names, length(series))
mystop <- FALSE
i <- 1
coeff[i,] <- last.arma[[1]][,1]
pval [i,] <- last.arma[[1]][,4]
i <- 2
aic <- arima.out$aic
while(!mystop){
mylist[[i]] <- arima.out
arima.out <- arima(series, order=order, seasonal=seasonal, include.mean=include.mean, method='ML', fixed=last.arma$next.vector)
aic <- c(aic, arima.out$aic)
last.arma <- armaGR(arima.out, names, length(series))
mystop <- !last.arma$continue
coeff[i,] <- last.arma[[1]][,1]
pval [i,] <- last.arma[[1]][,4]
i <- i+1
}
list(coeff, pval, mylist, aic=aic)
}
arimaSelectplot <- function(arimaSelect.out,noms,choix){
noms <- names(arimaSelect.out[[3]][[1]]$coef)
coeff <- arimaSelect.out[[1]]
k <- min(which(is.na(coeff[,1])))-1
coeff <- coeff[1:k,]
pval <- arimaSelect.out[[2]][1:k,]
aic <- arimaSelect.out$aic[1:k]
coeff[coeff==0] <- NA
n <- ncol(coeff)
if(missing(choix)) choix <- k
layout(matrix(c(1,1,1,2,
3,3,3,2,
3,3,3,4,
5,6,7,7),nr=4),
widths=c(10,35,45,15),
heights=c(30,30,15,15))
couleurs <- rainbow(75)[1:50]#(50)
ticks <- pretty(coeff)
par(mar=c(1,1,3,1))
plot(aic,k:1-.5,type='o',pch=21,bg='blue',cex=2,axes=F,lty=2,xpd=NA)
points(aic[choix],k-choix+.5,pch=21,cex=4,bg=2,xpd=NA)
title('aic',line=2)
par(mar=c(3,0,0,0))
plot(0,axes=F,xlab='',ylab='',xlim=range(ticks),ylim=c(.1,1))
rect(xleft = min(ticks) + (0:49)/50*(max(ticks)-min(ticks)),
xright = min(ticks) + (1:50)/50*(max(ticks)-min(ticks)),
ytop = rep(1,50),
ybottom= rep(0,50),col=couleurs,border=NA)
axis(1,ticks)
rect(xleft=min(ticks),xright=max(ticks),ytop=1,ybottom=0)
text(mean(coeff,na.rm=T),.5,'coefficients',cex=2,font=2)
par(mar=c(1,1,3,1))
image(1:n,1:k,t(coeff[k:1,]),axes=F,col=couleurs,zlim=range(ticks))
for(i in 1:n) for(j in 1:k) if(!is.na(coeff[j,i])) {
if(pval[j,i]<.01) symb = 'green'
else if( (pval[j,i]<.05) & (pval[j,i]>=.01)) symb = 'orange'
else if( (pval[j,i]<.1) & (pval[j,i]>=.05)) symb = 'red'
else symb = 'black'
polygon(c(i+.5 ,i+.2 ,i+.5 ,i+.5),
c(k-j+0.5,k-j+0.5,k-j+0.8,k-j+0.5),
col=symb)
if(j==choix) {
rect(xleft=i-.5,
xright=i+.5,
ybottom=k-j+1.5,
ytop=k-j+.5,
lwd=4)
text(i,
k-j+1,
round(coeff[j,i],2),
cex=1.2,
font=2)
}
else{
rect(xleft=i-.5,xright=i+.5,ybottom=k-j+1.5,ytop=k-j+.5)
text(i,k-j+1,round(coeff[j,i],2),cex=1.2,font=1)
}
}
axis(3,1:n,noms)
par(mar=c(0.5,0,0,0.5))
plot(0,axes=F,xlab='',ylab='',type='n',xlim=c(0,8),ylim=c(-.2,.8))
cols <- c('green','orange','red','black')
niv <- c('0','0.01','0.05','0.1')
for(i in 0:3){
polygon(c(1+2*i ,1+2*i ,1+2*i-.5 ,1+2*i),
c(.4 ,.7 , .4 , .4),
col=cols[i+1])
text(2*i,0.5,niv[i+1],cex=1.5)
}
text(8,.5,1,cex=1.5)
text(4,0,'p-value',cex=2)
box()
residus <- arimaSelect.out[[3]][[choix]]$res
par(mar=c(1,2,4,1))
acf(residus,main='')
title('acf',line=.5)
par(mar=c(1,2,4,1))
pacf(residus,main='')
title('pacf',line=.5)
par(mar=c(2,2,4,1))
qqnorm(residus,main='')
title('qq-norm',line=.5)
qqline(residus)
residus
}
if (par2 == 0) x <- log(x)
if (par2 != 0) x <- x^par2
(selection <- arimaSelect(x, order=c(par6,par3,par7), seasonal=list(order=c(par8,par4,par9), period=par5)))
bitmap(file='test1.png')
resid <- arimaSelectplot(selection)
dev.off()
resid
bitmap(file='test2.png')
acf(resid,length(resid)/2, main='Residual Autocorrelation Function')
dev.off()
bitmap(file='test3.png')
pacf(resid,length(resid)/2, main='Residual Partial Autocorrelation Function')
dev.off()
bitmap(file='test4.png')
cpgram(resid, main='Residual Cumulative Periodogram')
dev.off()
bitmap(file='test5.png')
hist(resid, main='Residual Histogram', xlab='values of Residuals')
dev.off()
bitmap(file='test6.png')
densityplot(~resid,col='black',main='Residual Density Plot', xlab='values of Residuals')
dev.off()
bitmap(file='test7.png')
qqnorm(resid, main='Residual Normal Q-Q Plot')
qqline(resid)
dev.off()
ncols <- length(selection[[1]][1,])
nrows <- length(selection[[2]][,1])-1
load(file='createtable')
a<-table.start()
a<-table.row.start(a)
a<-table.element(a,'ARIMA Parameter Estimation and Backward Selection', ncols+1,TRUE)
a<-table.row.end(a)
a<-table.row.start(a)
a<-table.element(a,'Iteration', header=TRUE)
for (i in 1:ncols) {
a<-table.element(a,names(selection[[3]][[1]]$coef)[i],header=TRUE)
}
a<-table.row.end(a)
for (j in 1:nrows) {
a<-table.row.start(a)
mydum <- 'Estimates ('
mydum <- paste(mydum,j)
mydum <- paste(mydum,')')
a<-table.element(a,mydum, header=TRUE)
for (i in 1:ncols) {
a<-table.element(a,round(selection[[1]][j,i],4))
}
a<-table.row.end(a)
a<-table.row.start(a)
a<-table.element(a,'(p-val)', header=TRUE)
for (i in 1:ncols) {
mydum <- '('
mydum <- paste(mydum,round(selection[[2]][j,i],4),sep='')
mydum <- paste(mydum,')')
a<-table.element(a,mydum)
}
a<-table.row.end(a)
}
a<-table.end(a)
table.save(a,file='mytable.tab')
a<-table.start()
a<-table.row.start(a)
a<-table.element(a,'Estimated ARIMA Residuals', 1,TRUE)
a<-table.row.end(a)
a<-table.row.start(a)
a<-table.element(a,'Value', 1,TRUE)
a<-table.row.end(a)
for (i in (par4*par5+par3):length(resid)) {
a<-table.row.start(a)
a<-table.element(a,resid[i])
a<-table.row.end(a)
}
a<-table.end(a)
table.save(a,file='mytable1.tab')