Free Statistics

of Irreproducible Research!

Author's title

Author*The author of this computation has been verified*
R Software Modulerwasp_autocorrelation.wasp
Title produced by software(Partial) Autocorrelation Function
Date of computationTue, 09 Dec 2008 10:04:54 -0700
Cite this page as followsStatistical Computations at FreeStatistics.org, Office for Research Development and Education, URL https://freestatistics.org/blog/index.php?v=date/2008/Dec/09/t12288423513kz3s1cy6sal0z8.htm/, Retrieved Sat, 25 May 2024 08:54:36 +0000
Statistical Computations at FreeStatistics.org, Office for Research Development and Education, URL https://freestatistics.org/blog/index.php?pk=31587, Retrieved Sat, 25 May 2024 08:54:36 +0000
QR Codes:

Original text written by user:
IsPrivate?No (this computation is public)
User-defined keywordsARIMA , stap 4 , eigen tijdreeks , ACF
Estimated Impact171
Family? (F = Feedback message, R = changed R code, M = changed R Module, P = changed Parameters, D = changed Data)
-     [(Partial) Autocorrelation Function] [loïqueverhasselt] [2008-12-09 14:01:12] [0e879b146665902680dd148a904a2646]
-   P     [(Partial) Autocorrelation Function] [loïqueverhasselt] [2008-12-09 17:04:54] [6440ec5a21e5d35520cb2ae6b4b70e45] [Current]
Feedback Forum

Post a new message
Dataseries X:
99.4
97.5
94.6
92.6
92.5
89.8
88.8
87.4
85.2
83.1
84.7
84.8
85.8
86.3
89
89
89.3
91.9
94.9
94.4
96.8
96.9
98
97.9
100.9
103.9
103.1
102.5
104.3
102.6
101.7
102.8
105.4
110.9
113.5
116.3
124
128.8
133.5
132.6
128.4
127.3
126.7
123.3
123.2
124.4
128.2
128.7
135.7
139
145.4
142.4
137.7
137
137.1
139.3
139.6
140.4
142.3
148.3


Summary of computational transaction
Raw Inputview raw input (R code)
Raw Outputview raw output of R engine
Computing time1 seconds
R Server'George Udny Yule' @ 72.249.76.132

\begin{tabular}{lllllllll}
\hline
Summary of computational transaction \tabularnewline
Raw Input & view raw input (R code)  \tabularnewline
Raw Output & view raw output of R engine  \tabularnewline
Computing time & 1 seconds \tabularnewline
R Server & 'George Udny Yule' @ 72.249.76.132 \tabularnewline
\hline
\end{tabular}
%Source: https://freestatistics.org/blog/index.php?pk=31587&T=0

[TABLE]
[ROW][C]Summary of computational transaction[/C][/ROW]
[ROW][C]Raw Input[/C][C]view raw input (R code) [/C][/ROW]
[ROW][C]Raw Output[/C][C]view raw output of R engine [/C][/ROW]
[ROW][C]Computing time[/C][C]1 seconds[/C][/ROW]
[ROW][C]R Server[/C][C]'George Udny Yule' @ 72.249.76.132[/C][/ROW]
[/TABLE]
Source: https://freestatistics.org/blog/index.php?pk=31587&T=0

Globally Unique Identifier (entire table): ba.freestatistics.org/blog/index.php?pk=31587&T=0

As an alternative you can also use a QR Code:  

The GUIDs for individual cells are displayed in the table below:

Summary of computational transaction
Raw Inputview raw input (R code)
Raw Outputview raw output of R engine
Computing time1 seconds
R Server'George Udny Yule' @ 72.249.76.132


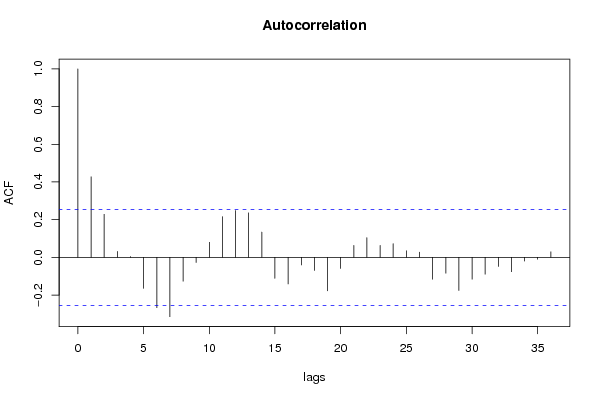
Autocorrelation Function
Time lag kACF(k)T-STATP-value
10.4273553.28260.000866
20.2286991.75670.042081
30.0313560.24080.405255
40.0042120.03240.487149
5-0.164323-1.26220.105924
6-0.26718-2.05230.022295
7-0.314922-2.4190.009334
8-0.126778-0.97380.167065
9-0.027021-0.20750.418148
100.0800190.61460.270578
110.2159071.65840.051271
120.2480131.9050.030827
130.2360011.81280.037479
140.1338131.02780.15411
15-0.111142-0.85370.198362
16-0.141461-1.08660.14082
17-0.040187-0.30870.379326
18-0.06979-0.53610.296965
19-0.177559-1.36390.088897
20-0.059285-0.45540.325256
210.0634650.48750.313862
220.1039930.79880.213809
230.0630960.48470.314859
240.0723060.55540.290363
250.0348170.26740.395034
260.0272210.20910.417551
27-0.116354-0.89370.187548
28-0.083982-0.64510.260688
29-0.175534-1.34830.091357
30-0.116339-0.89360.187579
31-0.089528-0.68770.247176
32-0.048497-0.37250.355422
33-0.076245-0.58560.280173
34-0.020102-0.15440.438908
35-0.009661-0.07420.470548
360.0290650.22330.412054

\begin{tabular}{lllllllll}
\hline
Autocorrelation Function \tabularnewline
Time lag k & ACF(k) & T-STAT & P-value \tabularnewline
1 & 0.427355 & 3.2826 & 0.000866 \tabularnewline
2 & 0.228699 & 1.7567 & 0.042081 \tabularnewline
3 & 0.031356 & 0.2408 & 0.405255 \tabularnewline
4 & 0.004212 & 0.0324 & 0.487149 \tabularnewline
5 & -0.164323 & -1.2622 & 0.105924 \tabularnewline
6 & -0.26718 & -2.0523 & 0.022295 \tabularnewline
7 & -0.314922 & -2.419 & 0.009334 \tabularnewline
8 & -0.126778 & -0.9738 & 0.167065 \tabularnewline
9 & -0.027021 & -0.2075 & 0.418148 \tabularnewline
10 & 0.080019 & 0.6146 & 0.270578 \tabularnewline
11 & 0.215907 & 1.6584 & 0.051271 \tabularnewline
12 & 0.248013 & 1.905 & 0.030827 \tabularnewline
13 & 0.236001 & 1.8128 & 0.037479 \tabularnewline
14 & 0.133813 & 1.0278 & 0.15411 \tabularnewline
15 & -0.111142 & -0.8537 & 0.198362 \tabularnewline
16 & -0.141461 & -1.0866 & 0.14082 \tabularnewline
17 & -0.040187 & -0.3087 & 0.379326 \tabularnewline
18 & -0.06979 & -0.5361 & 0.296965 \tabularnewline
19 & -0.177559 & -1.3639 & 0.088897 \tabularnewline
20 & -0.059285 & -0.4554 & 0.325256 \tabularnewline
21 & 0.063465 & 0.4875 & 0.313862 \tabularnewline
22 & 0.103993 & 0.7988 & 0.213809 \tabularnewline
23 & 0.063096 & 0.4847 & 0.314859 \tabularnewline
24 & 0.072306 & 0.5554 & 0.290363 \tabularnewline
25 & 0.034817 & 0.2674 & 0.395034 \tabularnewline
26 & 0.027221 & 0.2091 & 0.417551 \tabularnewline
27 & -0.116354 & -0.8937 & 0.187548 \tabularnewline
28 & -0.083982 & -0.6451 & 0.260688 \tabularnewline
29 & -0.175534 & -1.3483 & 0.091357 \tabularnewline
30 & -0.116339 & -0.8936 & 0.187579 \tabularnewline
31 & -0.089528 & -0.6877 & 0.247176 \tabularnewline
32 & -0.048497 & -0.3725 & 0.355422 \tabularnewline
33 & -0.076245 & -0.5856 & 0.280173 \tabularnewline
34 & -0.020102 & -0.1544 & 0.438908 \tabularnewline
35 & -0.009661 & -0.0742 & 0.470548 \tabularnewline
36 & 0.029065 & 0.2233 & 0.412054 \tabularnewline
\hline
\end{tabular}
%Source: https://freestatistics.org/blog/index.php?pk=31587&T=1

[TABLE]
[ROW][C]Autocorrelation Function[/C][/ROW]
[ROW][C]Time lag k[/C][C]ACF(k)[/C][C]T-STAT[/C][C]P-value[/C][/ROW]
[ROW][C]1[/C][C]0.427355[/C][C]3.2826[/C][C]0.000866[/C][/ROW]
[ROW][C]2[/C][C]0.228699[/C][C]1.7567[/C][C]0.042081[/C][/ROW]
[ROW][C]3[/C][C]0.031356[/C][C]0.2408[/C][C]0.405255[/C][/ROW]
[ROW][C]4[/C][C]0.004212[/C][C]0.0324[/C][C]0.487149[/C][/ROW]
[ROW][C]5[/C][C]-0.164323[/C][C]-1.2622[/C][C]0.105924[/C][/ROW]
[ROW][C]6[/C][C]-0.26718[/C][C]-2.0523[/C][C]0.022295[/C][/ROW]
[ROW][C]7[/C][C]-0.314922[/C][C]-2.419[/C][C]0.009334[/C][/ROW]
[ROW][C]8[/C][C]-0.126778[/C][C]-0.9738[/C][C]0.167065[/C][/ROW]
[ROW][C]9[/C][C]-0.027021[/C][C]-0.2075[/C][C]0.418148[/C][/ROW]
[ROW][C]10[/C][C]0.080019[/C][C]0.6146[/C][C]0.270578[/C][/ROW]
[ROW][C]11[/C][C]0.215907[/C][C]1.6584[/C][C]0.051271[/C][/ROW]
[ROW][C]12[/C][C]0.248013[/C][C]1.905[/C][C]0.030827[/C][/ROW]
[ROW][C]13[/C][C]0.236001[/C][C]1.8128[/C][C]0.037479[/C][/ROW]
[ROW][C]14[/C][C]0.133813[/C][C]1.0278[/C][C]0.15411[/C][/ROW]
[ROW][C]15[/C][C]-0.111142[/C][C]-0.8537[/C][C]0.198362[/C][/ROW]
[ROW][C]16[/C][C]-0.141461[/C][C]-1.0866[/C][C]0.14082[/C][/ROW]
[ROW][C]17[/C][C]-0.040187[/C][C]-0.3087[/C][C]0.379326[/C][/ROW]
[ROW][C]18[/C][C]-0.06979[/C][C]-0.5361[/C][C]0.296965[/C][/ROW]
[ROW][C]19[/C][C]-0.177559[/C][C]-1.3639[/C][C]0.088897[/C][/ROW]
[ROW][C]20[/C][C]-0.059285[/C][C]-0.4554[/C][C]0.325256[/C][/ROW]
[ROW][C]21[/C][C]0.063465[/C][C]0.4875[/C][C]0.313862[/C][/ROW]
[ROW][C]22[/C][C]0.103993[/C][C]0.7988[/C][C]0.213809[/C][/ROW]
[ROW][C]23[/C][C]0.063096[/C][C]0.4847[/C][C]0.314859[/C][/ROW]
[ROW][C]24[/C][C]0.072306[/C][C]0.5554[/C][C]0.290363[/C][/ROW]
[ROW][C]25[/C][C]0.034817[/C][C]0.2674[/C][C]0.395034[/C][/ROW]
[ROW][C]26[/C][C]0.027221[/C][C]0.2091[/C][C]0.417551[/C][/ROW]
[ROW][C]27[/C][C]-0.116354[/C][C]-0.8937[/C][C]0.187548[/C][/ROW]
[ROW][C]28[/C][C]-0.083982[/C][C]-0.6451[/C][C]0.260688[/C][/ROW]
[ROW][C]29[/C][C]-0.175534[/C][C]-1.3483[/C][C]0.091357[/C][/ROW]
[ROW][C]30[/C][C]-0.116339[/C][C]-0.8936[/C][C]0.187579[/C][/ROW]
[ROW][C]31[/C][C]-0.089528[/C][C]-0.6877[/C][C]0.247176[/C][/ROW]
[ROW][C]32[/C][C]-0.048497[/C][C]-0.3725[/C][C]0.355422[/C][/ROW]
[ROW][C]33[/C][C]-0.076245[/C][C]-0.5856[/C][C]0.280173[/C][/ROW]
[ROW][C]34[/C][C]-0.020102[/C][C]-0.1544[/C][C]0.438908[/C][/ROW]
[ROW][C]35[/C][C]-0.009661[/C][C]-0.0742[/C][C]0.470548[/C][/ROW]
[ROW][C]36[/C][C]0.029065[/C][C]0.2233[/C][C]0.412054[/C][/ROW]
[/TABLE]
Source: https://freestatistics.org/blog/index.php?pk=31587&T=1

Globally Unique Identifier (entire table): ba.freestatistics.org/blog/index.php?pk=31587&T=1

As an alternative you can also use a QR Code:  

The GUIDs for individual cells are displayed in the table below:

Autocorrelation Function
Time lag kACF(k)T-STATP-value
10.4273553.28260.000866
20.2286991.75670.042081
30.0313560.24080.405255
40.0042120.03240.487149
5-0.164323-1.26220.105924
6-0.26718-2.05230.022295
7-0.314922-2.4190.009334
8-0.126778-0.97380.167065
9-0.027021-0.20750.418148
100.0800190.61460.270578
110.2159071.65840.051271
120.2480131.9050.030827
130.2360011.81280.037479
140.1338131.02780.15411
15-0.111142-0.85370.198362
16-0.141461-1.08660.14082
17-0.040187-0.30870.379326
18-0.06979-0.53610.296965
19-0.177559-1.36390.088897
20-0.059285-0.45540.325256
210.0634650.48750.313862
220.1039930.79880.213809
230.0630960.48470.314859
240.0723060.55540.290363
250.0348170.26740.395034
260.0272210.20910.417551
27-0.116354-0.89370.187548
28-0.083982-0.64510.260688
29-0.175534-1.34830.091357
30-0.116339-0.89360.187579
31-0.089528-0.68770.247176
32-0.048497-0.37250.355422
33-0.076245-0.58560.280173
34-0.020102-0.15440.438908
35-0.009661-0.07420.470548
360.0290650.22330.412054


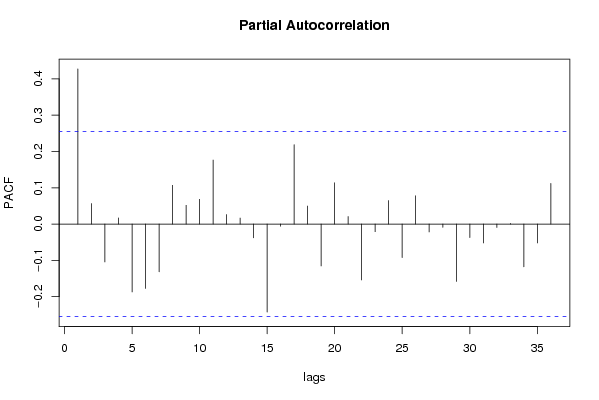
Partial Autocorrelation Function
Time lag kPACF(k)T-STATP-value
10.4273553.28260.000866
20.056360.43290.333329
3-0.104272-0.80090.213194
40.0166740.12810.449261
5-0.187177-1.43770.077896
6-0.177456-1.36310.08902
7-0.131508-1.01010.158278
80.1067370.81990.207797
90.0514520.39520.347057
100.068260.52430.301013
110.176371.35470.090336
120.0262960.2020.420312
130.016580.12740.449548
14-0.038016-0.2920.385653
15-0.242479-1.86250.033756
16-0.00574-0.04410.48249
170.2186471.67950.049175
180.0494950.38020.352589
19-0.115385-0.88630.18953
200.1136330.87280.193146
210.0207530.15940.436946
22-0.153923-1.18230.120914
23-0.021086-0.1620.435945
240.064640.49650.310689
25-0.092522-0.71070.240043
260.0776910.59680.276476
27-0.021874-0.1680.433572
28-0.009125-0.07010.472178
29-0.158153-1.21480.114641
30-0.037331-0.28670.387656
31-0.05208-0.40.345289
32-0.009313-0.07150.471607
330.0016650.01280.494919
34-0.117854-0.90530.184507
35-0.052229-0.40120.344868
360.1120250.86050.196504

\begin{tabular}{lllllllll}
\hline
Partial Autocorrelation Function \tabularnewline
Time lag k & PACF(k) & T-STAT & P-value \tabularnewline
1 & 0.427355 & 3.2826 & 0.000866 \tabularnewline
2 & 0.05636 & 0.4329 & 0.333329 \tabularnewline
3 & -0.104272 & -0.8009 & 0.213194 \tabularnewline
4 & 0.016674 & 0.1281 & 0.449261 \tabularnewline
5 & -0.187177 & -1.4377 & 0.077896 \tabularnewline
6 & -0.177456 & -1.3631 & 0.08902 \tabularnewline
7 & -0.131508 & -1.0101 & 0.158278 \tabularnewline
8 & 0.106737 & 0.8199 & 0.207797 \tabularnewline
9 & 0.051452 & 0.3952 & 0.347057 \tabularnewline
10 & 0.06826 & 0.5243 & 0.301013 \tabularnewline
11 & 0.17637 & 1.3547 & 0.090336 \tabularnewline
12 & 0.026296 & 0.202 & 0.420312 \tabularnewline
13 & 0.01658 & 0.1274 & 0.449548 \tabularnewline
14 & -0.038016 & -0.292 & 0.385653 \tabularnewline
15 & -0.242479 & -1.8625 & 0.033756 \tabularnewline
16 & -0.00574 & -0.0441 & 0.48249 \tabularnewline
17 & 0.218647 & 1.6795 & 0.049175 \tabularnewline
18 & 0.049495 & 0.3802 & 0.352589 \tabularnewline
19 & -0.115385 & -0.8863 & 0.18953 \tabularnewline
20 & 0.113633 & 0.8728 & 0.193146 \tabularnewline
21 & 0.020753 & 0.1594 & 0.436946 \tabularnewline
22 & -0.153923 & -1.1823 & 0.120914 \tabularnewline
23 & -0.021086 & -0.162 & 0.435945 \tabularnewline
24 & 0.06464 & 0.4965 & 0.310689 \tabularnewline
25 & -0.092522 & -0.7107 & 0.240043 \tabularnewline
26 & 0.077691 & 0.5968 & 0.276476 \tabularnewline
27 & -0.021874 & -0.168 & 0.433572 \tabularnewline
28 & -0.009125 & -0.0701 & 0.472178 \tabularnewline
29 & -0.158153 & -1.2148 & 0.114641 \tabularnewline
30 & -0.037331 & -0.2867 & 0.387656 \tabularnewline
31 & -0.05208 & -0.4 & 0.345289 \tabularnewline
32 & -0.009313 & -0.0715 & 0.471607 \tabularnewline
33 & 0.001665 & 0.0128 & 0.494919 \tabularnewline
34 & -0.117854 & -0.9053 & 0.184507 \tabularnewline
35 & -0.052229 & -0.4012 & 0.344868 \tabularnewline
36 & 0.112025 & 0.8605 & 0.196504 \tabularnewline
\hline
\end{tabular}
%Source: https://freestatistics.org/blog/index.php?pk=31587&T=2

[TABLE]
[ROW][C]Partial Autocorrelation Function[/C][/ROW]
[ROW][C]Time lag k[/C][C]PACF(k)[/C][C]T-STAT[/C][C]P-value[/C][/ROW]
[ROW][C]1[/C][C]0.427355[/C][C]3.2826[/C][C]0.000866[/C][/ROW]
[ROW][C]2[/C][C]0.05636[/C][C]0.4329[/C][C]0.333329[/C][/ROW]
[ROW][C]3[/C][C]-0.104272[/C][C]-0.8009[/C][C]0.213194[/C][/ROW]
[ROW][C]4[/C][C]0.016674[/C][C]0.1281[/C][C]0.449261[/C][/ROW]
[ROW][C]5[/C][C]-0.187177[/C][C]-1.4377[/C][C]0.077896[/C][/ROW]
[ROW][C]6[/C][C]-0.177456[/C][C]-1.3631[/C][C]0.08902[/C][/ROW]
[ROW][C]7[/C][C]-0.131508[/C][C]-1.0101[/C][C]0.158278[/C][/ROW]
[ROW][C]8[/C][C]0.106737[/C][C]0.8199[/C][C]0.207797[/C][/ROW]
[ROW][C]9[/C][C]0.051452[/C][C]0.3952[/C][C]0.347057[/C][/ROW]
[ROW][C]10[/C][C]0.06826[/C][C]0.5243[/C][C]0.301013[/C][/ROW]
[ROW][C]11[/C][C]0.17637[/C][C]1.3547[/C][C]0.090336[/C][/ROW]
[ROW][C]12[/C][C]0.026296[/C][C]0.202[/C][C]0.420312[/C][/ROW]
[ROW][C]13[/C][C]0.01658[/C][C]0.1274[/C][C]0.449548[/C][/ROW]
[ROW][C]14[/C][C]-0.038016[/C][C]-0.292[/C][C]0.385653[/C][/ROW]
[ROW][C]15[/C][C]-0.242479[/C][C]-1.8625[/C][C]0.033756[/C][/ROW]
[ROW][C]16[/C][C]-0.00574[/C][C]-0.0441[/C][C]0.48249[/C][/ROW]
[ROW][C]17[/C][C]0.218647[/C][C]1.6795[/C][C]0.049175[/C][/ROW]
[ROW][C]18[/C][C]0.049495[/C][C]0.3802[/C][C]0.352589[/C][/ROW]
[ROW][C]19[/C][C]-0.115385[/C][C]-0.8863[/C][C]0.18953[/C][/ROW]
[ROW][C]20[/C][C]0.113633[/C][C]0.8728[/C][C]0.193146[/C][/ROW]
[ROW][C]21[/C][C]0.020753[/C][C]0.1594[/C][C]0.436946[/C][/ROW]
[ROW][C]22[/C][C]-0.153923[/C][C]-1.1823[/C][C]0.120914[/C][/ROW]
[ROW][C]23[/C][C]-0.021086[/C][C]-0.162[/C][C]0.435945[/C][/ROW]
[ROW][C]24[/C][C]0.06464[/C][C]0.4965[/C][C]0.310689[/C][/ROW]
[ROW][C]25[/C][C]-0.092522[/C][C]-0.7107[/C][C]0.240043[/C][/ROW]
[ROW][C]26[/C][C]0.077691[/C][C]0.5968[/C][C]0.276476[/C][/ROW]
[ROW][C]27[/C][C]-0.021874[/C][C]-0.168[/C][C]0.433572[/C][/ROW]
[ROW][C]28[/C][C]-0.009125[/C][C]-0.0701[/C][C]0.472178[/C][/ROW]
[ROW][C]29[/C][C]-0.158153[/C][C]-1.2148[/C][C]0.114641[/C][/ROW]
[ROW][C]30[/C][C]-0.037331[/C][C]-0.2867[/C][C]0.387656[/C][/ROW]
[ROW][C]31[/C][C]-0.05208[/C][C]-0.4[/C][C]0.345289[/C][/ROW]
[ROW][C]32[/C][C]-0.009313[/C][C]-0.0715[/C][C]0.471607[/C][/ROW]
[ROW][C]33[/C][C]0.001665[/C][C]0.0128[/C][C]0.494919[/C][/ROW]
[ROW][C]34[/C][C]-0.117854[/C][C]-0.9053[/C][C]0.184507[/C][/ROW]
[ROW][C]35[/C][C]-0.052229[/C][C]-0.4012[/C][C]0.344868[/C][/ROW]
[ROW][C]36[/C][C]0.112025[/C][C]0.8605[/C][C]0.196504[/C][/ROW]
[/TABLE]
Source: https://freestatistics.org/blog/index.php?pk=31587&T=2

Globally Unique Identifier (entire table): ba.freestatistics.org/blog/index.php?pk=31587&T=2

As an alternative you can also use a QR Code:  

The GUIDs for individual cells are displayed in the table below:

Partial Autocorrelation Function
Time lag kPACF(k)T-STATP-value
10.4273553.28260.000866
20.056360.43290.333329
3-0.104272-0.80090.213194
40.0166740.12810.449261
5-0.187177-1.43770.077896
6-0.177456-1.36310.08902
7-0.131508-1.01010.158278
80.1067370.81990.207797
90.0514520.39520.347057
100.068260.52430.301013
110.176371.35470.090336
120.0262960.2020.420312
130.016580.12740.449548
14-0.038016-0.2920.385653
15-0.242479-1.86250.033756
16-0.00574-0.04410.48249
170.2186471.67950.049175
180.0494950.38020.352589
19-0.115385-0.88630.18953
200.1136330.87280.193146
210.0207530.15940.436946
22-0.153923-1.18230.120914
23-0.021086-0.1620.435945
240.064640.49650.310689
25-0.092522-0.71070.240043
260.0776910.59680.276476
27-0.021874-0.1680.433572
28-0.009125-0.07010.472178
29-0.158153-1.21480.114641
30-0.037331-0.28670.387656
31-0.05208-0.40.345289
32-0.009313-0.07150.471607
330.0016650.01280.494919
34-0.117854-0.90530.184507
35-0.052229-0.40120.344868
360.1120250.86050.196504


Parameters (Session):
par1 = 36 ; par2 = 1 ; par3 = 1 ; par4 = 0 ; par5 = 12 ;
Parameters (R input):
par1 = 36 ; par2 = 1 ; par3 = 1 ; par4 = 0 ; par5 = 12 ;
R code (references can be found in the software module):
if (par1 == 'Default') {
par1 = 10*log10(length(x))
} else {
par1 <- as.numeric(par1)
}
par2 <- as.numeric(par2)
par3 <- as.numeric(par3)
par4 <- as.numeric(par4)
par5 <- as.numeric(par5)
if (par2 == 0) {
x <- log(x)
} else {
x <- (x ^ par2 - 1) / par2
}
if (par3 > 0) x <- diff(x,lag=1,difference=par3)
if (par4 > 0) x <- diff(x,lag=par5,difference=par4)
bitmap(file='pic1.png')
racf <- acf(x,par1,main='Autocorrelation',xlab='lags',ylab='ACF')
dev.off()
bitmap(file='pic2.png')
rpacf <- pacf(x,par1,main='Partial Autocorrelation',xlab='lags',ylab='PACF')
dev.off()
(myacf <- c(racf$acf))
(mypacf <- c(rpacf$acf))
lengthx <- length(x)
sqrtn <- sqrt(lengthx)
load(file='createtable')
a<-table.start()
a<-table.row.start(a)
a<-table.element(a,'Autocorrelation Function',4,TRUE)
a<-table.row.end(a)
a<-table.row.start(a)
a<-table.element(a,'Time lag k',header=TRUE)
a<-table.element(a,hyperlink('basics.htm','ACF(k)','click here for more information about the Autocorrelation Function'),header=TRUE)
a<-table.element(a,'T-STAT',header=TRUE)
a<-table.element(a,'P-value',header=TRUE)
a<-table.row.end(a)
for (i in 2:(par1+1)) {
a<-table.row.start(a)
a<-table.element(a,i-1,header=TRUE)
a<-table.element(a,round(myacf[i],6))
mytstat <- myacf[i]*sqrtn
a<-table.element(a,round(mytstat,4))
a<-table.element(a,round(1-pt(abs(mytstat),lengthx),6))
a<-table.row.end(a)
}
a<-table.end(a)
table.save(a,file='mytable.tab')
a<-table.start()
a<-table.row.start(a)
a<-table.element(a,'Partial Autocorrelation Function',4,TRUE)
a<-table.row.end(a)
a<-table.row.start(a)
a<-table.element(a,'Time lag k',header=TRUE)
a<-table.element(a,hyperlink('basics.htm','PACF(k)','click here for more information about the Partial Autocorrelation Function'),header=TRUE)
a<-table.element(a,'T-STAT',header=TRUE)
a<-table.element(a,'P-value',header=TRUE)
a<-table.row.end(a)
for (i in 1:par1) {
a<-table.row.start(a)
a<-table.element(a,i,header=TRUE)
a<-table.element(a,round(mypacf[i],6))
mytstat <- mypacf[i]*sqrtn
a<-table.element(a,round(mytstat,4))
a<-table.element(a,round(1-pt(abs(mytstat),lengthx),6))
a<-table.row.end(a)
}
a<-table.end(a)
table.save(a,file='mytable1.tab')