Free Statistics

of Irreproducible Research!

Author's title

Author*Unverified author*
R Software Modulerwasp_autocorrelation.wasp
Title produced by software(Partial) Autocorrelation Function
Date of computationTue, 09 Dec 2008 04:12:23 -0700
Cite this page as followsStatistical Computations at FreeStatistics.org, Office for Research Development and Education, URL https://freestatistics.org/blog/index.php?v=date/2008/Dec/09/t1228821213oa42g8airu411kf.htm/, Retrieved Sat, 25 May 2024 01:14:38 +0000
Statistical Computations at FreeStatistics.org, Office for Research Development and Education, URL https://freestatistics.org/blog/index.php?pk=31296, Retrieved Sat, 25 May 2024 01:14:38 +0000
QR Codes:

Original text written by user:
IsPrivate?No (this computation is public)
User-defined keywords
Estimated Impact157
Family? (F = Feedback message, R = changed R code, M = changed R Module, P = changed Parameters, D = changed Data)
F     [(Partial) Autocorrelation Function] [] [2008-12-04 19:54:00] [03c8f0b5f6fe0fafd3d60ad5379ae7bd]
-   PD    [(Partial) Autocorrelation Function] [] [2008-12-09 11:12:23] [d41d8cd98f00b204e9800998ecf8427e] [Current]
Feedback Forum

Post a new message
Dataseries X:
41130
43144
46195
40033
31710
42297
33889
23495
27060
31160
22214
16905
34388
29982
36374
37630
31023
39875
28866
20205
26082
28209
22813
15296
27796
31813
42513
41222
29094
28948
23230
21308
20649
23666
19206
16361
30472
25051
39393
32091
31007
32998
22809
20439
19900
29161
22149
15485
36181
39545
37955
31854
29788
31435
22504
19540
21893
29556
21811
13729
31332
31434
38812
36154
32820
32301
30358
20724
21056
30077
22411
16758
37243
41795
37755
42557
21507
43211
31476
21440
25307
34050
21970
17327
33607
34259
43309
40189
32663
36262
35718
25002
28764
33085
25403
17468
39457
39408
49419
37128
34698
40939
32695
27523
26875
28460
26511
19576
40659
35685
44559
37584
34670
42953
24058
35359
30919
35346
28309
17417
45465
44651
47947
43458
37744
39730
29903
24284
37981
32001
32273
23314
43522
33000
43685
45838
39741
42522
37318
26920
28651
35646
26312
20442
46402
45329
42185
49341
50472
33020
29567
22870
25730
32609
23536
15135
36776
29982
38062
34226
24906
30233
27405
20784
22886
25425
20838
15655
37158
36364
43213
31635
30113
29985
20919
19429
21427
26064
20109
15369
35466
25954
33504
28115
28501
28618
21434
20177
21484
25642
23515
12941
36190
37785
38407
33326
30304
27576
27048
17291
21018
26792
19426
13927
35647
31746
31277
31583
25607
28151
24947
18077
23429
26313
18862
14753
36409
33163
34122
35225
28249
30374
26311
22069
23651
28628
23187
14727
43080
32519
39657
33614
28671
34243
27336
22916
24537
26128
22602
15744
41086
39690
43129
37863
35953
29133
24693
22205
21725
27192
21790
13253
37702
30364
32609
30212
29965
28352
25814
22414
20506
28806
22228
13971
36845
35338
35022
34777
26887
23970
22780
17351
21382
24561
17409
11514
31514
27071
29462
26105
22397
23843
21705
18089
20764
25316
17704
15548
28029
29383
36438
32034
22679
24319
18004
17537
20366
22782
19169
13807
29743
25591
29096
26482
22405
27044
17970
18730
19684
19785
18479
10698
31956
29506
34506
27165
26736
23691
18157
17328
18205
20995
17382
9367
31124
26551
30651
25859
25100
25778
20418
18688
20424
24776
19814
12738


Summary of computational transaction
Raw Inputview raw input (R code)
Raw Outputview raw output of R engine
Computing time2 seconds
R Server'Herman Ole Andreas Wold' @ 193.190.124.10:1001

\begin{tabular}{lllllllll}
\hline
Summary of computational transaction \tabularnewline
Raw Input & view raw input (R code)  \tabularnewline
Raw Output & view raw output of R engine  \tabularnewline
Computing time & 2 seconds \tabularnewline
R Server & 'Herman Ole Andreas Wold' @ 193.190.124.10:1001 \tabularnewline
\hline
\end{tabular}
%Source: https://freestatistics.org/blog/index.php?pk=31296&T=0

[TABLE]
[ROW][C]Summary of computational transaction[/C][/ROW]
[ROW][C]Raw Input[/C][C]view raw input (R code) [/C][/ROW]
[ROW][C]Raw Output[/C][C]view raw output of R engine [/C][/ROW]
[ROW][C]Computing time[/C][C]2 seconds[/C][/ROW]
[ROW][C]R Server[/C][C]'Herman Ole Andreas Wold' @ 193.190.124.10:1001[/C][/ROW]
[/TABLE]
Source: https://freestatistics.org/blog/index.php?pk=31296&T=0

Globally Unique Identifier (entire table): ba.freestatistics.org/blog/index.php?pk=31296&T=0

As an alternative you can also use a QR Code:  

The GUIDs for individual cells are displayed in the table below:

Summary of computational transaction
Raw Inputview raw input (R code)
Raw Outputview raw output of R engine
Computing time2 seconds
R Server'Herman Ole Andreas Wold' @ 193.190.124.10:1001


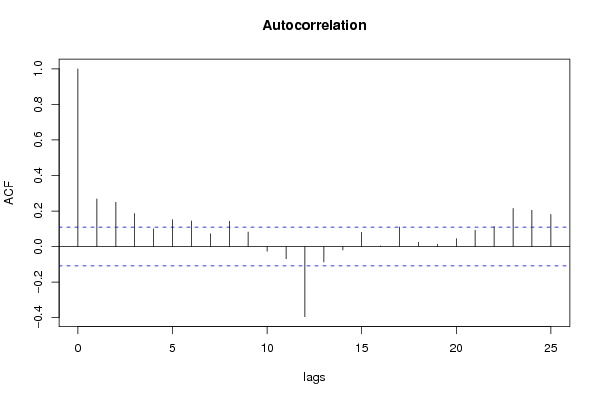
Autocorrelation Function
Time lag kACF(k)T-STATP-value
10.2680614.82511e-06
20.248954.48115e-06
30.185373.33670.000473
40.0990351.78260.037792
50.1513782.72480.003392
60.1443192.59770.004906
70.0715391.28770.099383
80.1427612.56970.005313
90.0814021.46520.071914
10-0.026116-0.47010.319303
11-0.068843-1.23920.10809
12-0.395053-7.11090
13-0.086827-1.56290.059527
14-0.019515-0.35130.362809
150.080281.4450.074707
160.0033710.06070.475826
170.1096031.97290.024681
180.0242130.43580.331626
190.0121580.21880.413454
200.0439870.79180.214537
210.0912681.64280.050695
220.1133232.03980.02109
230.2141213.85427e-05
240.2035573.6640.000145
250.1808733.25570.000625

\begin{tabular}{lllllllll}
\hline
Autocorrelation Function \tabularnewline
Time lag k & ACF(k) & T-STAT & P-value \tabularnewline
1 & 0.268061 & 4.8251 & 1e-06 \tabularnewline
2 & 0.24895 & 4.4811 & 5e-06 \tabularnewline
3 & 0.18537 & 3.3367 & 0.000473 \tabularnewline
4 & 0.099035 & 1.7826 & 0.037792 \tabularnewline
5 & 0.151378 & 2.7248 & 0.003392 \tabularnewline
6 & 0.144319 & 2.5977 & 0.004906 \tabularnewline
7 & 0.071539 & 1.2877 & 0.099383 \tabularnewline
8 & 0.142761 & 2.5697 & 0.005313 \tabularnewline
9 & 0.081402 & 1.4652 & 0.071914 \tabularnewline
10 & -0.026116 & -0.4701 & 0.319303 \tabularnewline
11 & -0.068843 & -1.2392 & 0.10809 \tabularnewline
12 & -0.395053 & -7.1109 & 0 \tabularnewline
13 & -0.086827 & -1.5629 & 0.059527 \tabularnewline
14 & -0.019515 & -0.3513 & 0.362809 \tabularnewline
15 & 0.08028 & 1.445 & 0.074707 \tabularnewline
16 & 0.003371 & 0.0607 & 0.475826 \tabularnewline
17 & 0.109603 & 1.9729 & 0.024681 \tabularnewline
18 & 0.024213 & 0.4358 & 0.331626 \tabularnewline
19 & 0.012158 & 0.2188 & 0.413454 \tabularnewline
20 & 0.043987 & 0.7918 & 0.214537 \tabularnewline
21 & 0.091268 & 1.6428 & 0.050695 \tabularnewline
22 & 0.113323 & 2.0398 & 0.02109 \tabularnewline
23 & 0.214121 & 3.8542 & 7e-05 \tabularnewline
24 & 0.203557 & 3.664 & 0.000145 \tabularnewline
25 & 0.180873 & 3.2557 & 0.000625 \tabularnewline
\hline
\end{tabular}
%Source: https://freestatistics.org/blog/index.php?pk=31296&T=1

[TABLE]
[ROW][C]Autocorrelation Function[/C][/ROW]
[ROW][C]Time lag k[/C][C]ACF(k)[/C][C]T-STAT[/C][C]P-value[/C][/ROW]
[ROW][C]1[/C][C]0.268061[/C][C]4.8251[/C][C]1e-06[/C][/ROW]
[ROW][C]2[/C][C]0.24895[/C][C]4.4811[/C][C]5e-06[/C][/ROW]
[ROW][C]3[/C][C]0.18537[/C][C]3.3367[/C][C]0.000473[/C][/ROW]
[ROW][C]4[/C][C]0.099035[/C][C]1.7826[/C][C]0.037792[/C][/ROW]
[ROW][C]5[/C][C]0.151378[/C][C]2.7248[/C][C]0.003392[/C][/ROW]
[ROW][C]6[/C][C]0.144319[/C][C]2.5977[/C][C]0.004906[/C][/ROW]
[ROW][C]7[/C][C]0.071539[/C][C]1.2877[/C][C]0.099383[/C][/ROW]
[ROW][C]8[/C][C]0.142761[/C][C]2.5697[/C][C]0.005313[/C][/ROW]
[ROW][C]9[/C][C]0.081402[/C][C]1.4652[/C][C]0.071914[/C][/ROW]
[ROW][C]10[/C][C]-0.026116[/C][C]-0.4701[/C][C]0.319303[/C][/ROW]
[ROW][C]11[/C][C]-0.068843[/C][C]-1.2392[/C][C]0.10809[/C][/ROW]
[ROW][C]12[/C][C]-0.395053[/C][C]-7.1109[/C][C]0[/C][/ROW]
[ROW][C]13[/C][C]-0.086827[/C][C]-1.5629[/C][C]0.059527[/C][/ROW]
[ROW][C]14[/C][C]-0.019515[/C][C]-0.3513[/C][C]0.362809[/C][/ROW]
[ROW][C]15[/C][C]0.08028[/C][C]1.445[/C][C]0.074707[/C][/ROW]
[ROW][C]16[/C][C]0.003371[/C][C]0.0607[/C][C]0.475826[/C][/ROW]
[ROW][C]17[/C][C]0.109603[/C][C]1.9729[/C][C]0.024681[/C][/ROW]
[ROW][C]18[/C][C]0.024213[/C][C]0.4358[/C][C]0.331626[/C][/ROW]
[ROW][C]19[/C][C]0.012158[/C][C]0.2188[/C][C]0.413454[/C][/ROW]
[ROW][C]20[/C][C]0.043987[/C][C]0.7918[/C][C]0.214537[/C][/ROW]
[ROW][C]21[/C][C]0.091268[/C][C]1.6428[/C][C]0.050695[/C][/ROW]
[ROW][C]22[/C][C]0.113323[/C][C]2.0398[/C][C]0.02109[/C][/ROW]
[ROW][C]23[/C][C]0.214121[/C][C]3.8542[/C][C]7e-05[/C][/ROW]
[ROW][C]24[/C][C]0.203557[/C][C]3.664[/C][C]0.000145[/C][/ROW]
[ROW][C]25[/C][C]0.180873[/C][C]3.2557[/C][C]0.000625[/C][/ROW]
[/TABLE]
Source: https://freestatistics.org/blog/index.php?pk=31296&T=1

Globally Unique Identifier (entire table): ba.freestatistics.org/blog/index.php?pk=31296&T=1

As an alternative you can also use a QR Code:  

The GUIDs for individual cells are displayed in the table below:

Autocorrelation Function
Time lag kACF(k)T-STATP-value
10.2680614.82511e-06
20.248954.48115e-06
30.185373.33670.000473
40.0990351.78260.037792
50.1513782.72480.003392
60.1443192.59770.004906
70.0715391.28770.099383
80.1427612.56970.005313
90.0814021.46520.071914
10-0.026116-0.47010.319303
11-0.068843-1.23920.10809
12-0.395053-7.11090
13-0.086827-1.56290.059527
14-0.019515-0.35130.362809
150.080281.4450.074707
160.0033710.06070.475826
170.1096031.97290.024681
180.0242130.43580.331626
190.0121580.21880.413454
200.0439870.79180.214537
210.0912681.64280.050695
220.1133232.03980.02109
230.2141213.85427e-05
240.2035573.6640.000145
250.1808733.25570.000625


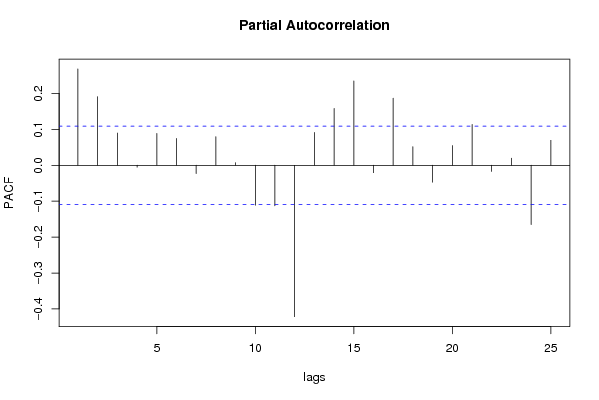
Partial Autocorrelation Function
Time lag kPACF(k)T-STATP-value
10.2680614.82511e-06
20.1908043.43450.000335
30.0896981.61460.053689
4-0.005302-0.09540.462016
50.0884191.59150.056231
60.0746341.34340.090039
7-0.023161-0.41690.338514
80.0795731.43230.076508
90.0071910.12940.448548
10-0.111038-1.99870.023239
11-0.113004-2.03410.021379
12-0.421418-7.58550
130.0911791.64120.050861
140.1582532.84860.002336
150.23474.22461.6e-05
16-0.020598-0.37080.355529
170.1867423.36140.000434
180.051570.92830.17698
19-0.047287-0.85120.197655
200.0548460.98720.162135
210.1134942.04290.020936
22-0.017302-0.31140.377837
230.0196870.35440.361648
24-0.165112-2.9720.00159
250.0692831.24710.106633

\begin{tabular}{lllllllll}
\hline
Partial Autocorrelation Function \tabularnewline
Time lag k & PACF(k) & T-STAT & P-value \tabularnewline
1 & 0.268061 & 4.8251 & 1e-06 \tabularnewline
2 & 0.190804 & 3.4345 & 0.000335 \tabularnewline
3 & 0.089698 & 1.6146 & 0.053689 \tabularnewline
4 & -0.005302 & -0.0954 & 0.462016 \tabularnewline
5 & 0.088419 & 1.5915 & 0.056231 \tabularnewline
6 & 0.074634 & 1.3434 & 0.090039 \tabularnewline
7 & -0.023161 & -0.4169 & 0.338514 \tabularnewline
8 & 0.079573 & 1.4323 & 0.076508 \tabularnewline
9 & 0.007191 & 0.1294 & 0.448548 \tabularnewline
10 & -0.111038 & -1.9987 & 0.023239 \tabularnewline
11 & -0.113004 & -2.0341 & 0.021379 \tabularnewline
12 & -0.421418 & -7.5855 & 0 \tabularnewline
13 & 0.091179 & 1.6412 & 0.050861 \tabularnewline
14 & 0.158253 & 2.8486 & 0.002336 \tabularnewline
15 & 0.2347 & 4.2246 & 1.6e-05 \tabularnewline
16 & -0.020598 & -0.3708 & 0.355529 \tabularnewline
17 & 0.186742 & 3.3614 & 0.000434 \tabularnewline
18 & 0.05157 & 0.9283 & 0.17698 \tabularnewline
19 & -0.047287 & -0.8512 & 0.197655 \tabularnewline
20 & 0.054846 & 0.9872 & 0.162135 \tabularnewline
21 & 0.113494 & 2.0429 & 0.020936 \tabularnewline
22 & -0.017302 & -0.3114 & 0.377837 \tabularnewline
23 & 0.019687 & 0.3544 & 0.361648 \tabularnewline
24 & -0.165112 & -2.972 & 0.00159 \tabularnewline
25 & 0.069283 & 1.2471 & 0.106633 \tabularnewline
\hline
\end{tabular}
%Source: https://freestatistics.org/blog/index.php?pk=31296&T=2

[TABLE]
[ROW][C]Partial Autocorrelation Function[/C][/ROW]
[ROW][C]Time lag k[/C][C]PACF(k)[/C][C]T-STAT[/C][C]P-value[/C][/ROW]
[ROW][C]1[/C][C]0.268061[/C][C]4.8251[/C][C]1e-06[/C][/ROW]
[ROW][C]2[/C][C]0.190804[/C][C]3.4345[/C][C]0.000335[/C][/ROW]
[ROW][C]3[/C][C]0.089698[/C][C]1.6146[/C][C]0.053689[/C][/ROW]
[ROW][C]4[/C][C]-0.005302[/C][C]-0.0954[/C][C]0.462016[/C][/ROW]
[ROW][C]5[/C][C]0.088419[/C][C]1.5915[/C][C]0.056231[/C][/ROW]
[ROW][C]6[/C][C]0.074634[/C][C]1.3434[/C][C]0.090039[/C][/ROW]
[ROW][C]7[/C][C]-0.023161[/C][C]-0.4169[/C][C]0.338514[/C][/ROW]
[ROW][C]8[/C][C]0.079573[/C][C]1.4323[/C][C]0.076508[/C][/ROW]
[ROW][C]9[/C][C]0.007191[/C][C]0.1294[/C][C]0.448548[/C][/ROW]
[ROW][C]10[/C][C]-0.111038[/C][C]-1.9987[/C][C]0.023239[/C][/ROW]
[ROW][C]11[/C][C]-0.113004[/C][C]-2.0341[/C][C]0.021379[/C][/ROW]
[ROW][C]12[/C][C]-0.421418[/C][C]-7.5855[/C][C]0[/C][/ROW]
[ROW][C]13[/C][C]0.091179[/C][C]1.6412[/C][C]0.050861[/C][/ROW]
[ROW][C]14[/C][C]0.158253[/C][C]2.8486[/C][C]0.002336[/C][/ROW]
[ROW][C]15[/C][C]0.2347[/C][C]4.2246[/C][C]1.6e-05[/C][/ROW]
[ROW][C]16[/C][C]-0.020598[/C][C]-0.3708[/C][C]0.355529[/C][/ROW]
[ROW][C]17[/C][C]0.186742[/C][C]3.3614[/C][C]0.000434[/C][/ROW]
[ROW][C]18[/C][C]0.05157[/C][C]0.9283[/C][C]0.17698[/C][/ROW]
[ROW][C]19[/C][C]-0.047287[/C][C]-0.8512[/C][C]0.197655[/C][/ROW]
[ROW][C]20[/C][C]0.054846[/C][C]0.9872[/C][C]0.162135[/C][/ROW]
[ROW][C]21[/C][C]0.113494[/C][C]2.0429[/C][C]0.020936[/C][/ROW]
[ROW][C]22[/C][C]-0.017302[/C][C]-0.3114[/C][C]0.377837[/C][/ROW]
[ROW][C]23[/C][C]0.019687[/C][C]0.3544[/C][C]0.361648[/C][/ROW]
[ROW][C]24[/C][C]-0.165112[/C][C]-2.972[/C][C]0.00159[/C][/ROW]
[ROW][C]25[/C][C]0.069283[/C][C]1.2471[/C][C]0.106633[/C][/ROW]
[/TABLE]
Source: https://freestatistics.org/blog/index.php?pk=31296&T=2

Globally Unique Identifier (entire table): ba.freestatistics.org/blog/index.php?pk=31296&T=2

As an alternative you can also use a QR Code:  

The GUIDs for individual cells are displayed in the table below:

Partial Autocorrelation Function
Time lag kPACF(k)T-STATP-value
10.2680614.82511e-06
20.1908043.43450.000335
30.0896981.61460.053689
4-0.005302-0.09540.462016
50.0884191.59150.056231
60.0746341.34340.090039
7-0.023161-0.41690.338514
80.0795731.43230.076508
90.0071910.12940.448548
10-0.111038-1.99870.023239
11-0.113004-2.03410.021379
12-0.421418-7.58550
130.0911791.64120.050861
140.1582532.84860.002336
150.23474.22461.6e-05
16-0.020598-0.37080.355529
170.1867423.36140.000434
180.051570.92830.17698
19-0.047287-0.85120.197655
200.0548460.98720.162135
210.1134942.04290.020936
22-0.017302-0.31140.377837
230.0196870.35440.361648
24-0.165112-2.9720.00159
250.0692831.24710.106633


Parameters (Session):
par1 = Default ; par2 = 0.0 ; par3 = 0 ; par4 = 1 ; par5 = 12 ;
Parameters (R input):
par1 = Default ; par2 = 0.0 ; par3 = 0 ; par4 = 1 ; par5 = 12 ;
R code (references can be found in the software module):
if (par1 == 'Default') {
par1 = 10*log10(length(x))
} else {
par1 <- as.numeric(par1)
}
par2 <- as.numeric(par2)
par3 <- as.numeric(par3)
par4 <- as.numeric(par4)
par5 <- as.numeric(par5)
if (par2 == 0) {
x <- log(x)
} else {
x <- (x ^ par2 - 1) / par2
}
if (par3 > 0) x <- diff(x,lag=1,difference=par3)
if (par4 > 0) x <- diff(x,lag=par5,difference=par4)
bitmap(file='pic1.png')
racf <- acf(x,par1,main='Autocorrelation',xlab='lags',ylab='ACF')
dev.off()
bitmap(file='pic2.png')
rpacf <- pacf(x,par1,main='Partial Autocorrelation',xlab='lags',ylab='PACF')
dev.off()
(myacf <- c(racf$acf))
(mypacf <- c(rpacf$acf))
lengthx <- length(x)
sqrtn <- sqrt(lengthx)
load(file='createtable')
a<-table.start()
a<-table.row.start(a)
a<-table.element(a,'Autocorrelation Function',4,TRUE)
a<-table.row.end(a)
a<-table.row.start(a)
a<-table.element(a,'Time lag k',header=TRUE)
a<-table.element(a,hyperlink('basics.htm','ACF(k)','click here for more information about the Autocorrelation Function'),header=TRUE)
a<-table.element(a,'T-STAT',header=TRUE)
a<-table.element(a,'P-value',header=TRUE)
a<-table.row.end(a)
for (i in 2:(par1+1)) {
a<-table.row.start(a)
a<-table.element(a,i-1,header=TRUE)
a<-table.element(a,round(myacf[i],6))
mytstat <- myacf[i]*sqrtn
a<-table.element(a,round(mytstat,4))
a<-table.element(a,round(1-pt(abs(mytstat),lengthx),6))
a<-table.row.end(a)
}
a<-table.end(a)
table.save(a,file='mytable.tab')
a<-table.start()
a<-table.row.start(a)
a<-table.element(a,'Partial Autocorrelation Function',4,TRUE)
a<-table.row.end(a)
a<-table.row.start(a)
a<-table.element(a,'Time lag k',header=TRUE)
a<-table.element(a,hyperlink('basics.htm','PACF(k)','click here for more information about the Partial Autocorrelation Function'),header=TRUE)
a<-table.element(a,'T-STAT',header=TRUE)
a<-table.element(a,'P-value',header=TRUE)
a<-table.row.end(a)
for (i in 1:par1) {
a<-table.row.start(a)
a<-table.element(a,i,header=TRUE)
a<-table.element(a,round(mypacf[i],6))
mytstat <- mypacf[i]*sqrtn
a<-table.element(a,round(mytstat,4))
a<-table.element(a,round(1-pt(abs(mytstat),lengthx),6))
a<-table.row.end(a)
}
a<-table.end(a)
table.save(a,file='mytable1.tab')