Free Statistics

of Irreproducible Research!

Author's title

Author*Unverified author*
R Software Modulerwasp_smp.wasp
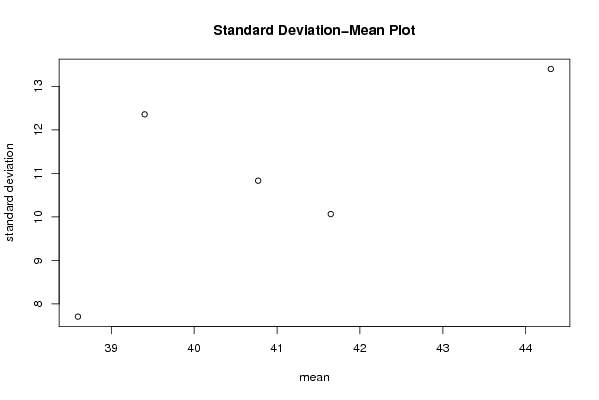
Title produced by softwareStandard Deviation-Mean Plot
Date of computationMon, 08 Dec 2008 09:20:04 -0700
Cite this page as followsStatistical Computations at FreeStatistics.org, Office for Research Development and Education, URL https://freestatistics.org/blog/index.php?v=date/2008/Dec/08/t1228753375punibwqntk53zru.htm/, Retrieved Tue, 16 Apr 2024 11:38:15 +0000
Statistical Computations at FreeStatistics.org, Office for Research Development and Education, URL https://freestatistics.org/blog/index.php?pk=30562, Retrieved Tue, 16 Apr 2024 11:38:15 +0000
QR Codes:

Original text written by user:
IsPrivate?No (this computation is public)
User-defined keywords
Estimated Impact290
Family? (F = Feedback message, R = changed R code, M = changed R Module, P = changed Parameters, D = changed Data)
-     [Univariate Data Series] [data set] [2008-12-01 19:54:57] [b98453cac15ba1066b407e146608df68]
F RMP   [Standard Deviation-Mean Plot] [Taak 10 Stap 1 St...] [2008-12-03 14:41:41] [6fea0e9a9b3b29a63badf2c274e82506]
F    D    [Standard Deviation-Mean Plot] [Taak 10 Stap 1 St...] [2008-12-04 18:13:48] [819b576fab25b35cfda70f80599828ec]
F             [Standard Deviation-Mean Plot] [Step 1] [2008-12-08 16:20:04] [d41d8cd98f00b204e9800998ecf8427e] [Current]
Feedback Forum
2008-12-14 11:20:49 [339a57d8a4d5d113e4804fc423e4a59e] [reply
De student heeft hier vermoedelijk verkeerde cijfers gebruikt.
De juiste oplossing is de volgende:

http://www.freestatistics.org/blog/date/2008/Dec/14/t122924896600m1vrsoixkl8rr.htm

In de tabel kunnen we de optimale lambda waarde aflezen. Deze bedraagt 0,467... We ronden deze echter af naar 0,5. De betawaarde is signifacant verschillend van 0.
2008-12-15 11:24:16 [Lindsay Heyndrickx] [reply
De student heeft dit vermoedelijk enkel zijn eigen tijdreeks geanalyseerd. Hier wordt niet uitlgelegd vanwaar deze cijfers komen dus dit is zeer onvolledig. Hij heeft hier de juiste methode gebruikt maar geeft geen uitleg. Hier is de beta waarde 0.66 en de p- waarde is hier 0.22 dit is redelijk hoog. De kans dat het op toeval berust dat de beta waarde significant verschilt van nul is hier 22%. Dit is hier te veel.
2008-12-15 16:10:59 [Lindsay Heyndrickx] [reply
Hier gaat de waarde die je voor lamda hebt dus niet accuraat zijn en kan je best een lamda=1 nemen.
2008-12-15 20:41:34 [be464a3cae54f8118e26892c61355e0b] [reply
P-waarde is hoger dan 5%, daarom zal de transformatie waarschijnlijk zinloos zin. We moeten lambda = 1 gebruiken.

Post a new message
Dataseries X:
58.972
59.249
63.955
53.785
52.760
44.795
37.348
32.370
32.717
40.974
33.591
21.124
58.608
46.865
51.378
46.235
47.206
45.382
41.227
33.795
31.295
42.625
33.625
21.538
56.421
53.152
53.536
52.408
41.454
38.271
35.306
26.414
31.917
38.030
27.534
18.387
50.556
43.901
48.572
43.899
37.532
40.357
35.489
29.027
34.485
42.598
30.306
26.451
47.460
50.104
61.465
53.726
39.477
43.895
31.481
29.896
33.842
39.120
33.702
25.094


Summary of computational transaction
Raw Inputview raw input (R code)
Raw Outputview raw output of R engine
Computing time1 seconds
R Server'George Udny Yule' @ 72.249.76.132

\begin{tabular}{lllllllll}
\hline
Summary of computational transaction \tabularnewline
Raw Input & view raw input (R code)  \tabularnewline
Raw Output & view raw output of R engine  \tabularnewline
Computing time & 1 seconds \tabularnewline
R Server & 'George Udny Yule' @ 72.249.76.132 \tabularnewline
\hline
\end{tabular}
%Source: https://freestatistics.org/blog/index.php?pk=30562&T=0

[TABLE]
[ROW][C]Summary of computational transaction[/C][/ROW]
[ROW][C]Raw Input[/C][C]view raw input (R code) [/C][/ROW]
[ROW][C]Raw Output[/C][C]view raw output of R engine [/C][/ROW]
[ROW][C]Computing time[/C][C]1 seconds[/C][/ROW]
[ROW][C]R Server[/C][C]'George Udny Yule' @ 72.249.76.132[/C][/ROW]
[/TABLE]
Source: https://freestatistics.org/blog/index.php?pk=30562&T=0

Globally Unique Identifier (entire table): ba.freestatistics.org/blog/index.php?pk=30562&T=0

As an alternative you can also use a QR Code:  

The GUIDs for individual cells are displayed in the table below:

Summary of computational transaction
Raw Inputview raw input (R code)
Raw Outputview raw output of R engine
Computing time1 seconds
R Server'George Udny Yule' @ 72.249.76.132


Standard Deviation-Mean Plot
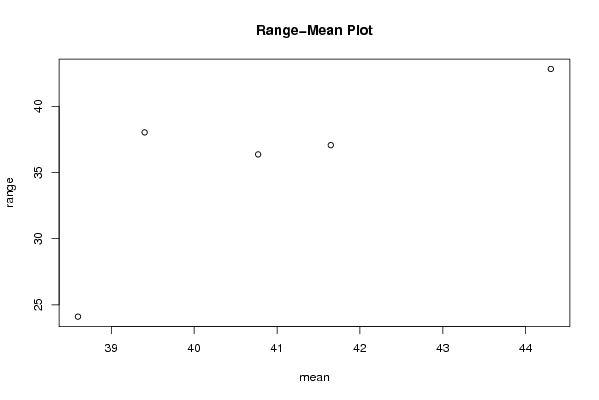
SectionMeanStandard DeviationRange
144.303333333333313.397876197594242.831
241.6482510.064216061463437.07
339.402512.354525608051538.034
438.597757.7072625151393924.105
540.771833333333310.830935205430936.371

\begin{tabular}{lllllllll}
\hline
Standard Deviation-Mean Plot \tabularnewline
Section & Mean & Standard Deviation & Range \tabularnewline
1 & 44.3033333333333 & 13.3978761975942 & 42.831 \tabularnewline
2 & 41.64825 & 10.0642160614634 & 37.07 \tabularnewline
3 & 39.4025 & 12.3545256080515 & 38.034 \tabularnewline
4 & 38.59775 & 7.70726251513939 & 24.105 \tabularnewline
5 & 40.7718333333333 & 10.8309352054309 & 36.371 \tabularnewline
\hline
\end{tabular}
%Source: https://freestatistics.org/blog/index.php?pk=30562&T=1

[TABLE]
[ROW][C]Standard Deviation-Mean Plot[/C][/ROW]
[ROW][C]Section[/C][C]Mean[/C][C]Standard Deviation[/C][C]Range[/C][/ROW]
[ROW][C]1[/C][C]44.3033333333333[/C][C]13.3978761975942[/C][C]42.831[/C][/ROW]
[ROW][C]2[/C][C]41.64825[/C][C]10.0642160614634[/C][C]37.07[/C][/ROW]
[ROW][C]3[/C][C]39.4025[/C][C]12.3545256080515[/C][C]38.034[/C][/ROW]
[ROW][C]4[/C][C]38.59775[/C][C]7.70726251513939[/C][C]24.105[/C][/ROW]
[ROW][C]5[/C][C]40.7718333333333[/C][C]10.8309352054309[/C][C]36.371[/C][/ROW]
[/TABLE]
Source: https://freestatistics.org/blog/index.php?pk=30562&T=1

Globally Unique Identifier (entire table): ba.freestatistics.org/blog/index.php?pk=30562&T=1

As an alternative you can also use a QR Code:  

The GUIDs for individual cells are displayed in the table below:

Standard Deviation-Mean Plot
SectionMeanStandard DeviationRange
144.303333333333313.397876197594242.831
241.6482510.064216061463437.07
339.402512.354525608051538.034
438.597757.7072625151393924.105
540.771833333333310.830935205430936.371


Regression: S.E.(k) = alpha + beta * Mean(k)
alpha-16.2914371773858
beta0.663391798739805
S.D.0.423224316462088
T-STAT1.56747089648671
p-value0.214998351144883

\begin{tabular}{lllllllll}
\hline
Regression: S.E.(k) = alpha + beta * Mean(k) \tabularnewline
alpha & -16.2914371773858 \tabularnewline
beta & 0.663391798739805 \tabularnewline
S.D. & 0.423224316462088 \tabularnewline
T-STAT & 1.56747089648671 \tabularnewline
p-value & 0.214998351144883 \tabularnewline
\hline
\end{tabular}
%Source: https://freestatistics.org/blog/index.php?pk=30562&T=2

[TABLE]
[ROW][C]Regression: S.E.(k) = alpha + beta * Mean(k)[/C][/ROW]
[ROW][C]alpha[/C][C]-16.2914371773858[/C][/ROW]
[ROW][C]beta[/C][C]0.663391798739805[/C][/ROW]
[ROW][C]S.D.[/C][C]0.423224316462088[/C][/ROW]
[ROW][C]T-STAT[/C][C]1.56747089648671[/C][/ROW]
[ROW][C]p-value[/C][C]0.214998351144883[/C][/ROW]
[/TABLE]
Source: https://freestatistics.org/blog/index.php?pk=30562&T=2

Globally Unique Identifier (entire table): ba.freestatistics.org/blog/index.php?pk=30562&T=2

As an alternative you can also use a QR Code:  

The GUIDs for individual cells are displayed in the table below:

Regression: S.E.(k) = alpha + beta * Mean(k)
alpha-16.2914371773858
beta0.663391798739805
S.D.0.423224316462088
T-STAT1.56747089648671
p-value0.214998351144883


Regression: ln S.E.(k) = alpha + beta * ln Mean(k)
alpha-7.48469902692165
beta2.65509472451388
S.D.1.72011735820751
T-STAT1.54355440449754
p-value0.220385570920444
Lambda-1.65509472451388

\begin{tabular}{lllllllll}
\hline
Regression: ln S.E.(k) = alpha + beta * ln Mean(k) \tabularnewline
alpha & -7.48469902692165 \tabularnewline
beta & 2.65509472451388 \tabularnewline
S.D. & 1.72011735820751 \tabularnewline
T-STAT & 1.54355440449754 \tabularnewline
p-value & 0.220385570920444 \tabularnewline
Lambda & -1.65509472451388 \tabularnewline
\hline
\end{tabular}
%Source: https://freestatistics.org/blog/index.php?pk=30562&T=3

[TABLE]
[ROW][C]Regression: ln S.E.(k) = alpha + beta * ln Mean(k)[/C][/ROW]
[ROW][C]alpha[/C][C]-7.48469902692165[/C][/ROW]
[ROW][C]beta[/C][C]2.65509472451388[/C][/ROW]
[ROW][C]S.D.[/C][C]1.72011735820751[/C][/ROW]
[ROW][C]T-STAT[/C][C]1.54355440449754[/C][/ROW]
[ROW][C]p-value[/C][C]0.220385570920444[/C][/ROW]
[ROW][C]Lambda[/C][C]-1.65509472451388[/C][/ROW]
[/TABLE]
Source: https://freestatistics.org/blog/index.php?pk=30562&T=3

Globally Unique Identifier (entire table): ba.freestatistics.org/blog/index.php?pk=30562&T=3

As an alternative you can also use a QR Code:  

The GUIDs for individual cells are displayed in the table below:

Regression: ln S.E.(k) = alpha + beta * ln Mean(k)
alpha-7.48469902692165
beta2.65509472451388
S.D.1.72011735820751
T-STAT1.54355440449754
p-value0.220385570920444
Lambda-1.65509472451388


Parameters (Session):
par1 = 12 ;
Parameters (R input):
par1 = 12 ;
R code (references can be found in the software module):
par1 <- as.numeric(par1)
(n <- length(x))
(np <- floor(n / par1))
arr <- array(NA,dim=c(par1,np))
j <- 0
k <- 1
for (i in 1:(np*par1))
{
j = j + 1
arr[j,k] <- x[i]
if (j == par1) {
j = 0
k=k+1
}
}
arr
arr.mean <- array(NA,dim=np)
arr.sd <- array(NA,dim=np)
arr.range <- array(NA,dim=np)
for (j in 1:np)
{
arr.mean[j] <- mean(arr[,j],na.rm=TRUE)
arr.sd[j] <- sd(arr[,j],na.rm=TRUE)
arr.range[j] <- max(arr[,j],na.rm=TRUE) - min(arr[,j],na.rm=TRUE)
}
arr.mean
arr.sd
arr.range
(lm1 <- lm(arr.sd~arr.mean))
(lnlm1 <- lm(log(arr.sd)~log(arr.mean)))
(lm2 <- lm(arr.range~arr.mean))
bitmap(file='test1.png')
plot(arr.mean,arr.sd,main='Standard Deviation-Mean Plot',xlab='mean',ylab='standard deviation')
dev.off()
bitmap(file='test2.png')
plot(arr.mean,arr.range,main='Range-Mean Plot',xlab='mean',ylab='range')
dev.off()
load(file='createtable')
a<-table.start()
a<-table.row.start(a)
a<-table.element(a,'Standard Deviation-Mean Plot',4,TRUE)
a<-table.row.end(a)
a<-table.row.start(a)
a<-table.element(a,'Section',header=TRUE)
a<-table.element(a,'Mean',header=TRUE)
a<-table.element(a,'Standard Deviation',header=TRUE)
a<-table.element(a,'Range',header=TRUE)
a<-table.row.end(a)
for (j in 1:np) {
a<-table.row.start(a)
a<-table.element(a,j,header=TRUE)
a<-table.element(a,arr.mean[j])
a<-table.element(a,arr.sd[j] )
a<-table.element(a,arr.range[j] )
a<-table.row.end(a)
}
a<-table.end(a)
table.save(a,file='mytable.tab')
a<-table.start()
a<-table.row.start(a)
a<-table.element(a,'Regression: S.E.(k) = alpha + beta * Mean(k)',2,TRUE)
a<-table.row.end(a)
a<-table.row.start(a)
a<-table.element(a,'alpha',header=TRUE)
a<-table.element(a,lm1$coefficients[[1]])
a<-table.row.end(a)
a<-table.row.start(a)
a<-table.element(a,'beta',header=TRUE)
a<-table.element(a,lm1$coefficients[[2]])
a<-table.row.end(a)
a<-table.row.start(a)
a<-table.element(a,'S.D.',header=TRUE)
a<-table.element(a,summary(lm1)$coefficients[2,2])
a<-table.row.end(a)
a<-table.row.start(a)
a<-table.element(a,'T-STAT',header=TRUE)
a<-table.element(a,summary(lm1)$coefficients[2,3])
a<-table.row.end(a)
a<-table.row.start(a)
a<-table.element(a,'p-value',header=TRUE)
a<-table.element(a,summary(lm1)$coefficients[2,4])
a<-table.row.end(a)
a<-table.end(a)
table.save(a,file='mytable1.tab')
a<-table.start()
a<-table.row.start(a)
a<-table.element(a,'Regression: ln S.E.(k) = alpha + beta * ln Mean(k)',2,TRUE)
a<-table.row.end(a)
a<-table.row.start(a)
a<-table.element(a,'alpha',header=TRUE)
a<-table.element(a,lnlm1$coefficients[[1]])
a<-table.row.end(a)
a<-table.row.start(a)
a<-table.element(a,'beta',header=TRUE)
a<-table.element(a,lnlm1$coefficients[[2]])
a<-table.row.end(a)
a<-table.row.start(a)
a<-table.element(a,'S.D.',header=TRUE)
a<-table.element(a,summary(lnlm1)$coefficients[2,2])
a<-table.row.end(a)
a<-table.row.start(a)
a<-table.element(a,'T-STAT',header=TRUE)
a<-table.element(a,summary(lnlm1)$coefficients[2,3])
a<-table.row.end(a)
a<-table.row.start(a)
a<-table.element(a,'p-value',header=TRUE)
a<-table.element(a,summary(lnlm1)$coefficients[2,4])
a<-table.row.end(a)
a<-table.row.start(a)
a<-table.element(a,'Lambda',header=TRUE)
a<-table.element(a,1-lnlm1$coefficients[[2]])
a<-table.row.end(a)
a<-table.end(a)
table.save(a,file='mytable2.tab')