Free Statistics

of Irreproducible Research!

Author's title

Author*Unverified author*
R Software Modulerwasp_autocorrelation.wasp
Title produced by software(Partial) Autocorrelation Function
Date of computationSat, 06 Dec 2008 09:02:15 -0700
Cite this page as followsStatistical Computations at FreeStatistics.org, Office for Research Development and Education, URL https://freestatistics.org/blog/index.php?v=date/2008/Dec/06/t1228579373yvohpqe6it2llk2.htm/, Retrieved Sun, 26 May 2024 00:12:07 +0000
Statistical Computations at FreeStatistics.org, Office for Research Development and Education, URL https://freestatistics.org/blog/index.php?pk=29723, Retrieved Sun, 26 May 2024 00:12:07 +0000
QR Codes:

Original text written by user:
IsPrivate?No (this computation is public)
User-defined keywords
Estimated Impact153
Family? (F = Feedback message, R = changed R code, M = changed R Module, P = changed Parameters, D = changed Data)
-       [(Partial) Autocorrelation Function] [Opgave 6bis-oefen...] [2008-12-06 16:02:15] [d41d8cd98f00b204e9800998ecf8427e] [Current]
Feedback Forum

Post a new message
Dataseries X:
113.9000
112.0000
113.8500
113.0800
111.7200
110.6900
113.5300
113.9900
112.7400
112.1500
115.8200
118.3800
118.8100
123.8500
117.9600
120.1600
118.7400
119.8400
124.8100
121.3300
120.2000
118.3200
129.5800
130.2000
127.1900
133.1000
129.1200
123.2800
123.3600
124.1300
126.9700
127.1400
123.7000
123.6700
130.1900
134.0100
124.9600
129.9600
128.3200
132.3800
126.2500
128.9100
131.4200
129.4400
126.8600
126.7100
131.6300
132.7800
126.6100
132.8400
123.1400
128.1300
125.4900
126.4800
130.8600
127.3200
126.5600
126.6400
129.2600
126.4700
135.4000
135.5000
132.2200
122.6200
125.1600
128.5000
133.8600
128.8700
125.0700
125.2500
132.1600
130.2400


Summary of computational transaction
Raw Inputview raw input (R code)
Raw Outputview raw output of R engine
Computing time1 seconds
R Server'Gwilym Jenkins' @ 72.249.127.135

\begin{tabular}{lllllllll}
\hline
Summary of computational transaction \tabularnewline
Raw Input & view raw input (R code)  \tabularnewline
Raw Output & view raw output of R engine  \tabularnewline
Computing time & 1 seconds \tabularnewline
R Server & 'Gwilym Jenkins' @ 72.249.127.135 \tabularnewline
\hline
\end{tabular}
%Source: https://freestatistics.org/blog/index.php?pk=29723&T=0

[TABLE]
[ROW][C]Summary of computational transaction[/C][/ROW]
[ROW][C]Raw Input[/C][C]view raw input (R code) [/C][/ROW]
[ROW][C]Raw Output[/C][C]view raw output of R engine [/C][/ROW]
[ROW][C]Computing time[/C][C]1 seconds[/C][/ROW]
[ROW][C]R Server[/C][C]'Gwilym Jenkins' @ 72.249.127.135[/C][/ROW]
[/TABLE]
Source: https://freestatistics.org/blog/index.php?pk=29723&T=0

Globally Unique Identifier (entire table): ba.freestatistics.org/blog/index.php?pk=29723&T=0

As an alternative you can also use a QR Code:  

The GUIDs for individual cells are displayed in the table below:

Summary of computational transaction
Raw Inputview raw input (R code)
Raw Outputview raw output of R engine
Computing time1 seconds
R Server'Gwilym Jenkins' @ 72.249.127.135


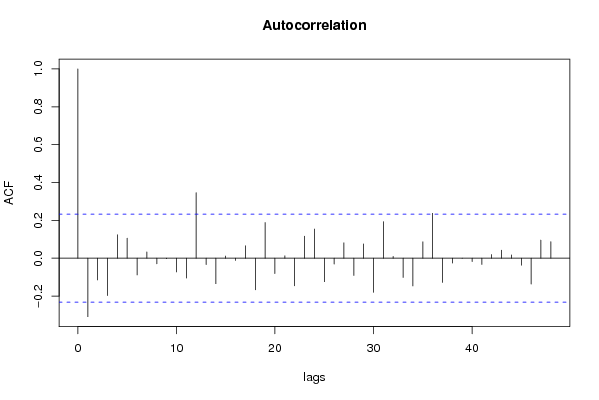
Autocorrelation Function
Time lag kACF(k)T-STATP-value
1-0.308898-2.60280.005624
2-0.115071-0.96960.167767
3-0.197303-1.66250.05041
40.1237661.04290.150273
50.1054830.88880.188551
6-0.088287-0.74390.22969
70.0329260.27740.391125
8-0.029532-0.24880.4021
9-0.002895-0.02440.490304
10-0.072368-0.60980.271977
11-0.105135-0.88590.189336
120.3462632.91770.00236
13-0.033663-0.28370.388752
14-0.134404-1.13250.130615
150.0110920.09350.462898
16-0.011542-0.09730.461399
170.0653770.55090.291724
18-0.167254-1.40930.081555
190.1885271.58860.058302
20-0.080908-0.68170.248811
210.0123210.10380.458802
22-0.146267-1.23250.110919
230.116290.97990.165236
240.1540561.29810.099228
25-0.124258-1.0470.149321
26-0.031223-0.26310.396622
270.0815040.68680.247233
28-0.091085-0.76750.222666
290.0751020.63280.264443
30-0.180365-1.51980.066503
310.1931591.62760.054021
320.009550.08050.468043
33-0.10156-0.85580.197504
34-0.146888-1.23770.109952
350.0864030.7280.234491
360.2371061.99790.02478
37-0.128423-1.08210.141432
38-0.025434-0.21430.415459
39-0.000131-0.00110.499562
40-0.017727-0.14940.440842
41-0.032958-0.27770.391021
420.0194710.16410.435072
430.0423970.35720.360984
440.0169270.14260.443494
45-0.036709-0.30930.378995
46-0.136522-1.15040.126929
470.0954880.80460.211869
480.0869920.7330.232983

\begin{tabular}{lllllllll}
\hline
Autocorrelation Function \tabularnewline
Time lag k & ACF(k) & T-STAT & P-value \tabularnewline
1 & -0.308898 & -2.6028 & 0.005624 \tabularnewline
2 & -0.115071 & -0.9696 & 0.167767 \tabularnewline
3 & -0.197303 & -1.6625 & 0.05041 \tabularnewline
4 & 0.123766 & 1.0429 & 0.150273 \tabularnewline
5 & 0.105483 & 0.8888 & 0.188551 \tabularnewline
6 & -0.088287 & -0.7439 & 0.22969 \tabularnewline
7 & 0.032926 & 0.2774 & 0.391125 \tabularnewline
8 & -0.029532 & -0.2488 & 0.4021 \tabularnewline
9 & -0.002895 & -0.0244 & 0.490304 \tabularnewline
10 & -0.072368 & -0.6098 & 0.271977 \tabularnewline
11 & -0.105135 & -0.8859 & 0.189336 \tabularnewline
12 & 0.346263 & 2.9177 & 0.00236 \tabularnewline
13 & -0.033663 & -0.2837 & 0.388752 \tabularnewline
14 & -0.134404 & -1.1325 & 0.130615 \tabularnewline
15 & 0.011092 & 0.0935 & 0.462898 \tabularnewline
16 & -0.011542 & -0.0973 & 0.461399 \tabularnewline
17 & 0.065377 & 0.5509 & 0.291724 \tabularnewline
18 & -0.167254 & -1.4093 & 0.081555 \tabularnewline
19 & 0.188527 & 1.5886 & 0.058302 \tabularnewline
20 & -0.080908 & -0.6817 & 0.248811 \tabularnewline
21 & 0.012321 & 0.1038 & 0.458802 \tabularnewline
22 & -0.146267 & -1.2325 & 0.110919 \tabularnewline
23 & 0.11629 & 0.9799 & 0.165236 \tabularnewline
24 & 0.154056 & 1.2981 & 0.099228 \tabularnewline
25 & -0.124258 & -1.047 & 0.149321 \tabularnewline
26 & -0.031223 & -0.2631 & 0.396622 \tabularnewline
27 & 0.081504 & 0.6868 & 0.247233 \tabularnewline
28 & -0.091085 & -0.7675 & 0.222666 \tabularnewline
29 & 0.075102 & 0.6328 & 0.264443 \tabularnewline
30 & -0.180365 & -1.5198 & 0.066503 \tabularnewline
31 & 0.193159 & 1.6276 & 0.054021 \tabularnewline
32 & 0.00955 & 0.0805 & 0.468043 \tabularnewline
33 & -0.10156 & -0.8558 & 0.197504 \tabularnewline
34 & -0.146888 & -1.2377 & 0.109952 \tabularnewline
35 & 0.086403 & 0.728 & 0.234491 \tabularnewline
36 & 0.237106 & 1.9979 & 0.02478 \tabularnewline
37 & -0.128423 & -1.0821 & 0.141432 \tabularnewline
38 & -0.025434 & -0.2143 & 0.415459 \tabularnewline
39 & -0.000131 & -0.0011 & 0.499562 \tabularnewline
40 & -0.017727 & -0.1494 & 0.440842 \tabularnewline
41 & -0.032958 & -0.2777 & 0.391021 \tabularnewline
42 & 0.019471 & 0.1641 & 0.435072 \tabularnewline
43 & 0.042397 & 0.3572 & 0.360984 \tabularnewline
44 & 0.016927 & 0.1426 & 0.443494 \tabularnewline
45 & -0.036709 & -0.3093 & 0.378995 \tabularnewline
46 & -0.136522 & -1.1504 & 0.126929 \tabularnewline
47 & 0.095488 & 0.8046 & 0.211869 \tabularnewline
48 & 0.086992 & 0.733 & 0.232983 \tabularnewline
\hline
\end{tabular}
%Source: https://freestatistics.org/blog/index.php?pk=29723&T=1

[TABLE]
[ROW][C]Autocorrelation Function[/C][/ROW]
[ROW][C]Time lag k[/C][C]ACF(k)[/C][C]T-STAT[/C][C]P-value[/C][/ROW]
[ROW][C]1[/C][C]-0.308898[/C][C]-2.6028[/C][C]0.005624[/C][/ROW]
[ROW][C]2[/C][C]-0.115071[/C][C]-0.9696[/C][C]0.167767[/C][/ROW]
[ROW][C]3[/C][C]-0.197303[/C][C]-1.6625[/C][C]0.05041[/C][/ROW]
[ROW][C]4[/C][C]0.123766[/C][C]1.0429[/C][C]0.150273[/C][/ROW]
[ROW][C]5[/C][C]0.105483[/C][C]0.8888[/C][C]0.188551[/C][/ROW]
[ROW][C]6[/C][C]-0.088287[/C][C]-0.7439[/C][C]0.22969[/C][/ROW]
[ROW][C]7[/C][C]0.032926[/C][C]0.2774[/C][C]0.391125[/C][/ROW]
[ROW][C]8[/C][C]-0.029532[/C][C]-0.2488[/C][C]0.4021[/C][/ROW]
[ROW][C]9[/C][C]-0.002895[/C][C]-0.0244[/C][C]0.490304[/C][/ROW]
[ROW][C]10[/C][C]-0.072368[/C][C]-0.6098[/C][C]0.271977[/C][/ROW]
[ROW][C]11[/C][C]-0.105135[/C][C]-0.8859[/C][C]0.189336[/C][/ROW]
[ROW][C]12[/C][C]0.346263[/C][C]2.9177[/C][C]0.00236[/C][/ROW]
[ROW][C]13[/C][C]-0.033663[/C][C]-0.2837[/C][C]0.388752[/C][/ROW]
[ROW][C]14[/C][C]-0.134404[/C][C]-1.1325[/C][C]0.130615[/C][/ROW]
[ROW][C]15[/C][C]0.011092[/C][C]0.0935[/C][C]0.462898[/C][/ROW]
[ROW][C]16[/C][C]-0.011542[/C][C]-0.0973[/C][C]0.461399[/C][/ROW]
[ROW][C]17[/C][C]0.065377[/C][C]0.5509[/C][C]0.291724[/C][/ROW]
[ROW][C]18[/C][C]-0.167254[/C][C]-1.4093[/C][C]0.081555[/C][/ROW]
[ROW][C]19[/C][C]0.188527[/C][C]1.5886[/C][C]0.058302[/C][/ROW]
[ROW][C]20[/C][C]-0.080908[/C][C]-0.6817[/C][C]0.248811[/C][/ROW]
[ROW][C]21[/C][C]0.012321[/C][C]0.1038[/C][C]0.458802[/C][/ROW]
[ROW][C]22[/C][C]-0.146267[/C][C]-1.2325[/C][C]0.110919[/C][/ROW]
[ROW][C]23[/C][C]0.11629[/C][C]0.9799[/C][C]0.165236[/C][/ROW]
[ROW][C]24[/C][C]0.154056[/C][C]1.2981[/C][C]0.099228[/C][/ROW]
[ROW][C]25[/C][C]-0.124258[/C][C]-1.047[/C][C]0.149321[/C][/ROW]
[ROW][C]26[/C][C]-0.031223[/C][C]-0.2631[/C][C]0.396622[/C][/ROW]
[ROW][C]27[/C][C]0.081504[/C][C]0.6868[/C][C]0.247233[/C][/ROW]
[ROW][C]28[/C][C]-0.091085[/C][C]-0.7675[/C][C]0.222666[/C][/ROW]
[ROW][C]29[/C][C]0.075102[/C][C]0.6328[/C][C]0.264443[/C][/ROW]
[ROW][C]30[/C][C]-0.180365[/C][C]-1.5198[/C][C]0.066503[/C][/ROW]
[ROW][C]31[/C][C]0.193159[/C][C]1.6276[/C][C]0.054021[/C][/ROW]
[ROW][C]32[/C][C]0.00955[/C][C]0.0805[/C][C]0.468043[/C][/ROW]
[ROW][C]33[/C][C]-0.10156[/C][C]-0.8558[/C][C]0.197504[/C][/ROW]
[ROW][C]34[/C][C]-0.146888[/C][C]-1.2377[/C][C]0.109952[/C][/ROW]
[ROW][C]35[/C][C]0.086403[/C][C]0.728[/C][C]0.234491[/C][/ROW]
[ROW][C]36[/C][C]0.237106[/C][C]1.9979[/C][C]0.02478[/C][/ROW]
[ROW][C]37[/C][C]-0.128423[/C][C]-1.0821[/C][C]0.141432[/C][/ROW]
[ROW][C]38[/C][C]-0.025434[/C][C]-0.2143[/C][C]0.415459[/C][/ROW]
[ROW][C]39[/C][C]-0.000131[/C][C]-0.0011[/C][C]0.499562[/C][/ROW]
[ROW][C]40[/C][C]-0.017727[/C][C]-0.1494[/C][C]0.440842[/C][/ROW]
[ROW][C]41[/C][C]-0.032958[/C][C]-0.2777[/C][C]0.391021[/C][/ROW]
[ROW][C]42[/C][C]0.019471[/C][C]0.1641[/C][C]0.435072[/C][/ROW]
[ROW][C]43[/C][C]0.042397[/C][C]0.3572[/C][C]0.360984[/C][/ROW]
[ROW][C]44[/C][C]0.016927[/C][C]0.1426[/C][C]0.443494[/C][/ROW]
[ROW][C]45[/C][C]-0.036709[/C][C]-0.3093[/C][C]0.378995[/C][/ROW]
[ROW][C]46[/C][C]-0.136522[/C][C]-1.1504[/C][C]0.126929[/C][/ROW]
[ROW][C]47[/C][C]0.095488[/C][C]0.8046[/C][C]0.211869[/C][/ROW]
[ROW][C]48[/C][C]0.086992[/C][C]0.733[/C][C]0.232983[/C][/ROW]
[/TABLE]
Source: https://freestatistics.org/blog/index.php?pk=29723&T=1

Globally Unique Identifier (entire table): ba.freestatistics.org/blog/index.php?pk=29723&T=1

As an alternative you can also use a QR Code:  

The GUIDs for individual cells are displayed in the table below:

Autocorrelation Function
Time lag kACF(k)T-STATP-value
1-0.308898-2.60280.005624
2-0.115071-0.96960.167767
3-0.197303-1.66250.05041
40.1237661.04290.150273
50.1054830.88880.188551
6-0.088287-0.74390.22969
70.0329260.27740.391125
8-0.029532-0.24880.4021
9-0.002895-0.02440.490304
10-0.072368-0.60980.271977
11-0.105135-0.88590.189336
120.3462632.91770.00236
13-0.033663-0.28370.388752
14-0.134404-1.13250.130615
150.0110920.09350.462898
16-0.011542-0.09730.461399
170.0653770.55090.291724
18-0.167254-1.40930.081555
190.1885271.58860.058302
20-0.080908-0.68170.248811
210.0123210.10380.458802
22-0.146267-1.23250.110919
230.116290.97990.165236
240.1540561.29810.099228
25-0.124258-1.0470.149321
26-0.031223-0.26310.396622
270.0815040.68680.247233
28-0.091085-0.76750.222666
290.0751020.63280.264443
30-0.180365-1.51980.066503
310.1931591.62760.054021
320.009550.08050.468043
33-0.10156-0.85580.197504
34-0.146888-1.23770.109952
350.0864030.7280.234491
360.2371061.99790.02478
37-0.128423-1.08210.141432
38-0.025434-0.21430.415459
39-0.000131-0.00110.499562
40-0.017727-0.14940.440842
41-0.032958-0.27770.391021
420.0194710.16410.435072
430.0423970.35720.360984
440.0169270.14260.443494
45-0.036709-0.30930.378995
46-0.136522-1.15040.126929
470.0954880.80460.211869
480.0869920.7330.232983


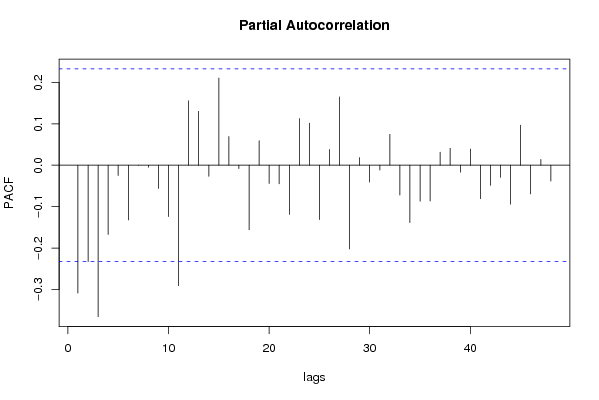
Partial Autocorrelation Function
Time lag kPACF(k)T-STATP-value
1-0.308898-2.60280.005624
2-0.232692-1.96070.026919
3-0.365822-3.08250.001461
4-0.167271-1.40940.081534
5-0.02455-0.20690.418355
6-0.132156-1.11360.13461
7-1.4e-05-1e-040.499953
8-0.004793-0.04040.483949
9-0.055994-0.47180.319254
10-0.123921-1.04420.149972
11-0.291134-2.45310.00831
120.1555621.31080.097077
130.1303081.0980.137957
14-0.026708-0.2250.411294
150.2107011.77540.040059
160.0691240.58250.281054
17-0.008072-0.0680.472981
18-0.155723-1.31210.096849
190.0594380.50080.309017
20-0.043961-0.37040.356086
21-0.044759-0.37710.353595
22-0.11886-1.00150.159984
230.1126170.94890.172938
240.1016460.85650.197307
25-0.131304-1.10640.136148
260.0380240.32040.374804
270.1649511.38990.084451
28-0.202316-1.70470.046307
290.0184870.15580.438326
30-0.040783-0.34360.366065
31-0.011772-0.09920.460632
320.074760.62990.265377
33-0.071949-0.60630.27314
34-0.138467-1.16670.123608
35-0.086898-0.73220.233225
36-0.086234-0.72660.234924
370.0315080.26550.395699
380.0409140.34480.36565
39-0.016948-0.14280.443425
400.0390620.32910.371508
41-0.080764-0.68050.249192
42-0.048441-0.40820.342189
43-0.029227-0.24630.403091
44-0.094018-0.79220.215439
450.0967710.81540.208783
46-0.06943-0.5850.280191
470.0139680.11770.453319
48-0.038317-0.32290.373872

\begin{tabular}{lllllllll}
\hline
Partial Autocorrelation Function \tabularnewline
Time lag k & PACF(k) & T-STAT & P-value \tabularnewline
1 & -0.308898 & -2.6028 & 0.005624 \tabularnewline
2 & -0.232692 & -1.9607 & 0.026919 \tabularnewline
3 & -0.365822 & -3.0825 & 0.001461 \tabularnewline
4 & -0.167271 & -1.4094 & 0.081534 \tabularnewline
5 & -0.02455 & -0.2069 & 0.418355 \tabularnewline
6 & -0.132156 & -1.1136 & 0.13461 \tabularnewline
7 & -1.4e-05 & -1e-04 & 0.499953 \tabularnewline
8 & -0.004793 & -0.0404 & 0.483949 \tabularnewline
9 & -0.055994 & -0.4718 & 0.319254 \tabularnewline
10 & -0.123921 & -1.0442 & 0.149972 \tabularnewline
11 & -0.291134 & -2.4531 & 0.00831 \tabularnewline
12 & 0.155562 & 1.3108 & 0.097077 \tabularnewline
13 & 0.130308 & 1.098 & 0.137957 \tabularnewline
14 & -0.026708 & -0.225 & 0.411294 \tabularnewline
15 & 0.210701 & 1.7754 & 0.040059 \tabularnewline
16 & 0.069124 & 0.5825 & 0.281054 \tabularnewline
17 & -0.008072 & -0.068 & 0.472981 \tabularnewline
18 & -0.155723 & -1.3121 & 0.096849 \tabularnewline
19 & 0.059438 & 0.5008 & 0.309017 \tabularnewline
20 & -0.043961 & -0.3704 & 0.356086 \tabularnewline
21 & -0.044759 & -0.3771 & 0.353595 \tabularnewline
22 & -0.11886 & -1.0015 & 0.159984 \tabularnewline
23 & 0.112617 & 0.9489 & 0.172938 \tabularnewline
24 & 0.101646 & 0.8565 & 0.197307 \tabularnewline
25 & -0.131304 & -1.1064 & 0.136148 \tabularnewline
26 & 0.038024 & 0.3204 & 0.374804 \tabularnewline
27 & 0.164951 & 1.3899 & 0.084451 \tabularnewline
28 & -0.202316 & -1.7047 & 0.046307 \tabularnewline
29 & 0.018487 & 0.1558 & 0.438326 \tabularnewline
30 & -0.040783 & -0.3436 & 0.366065 \tabularnewline
31 & -0.011772 & -0.0992 & 0.460632 \tabularnewline
32 & 0.07476 & 0.6299 & 0.265377 \tabularnewline
33 & -0.071949 & -0.6063 & 0.27314 \tabularnewline
34 & -0.138467 & -1.1667 & 0.123608 \tabularnewline
35 & -0.086898 & -0.7322 & 0.233225 \tabularnewline
36 & -0.086234 & -0.7266 & 0.234924 \tabularnewline
37 & 0.031508 & 0.2655 & 0.395699 \tabularnewline
38 & 0.040914 & 0.3448 & 0.36565 \tabularnewline
39 & -0.016948 & -0.1428 & 0.443425 \tabularnewline
40 & 0.039062 & 0.3291 & 0.371508 \tabularnewline
41 & -0.080764 & -0.6805 & 0.249192 \tabularnewline
42 & -0.048441 & -0.4082 & 0.342189 \tabularnewline
43 & -0.029227 & -0.2463 & 0.403091 \tabularnewline
44 & -0.094018 & -0.7922 & 0.215439 \tabularnewline
45 & 0.096771 & 0.8154 & 0.208783 \tabularnewline
46 & -0.06943 & -0.585 & 0.280191 \tabularnewline
47 & 0.013968 & 0.1177 & 0.453319 \tabularnewline
48 & -0.038317 & -0.3229 & 0.373872 \tabularnewline
\hline
\end{tabular}
%Source: https://freestatistics.org/blog/index.php?pk=29723&T=2

[TABLE]
[ROW][C]Partial Autocorrelation Function[/C][/ROW]
[ROW][C]Time lag k[/C][C]PACF(k)[/C][C]T-STAT[/C][C]P-value[/C][/ROW]
[ROW][C]1[/C][C]-0.308898[/C][C]-2.6028[/C][C]0.005624[/C][/ROW]
[ROW][C]2[/C][C]-0.232692[/C][C]-1.9607[/C][C]0.026919[/C][/ROW]
[ROW][C]3[/C][C]-0.365822[/C][C]-3.0825[/C][C]0.001461[/C][/ROW]
[ROW][C]4[/C][C]-0.167271[/C][C]-1.4094[/C][C]0.081534[/C][/ROW]
[ROW][C]5[/C][C]-0.02455[/C][C]-0.2069[/C][C]0.418355[/C][/ROW]
[ROW][C]6[/C][C]-0.132156[/C][C]-1.1136[/C][C]0.13461[/C][/ROW]
[ROW][C]7[/C][C]-1.4e-05[/C][C]-1e-04[/C][C]0.499953[/C][/ROW]
[ROW][C]8[/C][C]-0.004793[/C][C]-0.0404[/C][C]0.483949[/C][/ROW]
[ROW][C]9[/C][C]-0.055994[/C][C]-0.4718[/C][C]0.319254[/C][/ROW]
[ROW][C]10[/C][C]-0.123921[/C][C]-1.0442[/C][C]0.149972[/C][/ROW]
[ROW][C]11[/C][C]-0.291134[/C][C]-2.4531[/C][C]0.00831[/C][/ROW]
[ROW][C]12[/C][C]0.155562[/C][C]1.3108[/C][C]0.097077[/C][/ROW]
[ROW][C]13[/C][C]0.130308[/C][C]1.098[/C][C]0.137957[/C][/ROW]
[ROW][C]14[/C][C]-0.026708[/C][C]-0.225[/C][C]0.411294[/C][/ROW]
[ROW][C]15[/C][C]0.210701[/C][C]1.7754[/C][C]0.040059[/C][/ROW]
[ROW][C]16[/C][C]0.069124[/C][C]0.5825[/C][C]0.281054[/C][/ROW]
[ROW][C]17[/C][C]-0.008072[/C][C]-0.068[/C][C]0.472981[/C][/ROW]
[ROW][C]18[/C][C]-0.155723[/C][C]-1.3121[/C][C]0.096849[/C][/ROW]
[ROW][C]19[/C][C]0.059438[/C][C]0.5008[/C][C]0.309017[/C][/ROW]
[ROW][C]20[/C][C]-0.043961[/C][C]-0.3704[/C][C]0.356086[/C][/ROW]
[ROW][C]21[/C][C]-0.044759[/C][C]-0.3771[/C][C]0.353595[/C][/ROW]
[ROW][C]22[/C][C]-0.11886[/C][C]-1.0015[/C][C]0.159984[/C][/ROW]
[ROW][C]23[/C][C]0.112617[/C][C]0.9489[/C][C]0.172938[/C][/ROW]
[ROW][C]24[/C][C]0.101646[/C][C]0.8565[/C][C]0.197307[/C][/ROW]
[ROW][C]25[/C][C]-0.131304[/C][C]-1.1064[/C][C]0.136148[/C][/ROW]
[ROW][C]26[/C][C]0.038024[/C][C]0.3204[/C][C]0.374804[/C][/ROW]
[ROW][C]27[/C][C]0.164951[/C][C]1.3899[/C][C]0.084451[/C][/ROW]
[ROW][C]28[/C][C]-0.202316[/C][C]-1.7047[/C][C]0.046307[/C][/ROW]
[ROW][C]29[/C][C]0.018487[/C][C]0.1558[/C][C]0.438326[/C][/ROW]
[ROW][C]30[/C][C]-0.040783[/C][C]-0.3436[/C][C]0.366065[/C][/ROW]
[ROW][C]31[/C][C]-0.011772[/C][C]-0.0992[/C][C]0.460632[/C][/ROW]
[ROW][C]32[/C][C]0.07476[/C][C]0.6299[/C][C]0.265377[/C][/ROW]
[ROW][C]33[/C][C]-0.071949[/C][C]-0.6063[/C][C]0.27314[/C][/ROW]
[ROW][C]34[/C][C]-0.138467[/C][C]-1.1667[/C][C]0.123608[/C][/ROW]
[ROW][C]35[/C][C]-0.086898[/C][C]-0.7322[/C][C]0.233225[/C][/ROW]
[ROW][C]36[/C][C]-0.086234[/C][C]-0.7266[/C][C]0.234924[/C][/ROW]
[ROW][C]37[/C][C]0.031508[/C][C]0.2655[/C][C]0.395699[/C][/ROW]
[ROW][C]38[/C][C]0.040914[/C][C]0.3448[/C][C]0.36565[/C][/ROW]
[ROW][C]39[/C][C]-0.016948[/C][C]-0.1428[/C][C]0.443425[/C][/ROW]
[ROW][C]40[/C][C]0.039062[/C][C]0.3291[/C][C]0.371508[/C][/ROW]
[ROW][C]41[/C][C]-0.080764[/C][C]-0.6805[/C][C]0.249192[/C][/ROW]
[ROW][C]42[/C][C]-0.048441[/C][C]-0.4082[/C][C]0.342189[/C][/ROW]
[ROW][C]43[/C][C]-0.029227[/C][C]-0.2463[/C][C]0.403091[/C][/ROW]
[ROW][C]44[/C][C]-0.094018[/C][C]-0.7922[/C][C]0.215439[/C][/ROW]
[ROW][C]45[/C][C]0.096771[/C][C]0.8154[/C][C]0.208783[/C][/ROW]
[ROW][C]46[/C][C]-0.06943[/C][C]-0.585[/C][C]0.280191[/C][/ROW]
[ROW][C]47[/C][C]0.013968[/C][C]0.1177[/C][C]0.453319[/C][/ROW]
[ROW][C]48[/C][C]-0.038317[/C][C]-0.3229[/C][C]0.373872[/C][/ROW]
[/TABLE]
Source: https://freestatistics.org/blog/index.php?pk=29723&T=2

Globally Unique Identifier (entire table): ba.freestatistics.org/blog/index.php?pk=29723&T=2

As an alternative you can also use a QR Code:  

The GUIDs for individual cells are displayed in the table below:

Partial Autocorrelation Function
Time lag kPACF(k)T-STATP-value
1-0.308898-2.60280.005624
2-0.232692-1.96070.026919
3-0.365822-3.08250.001461
4-0.167271-1.40940.081534
5-0.02455-0.20690.418355
6-0.132156-1.11360.13461
7-1.4e-05-1e-040.499953
8-0.004793-0.04040.483949
9-0.055994-0.47180.319254
10-0.123921-1.04420.149972
11-0.291134-2.45310.00831
120.1555621.31080.097077
130.1303081.0980.137957
14-0.026708-0.2250.411294
150.2107011.77540.040059
160.0691240.58250.281054
17-0.008072-0.0680.472981
18-0.155723-1.31210.096849
190.0594380.50080.309017
20-0.043961-0.37040.356086
21-0.044759-0.37710.353595
22-0.11886-1.00150.159984
230.1126170.94890.172938
240.1016460.85650.197307
25-0.131304-1.10640.136148
260.0380240.32040.374804
270.1649511.38990.084451
28-0.202316-1.70470.046307
290.0184870.15580.438326
30-0.040783-0.34360.366065
31-0.011772-0.09920.460632
320.074760.62990.265377
33-0.071949-0.60630.27314
34-0.138467-1.16670.123608
35-0.086898-0.73220.233225
36-0.086234-0.72660.234924
370.0315080.26550.395699
380.0409140.34480.36565
39-0.016948-0.14280.443425
400.0390620.32910.371508
41-0.080764-0.68050.249192
42-0.048441-0.40820.342189
43-0.029227-0.24630.403091
44-0.094018-0.79220.215439
450.0967710.81540.208783
46-0.06943-0.5850.280191
470.0139680.11770.453319
48-0.038317-0.32290.373872


Parameters (Session):
par1 = 48 ; par2 = 1 ; par3 = 1 ; par4 = 0 ; par5 = 12 ;
Parameters (R input):
par1 = 48 ; par2 = 1 ; par3 = 1 ; par4 = 0 ; par5 = 12 ;
R code (references can be found in the software module):
if (par1 == 'Default') {
par1 = 10*log10(length(x))
} else {
par1 <- as.numeric(par1)
}
par2 <- as.numeric(par2)
par3 <- as.numeric(par3)
par4 <- as.numeric(par4)
par5 <- as.numeric(par5)
if (par2 == 0) {
x <- log(x)
} else {
x <- (x ^ par2 - 1) / par2
}
if (par3 > 0) x <- diff(x,lag=1,difference=par3)
if (par4 > 0) x <- diff(x,lag=par5,difference=par4)
bitmap(file='pic1.png')
racf <- acf(x,par1,main='Autocorrelation',xlab='lags',ylab='ACF')
dev.off()
bitmap(file='pic2.png')
rpacf <- pacf(x,par1,main='Partial Autocorrelation',xlab='lags',ylab='PACF')
dev.off()
(myacf <- c(racf$acf))
(mypacf <- c(rpacf$acf))
lengthx <- length(x)
sqrtn <- sqrt(lengthx)
load(file='createtable')
a<-table.start()
a<-table.row.start(a)
a<-table.element(a,'Autocorrelation Function',4,TRUE)
a<-table.row.end(a)
a<-table.row.start(a)
a<-table.element(a,'Time lag k',header=TRUE)
a<-table.element(a,hyperlink('basics.htm','ACF(k)','click here for more information about the Autocorrelation Function'),header=TRUE)
a<-table.element(a,'T-STAT',header=TRUE)
a<-table.element(a,'P-value',header=TRUE)
a<-table.row.end(a)
for (i in 2:(par1+1)) {
a<-table.row.start(a)
a<-table.element(a,i-1,header=TRUE)
a<-table.element(a,round(myacf[i],6))
mytstat <- myacf[i]*sqrtn
a<-table.element(a,round(mytstat,4))
a<-table.element(a,round(1-pt(abs(mytstat),lengthx),6))
a<-table.row.end(a)
}
a<-table.end(a)
table.save(a,file='mytable.tab')
a<-table.start()
a<-table.row.start(a)
a<-table.element(a,'Partial Autocorrelation Function',4,TRUE)
a<-table.row.end(a)
a<-table.row.start(a)
a<-table.element(a,'Time lag k',header=TRUE)
a<-table.element(a,hyperlink('basics.htm','PACF(k)','click here for more information about the Partial Autocorrelation Function'),header=TRUE)
a<-table.element(a,'T-STAT',header=TRUE)
a<-table.element(a,'P-value',header=TRUE)
a<-table.row.end(a)
for (i in 1:par1) {
a<-table.row.start(a)
a<-table.element(a,i,header=TRUE)
a<-table.element(a,round(mypacf[i],6))
mytstat <- mypacf[i]*sqrtn
a<-table.element(a,round(mytstat,4))
a<-table.element(a,round(1-pt(abs(mytstat),lengthx),6))
a<-table.row.end(a)
}
a<-table.end(a)
table.save(a,file='mytable1.tab')