Free Statistics

of Irreproducible Research!

Author's title

(Partial) Autocorrelation voor het aantal faillissementen in het Vlaamse Ge...

Author*The author of this computation has been verified*
R Software Modulerwasp_autocorrelation.wasp
Title produced by software(Partial) Autocorrelation Function
Date of computationSat, 06 Dec 2008 01:40:42 -0700
Cite this page as followsStatistical Computations at FreeStatistics.org, Office for Research Development and Education, URL https://freestatistics.org/blog/index.php?v=date/2008/Dec/06/t12285529168dwb1bp5reu07pv.htm/, Retrieved Sun, 26 May 2024 01:21:00 +0000
Statistical Computations at FreeStatistics.org, Office for Research Development and Education, URL https://freestatistics.org/blog/index.php?pk=29421, Retrieved Sun, 26 May 2024 01:21:00 +0000
QR Codes:

Original text written by user:
IsPrivate?No (this computation is public)
User-defined keywords
Estimated Impact216
Family? (F = Feedback message, R = changed R code, M = changed R Module, P = changed Parameters, D = changed Data)
-       [(Partial) Autocorrelation Function] [(Partial) Autocor...] [2008-12-06 08:40:42] [6fc58909ffe15c247a4f6748c8841ab4] [Current]
Feedback Forum

Post a new message
Dataseries X:
293
301
362
330
328
405
232
159
336
361
329
339
290
328
375
294
340
364
248
145
380
305
291
319
334
318
362
296
300
342
215
185
343
333
316
252
320
324
343
295
301
367
196
182
342
361
334
330
345
323
366
323
316
358
235
169
430
409
407
341
326
374
364
349
300
385
304
196
443
414
325
388
356
386
444
387
327
448
225
182
460
411
342
361
377
331
428
340
352
461
221
198
422
329
320
375
364
351
380
319
322
386
221
187
344
342
365
313
356
337
389
326
343
357
220
218
391
425
332
298


Summary of computational transaction
Raw Inputview raw input (R code)
Raw Outputview raw output of R engine
Computing time3 seconds
R Server'Sir Ronald Aylmer Fisher' @ 193.190.124.24

\begin{tabular}{lllllllll}
\hline
Summary of computational transaction \tabularnewline
Raw Input & view raw input (R code)  \tabularnewline
Raw Output & view raw output of R engine  \tabularnewline
Computing time & 3 seconds \tabularnewline
R Server & 'Sir Ronald Aylmer Fisher' @ 193.190.124.24 \tabularnewline
\hline
\end{tabular}
%Source: https://freestatistics.org/blog/index.php?pk=29421&T=0

[TABLE]
[ROW][C]Summary of computational transaction[/C][/ROW]
[ROW][C]Raw Input[/C][C]view raw input (R code) [/C][/ROW]
[ROW][C]Raw Output[/C][C]view raw output of R engine [/C][/ROW]
[ROW][C]Computing time[/C][C]3 seconds[/C][/ROW]
[ROW][C]R Server[/C][C]'Sir Ronald Aylmer Fisher' @ 193.190.124.24[/C][/ROW]
[/TABLE]
Source: https://freestatistics.org/blog/index.php?pk=29421&T=0

Globally Unique Identifier (entire table): ba.freestatistics.org/blog/index.php?pk=29421&T=0

As an alternative you can also use a QR Code:  

The GUIDs for individual cells are displayed in the table below:

Summary of computational transaction
Raw Inputview raw input (R code)
Raw Outputview raw output of R engine
Computing time3 seconds
R Server'Sir Ronald Aylmer Fisher' @ 193.190.124.24


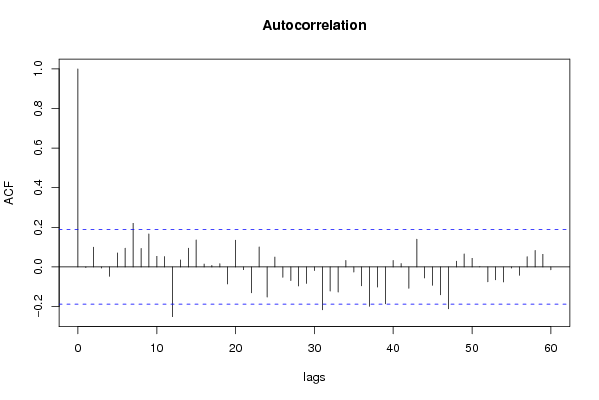
Autocorrelation Function
Time lag kACF(k)T-STATP-value
1-0.003321-0.03450.486266
20.0995941.0350.151488
3-0.005642-0.05860.476676
4-0.047858-0.49730.309977
50.0700730.72820.234029
60.0943230.98020.164582
70.2200532.28690.012077
80.0925880.96220.169049
90.166221.72740.043476
100.0533190.55410.290325
110.0518370.53870.295599
12-0.251442-2.61310.005126
130.0348040.36170.359145
140.0943220.98020.164583
150.1355151.40830.080955
160.0139670.14520.44243
170.007120.0740.470578
180.0162940.16930.432926
19-0.086071-0.89450.186529
200.1350771.40380.08163
21-0.014012-0.14560.442249
22-0.131226-1.36370.087743
230.1010261.04990.148056
24-0.152358-1.58340.058132
250.0495460.51490.303837
26-0.052163-0.54210.294436
27-0.068855-0.71560.237904
28-0.095991-0.99760.16036
29-0.083423-0.8670.193945
30-0.01866-0.19390.4233
31-0.216898-2.25410.013105
32-0.121608-1.26380.104514
33-0.126754-1.31730.095269
340.0325440.33820.367933
35-0.026454-0.27490.391953
36-0.094994-0.98720.162873
37-0.199256-2.07070.020384
38-0.101507-1.05490.146913
39-0.186046-1.93340.027899
400.0319810.33240.370132
410.0165990.17250.431682
42-0.108048-1.12290.131992
430.1402041.4570.074002
44-0.055825-0.58020.28151
45-0.092625-0.96260.168953
46-0.140632-1.46150.073392
47-0.211691-2.20.01497
480.0285510.29670.38363
490.0650610.67610.250201
500.0432290.44930.327075
510.000690.00720.497145
52-0.074958-0.7790.218846
53-0.065513-0.68080.248718
54-0.075964-0.78940.215792
55-0.005489-0.0570.477309
56-0.042197-0.43850.33094
570.0513530.53370.29733
580.0833240.86590.194225
590.0633780.65860.255762
60-0.014214-0.14770.44142

\begin{tabular}{lllllllll}
\hline
Autocorrelation Function \tabularnewline
Time lag k & ACF(k) & T-STAT & P-value \tabularnewline
1 & -0.003321 & -0.0345 & 0.486266 \tabularnewline
2 & 0.099594 & 1.035 & 0.151488 \tabularnewline
3 & -0.005642 & -0.0586 & 0.476676 \tabularnewline
4 & -0.047858 & -0.4973 & 0.309977 \tabularnewline
5 & 0.070073 & 0.7282 & 0.234029 \tabularnewline
6 & 0.094323 & 0.9802 & 0.164582 \tabularnewline
7 & 0.220053 & 2.2869 & 0.012077 \tabularnewline
8 & 0.092588 & 0.9622 & 0.169049 \tabularnewline
9 & 0.16622 & 1.7274 & 0.043476 \tabularnewline
10 & 0.053319 & 0.5541 & 0.290325 \tabularnewline
11 & 0.051837 & 0.5387 & 0.295599 \tabularnewline
12 & -0.251442 & -2.6131 & 0.005126 \tabularnewline
13 & 0.034804 & 0.3617 & 0.359145 \tabularnewline
14 & 0.094322 & 0.9802 & 0.164583 \tabularnewline
15 & 0.135515 & 1.4083 & 0.080955 \tabularnewline
16 & 0.013967 & 0.1452 & 0.44243 \tabularnewline
17 & 0.00712 & 0.074 & 0.470578 \tabularnewline
18 & 0.016294 & 0.1693 & 0.432926 \tabularnewline
19 & -0.086071 & -0.8945 & 0.186529 \tabularnewline
20 & 0.135077 & 1.4038 & 0.08163 \tabularnewline
21 & -0.014012 & -0.1456 & 0.442249 \tabularnewline
22 & -0.131226 & -1.3637 & 0.087743 \tabularnewline
23 & 0.101026 & 1.0499 & 0.148056 \tabularnewline
24 & -0.152358 & -1.5834 & 0.058132 \tabularnewline
25 & 0.049546 & 0.5149 & 0.303837 \tabularnewline
26 & -0.052163 & -0.5421 & 0.294436 \tabularnewline
27 & -0.068855 & -0.7156 & 0.237904 \tabularnewline
28 & -0.095991 & -0.9976 & 0.16036 \tabularnewline
29 & -0.083423 & -0.867 & 0.193945 \tabularnewline
30 & -0.01866 & -0.1939 & 0.4233 \tabularnewline
31 & -0.216898 & -2.2541 & 0.013105 \tabularnewline
32 & -0.121608 & -1.2638 & 0.104514 \tabularnewline
33 & -0.126754 & -1.3173 & 0.095269 \tabularnewline
34 & 0.032544 & 0.3382 & 0.367933 \tabularnewline
35 & -0.026454 & -0.2749 & 0.391953 \tabularnewline
36 & -0.094994 & -0.9872 & 0.162873 \tabularnewline
37 & -0.199256 & -2.0707 & 0.020384 \tabularnewline
38 & -0.101507 & -1.0549 & 0.146913 \tabularnewline
39 & -0.186046 & -1.9334 & 0.027899 \tabularnewline
40 & 0.031981 & 0.3324 & 0.370132 \tabularnewline
41 & 0.016599 & 0.1725 & 0.431682 \tabularnewline
42 & -0.108048 & -1.1229 & 0.131992 \tabularnewline
43 & 0.140204 & 1.457 & 0.074002 \tabularnewline
44 & -0.055825 & -0.5802 & 0.28151 \tabularnewline
45 & -0.092625 & -0.9626 & 0.168953 \tabularnewline
46 & -0.140632 & -1.4615 & 0.073392 \tabularnewline
47 & -0.211691 & -2.2 & 0.01497 \tabularnewline
48 & 0.028551 & 0.2967 & 0.38363 \tabularnewline
49 & 0.065061 & 0.6761 & 0.250201 \tabularnewline
50 & 0.043229 & 0.4493 & 0.327075 \tabularnewline
51 & 0.00069 & 0.0072 & 0.497145 \tabularnewline
52 & -0.074958 & -0.779 & 0.218846 \tabularnewline
53 & -0.065513 & -0.6808 & 0.248718 \tabularnewline
54 & -0.075964 & -0.7894 & 0.215792 \tabularnewline
55 & -0.005489 & -0.057 & 0.477309 \tabularnewline
56 & -0.042197 & -0.4385 & 0.33094 \tabularnewline
57 & 0.051353 & 0.5337 & 0.29733 \tabularnewline
58 & 0.083324 & 0.8659 & 0.194225 \tabularnewline
59 & 0.063378 & 0.6586 & 0.255762 \tabularnewline
60 & -0.014214 & -0.1477 & 0.44142 \tabularnewline
\hline
\end{tabular}
%Source: https://freestatistics.org/blog/index.php?pk=29421&T=1

[TABLE]
[ROW][C]Autocorrelation Function[/C][/ROW]
[ROW][C]Time lag k[/C][C]ACF(k)[/C][C]T-STAT[/C][C]P-value[/C][/ROW]
[ROW][C]1[/C][C]-0.003321[/C][C]-0.0345[/C][C]0.486266[/C][/ROW]
[ROW][C]2[/C][C]0.099594[/C][C]1.035[/C][C]0.151488[/C][/ROW]
[ROW][C]3[/C][C]-0.005642[/C][C]-0.0586[/C][C]0.476676[/C][/ROW]
[ROW][C]4[/C][C]-0.047858[/C][C]-0.4973[/C][C]0.309977[/C][/ROW]
[ROW][C]5[/C][C]0.070073[/C][C]0.7282[/C][C]0.234029[/C][/ROW]
[ROW][C]6[/C][C]0.094323[/C][C]0.9802[/C][C]0.164582[/C][/ROW]
[ROW][C]7[/C][C]0.220053[/C][C]2.2869[/C][C]0.012077[/C][/ROW]
[ROW][C]8[/C][C]0.092588[/C][C]0.9622[/C][C]0.169049[/C][/ROW]
[ROW][C]9[/C][C]0.16622[/C][C]1.7274[/C][C]0.043476[/C][/ROW]
[ROW][C]10[/C][C]0.053319[/C][C]0.5541[/C][C]0.290325[/C][/ROW]
[ROW][C]11[/C][C]0.051837[/C][C]0.5387[/C][C]0.295599[/C][/ROW]
[ROW][C]12[/C][C]-0.251442[/C][C]-2.6131[/C][C]0.005126[/C][/ROW]
[ROW][C]13[/C][C]0.034804[/C][C]0.3617[/C][C]0.359145[/C][/ROW]
[ROW][C]14[/C][C]0.094322[/C][C]0.9802[/C][C]0.164583[/C][/ROW]
[ROW][C]15[/C][C]0.135515[/C][C]1.4083[/C][C]0.080955[/C][/ROW]
[ROW][C]16[/C][C]0.013967[/C][C]0.1452[/C][C]0.44243[/C][/ROW]
[ROW][C]17[/C][C]0.00712[/C][C]0.074[/C][C]0.470578[/C][/ROW]
[ROW][C]18[/C][C]0.016294[/C][C]0.1693[/C][C]0.432926[/C][/ROW]
[ROW][C]19[/C][C]-0.086071[/C][C]-0.8945[/C][C]0.186529[/C][/ROW]
[ROW][C]20[/C][C]0.135077[/C][C]1.4038[/C][C]0.08163[/C][/ROW]
[ROW][C]21[/C][C]-0.014012[/C][C]-0.1456[/C][C]0.442249[/C][/ROW]
[ROW][C]22[/C][C]-0.131226[/C][C]-1.3637[/C][C]0.087743[/C][/ROW]
[ROW][C]23[/C][C]0.101026[/C][C]1.0499[/C][C]0.148056[/C][/ROW]
[ROW][C]24[/C][C]-0.152358[/C][C]-1.5834[/C][C]0.058132[/C][/ROW]
[ROW][C]25[/C][C]0.049546[/C][C]0.5149[/C][C]0.303837[/C][/ROW]
[ROW][C]26[/C][C]-0.052163[/C][C]-0.5421[/C][C]0.294436[/C][/ROW]
[ROW][C]27[/C][C]-0.068855[/C][C]-0.7156[/C][C]0.237904[/C][/ROW]
[ROW][C]28[/C][C]-0.095991[/C][C]-0.9976[/C][C]0.16036[/C][/ROW]
[ROW][C]29[/C][C]-0.083423[/C][C]-0.867[/C][C]0.193945[/C][/ROW]
[ROW][C]30[/C][C]-0.01866[/C][C]-0.1939[/C][C]0.4233[/C][/ROW]
[ROW][C]31[/C][C]-0.216898[/C][C]-2.2541[/C][C]0.013105[/C][/ROW]
[ROW][C]32[/C][C]-0.121608[/C][C]-1.2638[/C][C]0.104514[/C][/ROW]
[ROW][C]33[/C][C]-0.126754[/C][C]-1.3173[/C][C]0.095269[/C][/ROW]
[ROW][C]34[/C][C]0.032544[/C][C]0.3382[/C][C]0.367933[/C][/ROW]
[ROW][C]35[/C][C]-0.026454[/C][C]-0.2749[/C][C]0.391953[/C][/ROW]
[ROW][C]36[/C][C]-0.094994[/C][C]-0.9872[/C][C]0.162873[/C][/ROW]
[ROW][C]37[/C][C]-0.199256[/C][C]-2.0707[/C][C]0.020384[/C][/ROW]
[ROW][C]38[/C][C]-0.101507[/C][C]-1.0549[/C][C]0.146913[/C][/ROW]
[ROW][C]39[/C][C]-0.186046[/C][C]-1.9334[/C][C]0.027899[/C][/ROW]
[ROW][C]40[/C][C]0.031981[/C][C]0.3324[/C][C]0.370132[/C][/ROW]
[ROW][C]41[/C][C]0.016599[/C][C]0.1725[/C][C]0.431682[/C][/ROW]
[ROW][C]42[/C][C]-0.108048[/C][C]-1.1229[/C][C]0.131992[/C][/ROW]
[ROW][C]43[/C][C]0.140204[/C][C]1.457[/C][C]0.074002[/C][/ROW]
[ROW][C]44[/C][C]-0.055825[/C][C]-0.5802[/C][C]0.28151[/C][/ROW]
[ROW][C]45[/C][C]-0.092625[/C][C]-0.9626[/C][C]0.168953[/C][/ROW]
[ROW][C]46[/C][C]-0.140632[/C][C]-1.4615[/C][C]0.073392[/C][/ROW]
[ROW][C]47[/C][C]-0.211691[/C][C]-2.2[/C][C]0.01497[/C][/ROW]
[ROW][C]48[/C][C]0.028551[/C][C]0.2967[/C][C]0.38363[/C][/ROW]
[ROW][C]49[/C][C]0.065061[/C][C]0.6761[/C][C]0.250201[/C][/ROW]
[ROW][C]50[/C][C]0.043229[/C][C]0.4493[/C][C]0.327075[/C][/ROW]
[ROW][C]51[/C][C]0.00069[/C][C]0.0072[/C][C]0.497145[/C][/ROW]
[ROW][C]52[/C][C]-0.074958[/C][C]-0.779[/C][C]0.218846[/C][/ROW]
[ROW][C]53[/C][C]-0.065513[/C][C]-0.6808[/C][C]0.248718[/C][/ROW]
[ROW][C]54[/C][C]-0.075964[/C][C]-0.7894[/C][C]0.215792[/C][/ROW]
[ROW][C]55[/C][C]-0.005489[/C][C]-0.057[/C][C]0.477309[/C][/ROW]
[ROW][C]56[/C][C]-0.042197[/C][C]-0.4385[/C][C]0.33094[/C][/ROW]
[ROW][C]57[/C][C]0.051353[/C][C]0.5337[/C][C]0.29733[/C][/ROW]
[ROW][C]58[/C][C]0.083324[/C][C]0.8659[/C][C]0.194225[/C][/ROW]
[ROW][C]59[/C][C]0.063378[/C][C]0.6586[/C][C]0.255762[/C][/ROW]
[ROW][C]60[/C][C]-0.014214[/C][C]-0.1477[/C][C]0.44142[/C][/ROW]
[/TABLE]
Source: https://freestatistics.org/blog/index.php?pk=29421&T=1

Globally Unique Identifier (entire table): ba.freestatistics.org/blog/index.php?pk=29421&T=1

As an alternative you can also use a QR Code:  

The GUIDs for individual cells are displayed in the table below:

Autocorrelation Function
Time lag kACF(k)T-STATP-value
1-0.003321-0.03450.486266
20.0995941.0350.151488
3-0.005642-0.05860.476676
4-0.047858-0.49730.309977
50.0700730.72820.234029
60.0943230.98020.164582
70.2200532.28690.012077
80.0925880.96220.169049
90.166221.72740.043476
100.0533190.55410.290325
110.0518370.53870.295599
12-0.251442-2.61310.005126
130.0348040.36170.359145
140.0943220.98020.164583
150.1355151.40830.080955
160.0139670.14520.44243
170.007120.0740.470578
180.0162940.16930.432926
19-0.086071-0.89450.186529
200.1350771.40380.08163
21-0.014012-0.14560.442249
22-0.131226-1.36370.087743
230.1010261.04990.148056
24-0.152358-1.58340.058132
250.0495460.51490.303837
26-0.052163-0.54210.294436
27-0.068855-0.71560.237904
28-0.095991-0.99760.16036
29-0.083423-0.8670.193945
30-0.01866-0.19390.4233
31-0.216898-2.25410.013105
32-0.121608-1.26380.104514
33-0.126754-1.31730.095269
340.0325440.33820.367933
35-0.026454-0.27490.391953
36-0.094994-0.98720.162873
37-0.199256-2.07070.020384
38-0.101507-1.05490.146913
39-0.186046-1.93340.027899
400.0319810.33240.370132
410.0165990.17250.431682
42-0.108048-1.12290.131992
430.1402041.4570.074002
44-0.055825-0.58020.28151
45-0.092625-0.96260.168953
46-0.140632-1.46150.073392
47-0.211691-2.20.01497
480.0285510.29670.38363
490.0650610.67610.250201
500.0432290.44930.327075
510.000690.00720.497145
52-0.074958-0.7790.218846
53-0.065513-0.68080.248718
54-0.075964-0.78940.215792
55-0.005489-0.0570.477309
56-0.042197-0.43850.33094
570.0513530.53370.29733
580.0833240.86590.194225
590.0633780.65860.255762
60-0.014214-0.14770.44142


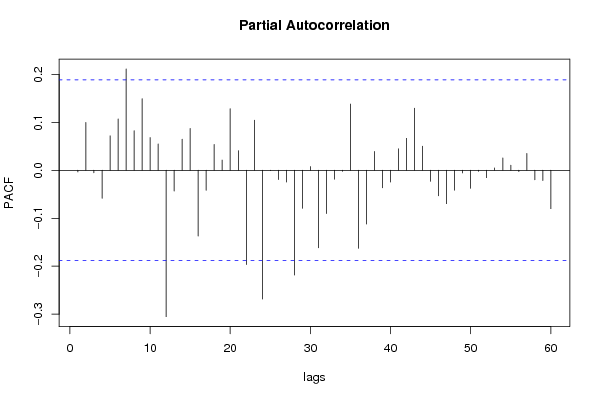
Partial Autocorrelation Function
Time lag kPACF(k)T-STATP-value
1-0.003321-0.03450.486266
20.0995841.03490.151512
3-0.005064-0.05260.479064
4-0.058386-0.60680.27264
50.0718160.74630.228543
60.1072211.11430.133818
70.2113572.19650.015097
80.0825750.85810.196358
90.1492371.55090.061923
100.068180.70850.240067
110.0550050.57160.28438
12-0.305226-3.1720.000986
13-0.043133-0.44830.327434
140.0647090.67250.251358
150.0870510.90470.18383
16-0.13716-1.42540.078462
17-0.041494-0.43120.333584
180.053970.56090.288021
190.0212660.2210.412754
200.1284241.33460.092403
210.0408120.42410.336158
22-0.196601-2.04310.021737
230.1043691.08460.14025
24-0.268451-2.78980.003118
25-0.000668-0.00690.497237
26-0.019073-0.19820.421624
27-0.024573-0.25540.399462
28-0.218528-2.2710.012565
29-0.079302-0.82410.20584
300.0077580.08060.467947
31-0.161583-1.67920.048001
32-0.090312-0.93860.175027
33-0.018473-0.1920.424061
34-0.002204-0.02290.490884
350.1380961.43510.077068
36-0.162439-1.68810.047137
37-0.112067-1.16460.123366
380.0394240.40970.341416
39-0.036644-0.38080.352045
40-0.024509-0.25470.399717
410.0447430.4650.32144
420.0665910.6920.2452
430.1296341.34720.090368
440.0500340.520.302074
45-0.022769-0.23660.406698
46-0.052985-0.55060.291511
47-0.069588-0.72320.235568
48-0.041401-0.43030.333933
49-0.005471-0.05690.477383
50-0.037382-0.38850.349209
51-0.002072-0.02150.491429
52-0.015336-0.15940.436834
530.0046650.04850.48071
540.0257820.26790.39463
550.0104810.10890.456732
56-0.002398-0.02490.490083
570.0349010.36270.358766
58-0.019976-0.20760.417967
59-0.021157-0.21990.413194
60-0.079987-0.83130.203832

\begin{tabular}{lllllllll}
\hline
Partial Autocorrelation Function \tabularnewline
Time lag k & PACF(k) & T-STAT & P-value \tabularnewline
1 & -0.003321 & -0.0345 & 0.486266 \tabularnewline
2 & 0.099584 & 1.0349 & 0.151512 \tabularnewline
3 & -0.005064 & -0.0526 & 0.479064 \tabularnewline
4 & -0.058386 & -0.6068 & 0.27264 \tabularnewline
5 & 0.071816 & 0.7463 & 0.228543 \tabularnewline
6 & 0.107221 & 1.1143 & 0.133818 \tabularnewline
7 & 0.211357 & 2.1965 & 0.015097 \tabularnewline
8 & 0.082575 & 0.8581 & 0.196358 \tabularnewline
9 & 0.149237 & 1.5509 & 0.061923 \tabularnewline
10 & 0.06818 & 0.7085 & 0.240067 \tabularnewline
11 & 0.055005 & 0.5716 & 0.28438 \tabularnewline
12 & -0.305226 & -3.172 & 0.000986 \tabularnewline
13 & -0.043133 & -0.4483 & 0.327434 \tabularnewline
14 & 0.064709 & 0.6725 & 0.251358 \tabularnewline
15 & 0.087051 & 0.9047 & 0.18383 \tabularnewline
16 & -0.13716 & -1.4254 & 0.078462 \tabularnewline
17 & -0.041494 & -0.4312 & 0.333584 \tabularnewline
18 & 0.05397 & 0.5609 & 0.288021 \tabularnewline
19 & 0.021266 & 0.221 & 0.412754 \tabularnewline
20 & 0.128424 & 1.3346 & 0.092403 \tabularnewline
21 & 0.040812 & 0.4241 & 0.336158 \tabularnewline
22 & -0.196601 & -2.0431 & 0.021737 \tabularnewline
23 & 0.104369 & 1.0846 & 0.14025 \tabularnewline
24 & -0.268451 & -2.7898 & 0.003118 \tabularnewline
25 & -0.000668 & -0.0069 & 0.497237 \tabularnewline
26 & -0.019073 & -0.1982 & 0.421624 \tabularnewline
27 & -0.024573 & -0.2554 & 0.399462 \tabularnewline
28 & -0.218528 & -2.271 & 0.012565 \tabularnewline
29 & -0.079302 & -0.8241 & 0.20584 \tabularnewline
30 & 0.007758 & 0.0806 & 0.467947 \tabularnewline
31 & -0.161583 & -1.6792 & 0.048001 \tabularnewline
32 & -0.090312 & -0.9386 & 0.175027 \tabularnewline
33 & -0.018473 & -0.192 & 0.424061 \tabularnewline
34 & -0.002204 & -0.0229 & 0.490884 \tabularnewline
35 & 0.138096 & 1.4351 & 0.077068 \tabularnewline
36 & -0.162439 & -1.6881 & 0.047137 \tabularnewline
37 & -0.112067 & -1.1646 & 0.123366 \tabularnewline
38 & 0.039424 & 0.4097 & 0.341416 \tabularnewline
39 & -0.036644 & -0.3808 & 0.352045 \tabularnewline
40 & -0.024509 & -0.2547 & 0.399717 \tabularnewline
41 & 0.044743 & 0.465 & 0.32144 \tabularnewline
42 & 0.066591 & 0.692 & 0.2452 \tabularnewline
43 & 0.129634 & 1.3472 & 0.090368 \tabularnewline
44 & 0.050034 & 0.52 & 0.302074 \tabularnewline
45 & -0.022769 & -0.2366 & 0.406698 \tabularnewline
46 & -0.052985 & -0.5506 & 0.291511 \tabularnewline
47 & -0.069588 & -0.7232 & 0.235568 \tabularnewline
48 & -0.041401 & -0.4303 & 0.333933 \tabularnewline
49 & -0.005471 & -0.0569 & 0.477383 \tabularnewline
50 & -0.037382 & -0.3885 & 0.349209 \tabularnewline
51 & -0.002072 & -0.0215 & 0.491429 \tabularnewline
52 & -0.015336 & -0.1594 & 0.436834 \tabularnewline
53 & 0.004665 & 0.0485 & 0.48071 \tabularnewline
54 & 0.025782 & 0.2679 & 0.39463 \tabularnewline
55 & 0.010481 & 0.1089 & 0.456732 \tabularnewline
56 & -0.002398 & -0.0249 & 0.490083 \tabularnewline
57 & 0.034901 & 0.3627 & 0.358766 \tabularnewline
58 & -0.019976 & -0.2076 & 0.417967 \tabularnewline
59 & -0.021157 & -0.2199 & 0.413194 \tabularnewline
60 & -0.079987 & -0.8313 & 0.203832 \tabularnewline
\hline
\end{tabular}
%Source: https://freestatistics.org/blog/index.php?pk=29421&T=2

[TABLE]
[ROW][C]Partial Autocorrelation Function[/C][/ROW]
[ROW][C]Time lag k[/C][C]PACF(k)[/C][C]T-STAT[/C][C]P-value[/C][/ROW]
[ROW][C]1[/C][C]-0.003321[/C][C]-0.0345[/C][C]0.486266[/C][/ROW]
[ROW][C]2[/C][C]0.099584[/C][C]1.0349[/C][C]0.151512[/C][/ROW]
[ROW][C]3[/C][C]-0.005064[/C][C]-0.0526[/C][C]0.479064[/C][/ROW]
[ROW][C]4[/C][C]-0.058386[/C][C]-0.6068[/C][C]0.27264[/C][/ROW]
[ROW][C]5[/C][C]0.071816[/C][C]0.7463[/C][C]0.228543[/C][/ROW]
[ROW][C]6[/C][C]0.107221[/C][C]1.1143[/C][C]0.133818[/C][/ROW]
[ROW][C]7[/C][C]0.211357[/C][C]2.1965[/C][C]0.015097[/C][/ROW]
[ROW][C]8[/C][C]0.082575[/C][C]0.8581[/C][C]0.196358[/C][/ROW]
[ROW][C]9[/C][C]0.149237[/C][C]1.5509[/C][C]0.061923[/C][/ROW]
[ROW][C]10[/C][C]0.06818[/C][C]0.7085[/C][C]0.240067[/C][/ROW]
[ROW][C]11[/C][C]0.055005[/C][C]0.5716[/C][C]0.28438[/C][/ROW]
[ROW][C]12[/C][C]-0.305226[/C][C]-3.172[/C][C]0.000986[/C][/ROW]
[ROW][C]13[/C][C]-0.043133[/C][C]-0.4483[/C][C]0.327434[/C][/ROW]
[ROW][C]14[/C][C]0.064709[/C][C]0.6725[/C][C]0.251358[/C][/ROW]
[ROW][C]15[/C][C]0.087051[/C][C]0.9047[/C][C]0.18383[/C][/ROW]
[ROW][C]16[/C][C]-0.13716[/C][C]-1.4254[/C][C]0.078462[/C][/ROW]
[ROW][C]17[/C][C]-0.041494[/C][C]-0.4312[/C][C]0.333584[/C][/ROW]
[ROW][C]18[/C][C]0.05397[/C][C]0.5609[/C][C]0.288021[/C][/ROW]
[ROW][C]19[/C][C]0.021266[/C][C]0.221[/C][C]0.412754[/C][/ROW]
[ROW][C]20[/C][C]0.128424[/C][C]1.3346[/C][C]0.092403[/C][/ROW]
[ROW][C]21[/C][C]0.040812[/C][C]0.4241[/C][C]0.336158[/C][/ROW]
[ROW][C]22[/C][C]-0.196601[/C][C]-2.0431[/C][C]0.021737[/C][/ROW]
[ROW][C]23[/C][C]0.104369[/C][C]1.0846[/C][C]0.14025[/C][/ROW]
[ROW][C]24[/C][C]-0.268451[/C][C]-2.7898[/C][C]0.003118[/C][/ROW]
[ROW][C]25[/C][C]-0.000668[/C][C]-0.0069[/C][C]0.497237[/C][/ROW]
[ROW][C]26[/C][C]-0.019073[/C][C]-0.1982[/C][C]0.421624[/C][/ROW]
[ROW][C]27[/C][C]-0.024573[/C][C]-0.2554[/C][C]0.399462[/C][/ROW]
[ROW][C]28[/C][C]-0.218528[/C][C]-2.271[/C][C]0.012565[/C][/ROW]
[ROW][C]29[/C][C]-0.079302[/C][C]-0.8241[/C][C]0.20584[/C][/ROW]
[ROW][C]30[/C][C]0.007758[/C][C]0.0806[/C][C]0.467947[/C][/ROW]
[ROW][C]31[/C][C]-0.161583[/C][C]-1.6792[/C][C]0.048001[/C][/ROW]
[ROW][C]32[/C][C]-0.090312[/C][C]-0.9386[/C][C]0.175027[/C][/ROW]
[ROW][C]33[/C][C]-0.018473[/C][C]-0.192[/C][C]0.424061[/C][/ROW]
[ROW][C]34[/C][C]-0.002204[/C][C]-0.0229[/C][C]0.490884[/C][/ROW]
[ROW][C]35[/C][C]0.138096[/C][C]1.4351[/C][C]0.077068[/C][/ROW]
[ROW][C]36[/C][C]-0.162439[/C][C]-1.6881[/C][C]0.047137[/C][/ROW]
[ROW][C]37[/C][C]-0.112067[/C][C]-1.1646[/C][C]0.123366[/C][/ROW]
[ROW][C]38[/C][C]0.039424[/C][C]0.4097[/C][C]0.341416[/C][/ROW]
[ROW][C]39[/C][C]-0.036644[/C][C]-0.3808[/C][C]0.352045[/C][/ROW]
[ROW][C]40[/C][C]-0.024509[/C][C]-0.2547[/C][C]0.399717[/C][/ROW]
[ROW][C]41[/C][C]0.044743[/C][C]0.465[/C][C]0.32144[/C][/ROW]
[ROW][C]42[/C][C]0.066591[/C][C]0.692[/C][C]0.2452[/C][/ROW]
[ROW][C]43[/C][C]0.129634[/C][C]1.3472[/C][C]0.090368[/C][/ROW]
[ROW][C]44[/C][C]0.050034[/C][C]0.52[/C][C]0.302074[/C][/ROW]
[ROW][C]45[/C][C]-0.022769[/C][C]-0.2366[/C][C]0.406698[/C][/ROW]
[ROW][C]46[/C][C]-0.052985[/C][C]-0.5506[/C][C]0.291511[/C][/ROW]
[ROW][C]47[/C][C]-0.069588[/C][C]-0.7232[/C][C]0.235568[/C][/ROW]
[ROW][C]48[/C][C]-0.041401[/C][C]-0.4303[/C][C]0.333933[/C][/ROW]
[ROW][C]49[/C][C]-0.005471[/C][C]-0.0569[/C][C]0.477383[/C][/ROW]
[ROW][C]50[/C][C]-0.037382[/C][C]-0.3885[/C][C]0.349209[/C][/ROW]
[ROW][C]51[/C][C]-0.002072[/C][C]-0.0215[/C][C]0.491429[/C][/ROW]
[ROW][C]52[/C][C]-0.015336[/C][C]-0.1594[/C][C]0.436834[/C][/ROW]
[ROW][C]53[/C][C]0.004665[/C][C]0.0485[/C][C]0.48071[/C][/ROW]
[ROW][C]54[/C][C]0.025782[/C][C]0.2679[/C][C]0.39463[/C][/ROW]
[ROW][C]55[/C][C]0.010481[/C][C]0.1089[/C][C]0.456732[/C][/ROW]
[ROW][C]56[/C][C]-0.002398[/C][C]-0.0249[/C][C]0.490083[/C][/ROW]
[ROW][C]57[/C][C]0.034901[/C][C]0.3627[/C][C]0.358766[/C][/ROW]
[ROW][C]58[/C][C]-0.019976[/C][C]-0.2076[/C][C]0.417967[/C][/ROW]
[ROW][C]59[/C][C]-0.021157[/C][C]-0.2199[/C][C]0.413194[/C][/ROW]
[ROW][C]60[/C][C]-0.079987[/C][C]-0.8313[/C][C]0.203832[/C][/ROW]
[/TABLE]
Source: https://freestatistics.org/blog/index.php?pk=29421&T=2

Globally Unique Identifier (entire table): ba.freestatistics.org/blog/index.php?pk=29421&T=2

As an alternative you can also use a QR Code:  

The GUIDs for individual cells are displayed in the table below:

Partial Autocorrelation Function
Time lag kPACF(k)T-STATP-value
1-0.003321-0.03450.486266
20.0995841.03490.151512
3-0.005064-0.05260.479064
4-0.058386-0.60680.27264
50.0718160.74630.228543
60.1072211.11430.133818
70.2113572.19650.015097
80.0825750.85810.196358
90.1492371.55090.061923
100.068180.70850.240067
110.0550050.57160.28438
12-0.305226-3.1720.000986
13-0.043133-0.44830.327434
140.0647090.67250.251358
150.0870510.90470.18383
16-0.13716-1.42540.078462
17-0.041494-0.43120.333584
180.053970.56090.288021
190.0212660.2210.412754
200.1284241.33460.092403
210.0408120.42410.336158
22-0.196601-2.04310.021737
230.1043691.08460.14025
24-0.268451-2.78980.003118
25-0.000668-0.00690.497237
26-0.019073-0.19820.421624
27-0.024573-0.25540.399462
28-0.218528-2.2710.012565
29-0.079302-0.82410.20584
300.0077580.08060.467947
31-0.161583-1.67920.048001
32-0.090312-0.93860.175027
33-0.018473-0.1920.424061
34-0.002204-0.02290.490884
350.1380961.43510.077068
36-0.162439-1.68810.047137
37-0.112067-1.16460.123366
380.0394240.40970.341416
39-0.036644-0.38080.352045
40-0.024509-0.25470.399717
410.0447430.4650.32144
420.0665910.6920.2452
430.1296341.34720.090368
440.0500340.520.302074
45-0.022769-0.23660.406698
46-0.052985-0.55060.291511
47-0.069588-0.72320.235568
48-0.041401-0.43030.333933
49-0.005471-0.05690.477383
50-0.037382-0.38850.349209
51-0.002072-0.02150.491429
52-0.015336-0.15940.436834
530.0046650.04850.48071
540.0257820.26790.39463
550.0104810.10890.456732
56-0.002398-0.02490.490083
570.0349010.36270.358766
58-0.019976-0.20760.417967
59-0.021157-0.21990.413194
60-0.079987-0.83130.203832


Parameters (Session):
par1 = 60 ; par2 = -0.8 ; par3 = 0 ; par4 = 1 ; par5 = 12 ;
Parameters (R input):
par1 = 60 ; par2 = -0.8 ; par3 = 0 ; par4 = 1 ; par5 = 12 ;
R code (references can be found in the software module):
if (par1 == 'Default') {
par1 = 10*log10(length(x))
} else {
par1 <- as.numeric(par1)
}
par2 <- as.numeric(par2)
par3 <- as.numeric(par3)
par4 <- as.numeric(par4)
par5 <- as.numeric(par5)
if (par2 == 0) {
x <- log(x)
} else {
x <- (x ^ par2 - 1) / par2
}
if (par3 > 0) x <- diff(x,lag=1,difference=par3)
if (par4 > 0) x <- diff(x,lag=par5,difference=par4)
bitmap(file='pic1.png')
racf <- acf(x,par1,main='Autocorrelation',xlab='lags',ylab='ACF')
dev.off()
bitmap(file='pic2.png')
rpacf <- pacf(x,par1,main='Partial Autocorrelation',xlab='lags',ylab='PACF')
dev.off()
(myacf <- c(racf$acf))
(mypacf <- c(rpacf$acf))
lengthx <- length(x)
sqrtn <- sqrt(lengthx)
load(file='createtable')
a<-table.start()
a<-table.row.start(a)
a<-table.element(a,'Autocorrelation Function',4,TRUE)
a<-table.row.end(a)
a<-table.row.start(a)
a<-table.element(a,'Time lag k',header=TRUE)
a<-table.element(a,hyperlink('basics.htm','ACF(k)','click here for more information about the Autocorrelation Function'),header=TRUE)
a<-table.element(a,'T-STAT',header=TRUE)
a<-table.element(a,'P-value',header=TRUE)
a<-table.row.end(a)
for (i in 2:(par1+1)) {
a<-table.row.start(a)
a<-table.element(a,i-1,header=TRUE)
a<-table.element(a,round(myacf[i],6))
mytstat <- myacf[i]*sqrtn
a<-table.element(a,round(mytstat,4))
a<-table.element(a,round(1-pt(abs(mytstat),lengthx),6))
a<-table.row.end(a)
}
a<-table.end(a)
table.save(a,file='mytable.tab')
a<-table.start()
a<-table.row.start(a)
a<-table.element(a,'Partial Autocorrelation Function',4,TRUE)
a<-table.row.end(a)
a<-table.row.start(a)
a<-table.element(a,'Time lag k',header=TRUE)
a<-table.element(a,hyperlink('basics.htm','PACF(k)','click here for more information about the Partial Autocorrelation Function'),header=TRUE)
a<-table.element(a,'T-STAT',header=TRUE)
a<-table.element(a,'P-value',header=TRUE)
a<-table.row.end(a)
for (i in 1:par1) {
a<-table.row.start(a)
a<-table.element(a,i,header=TRUE)
a<-table.element(a,round(mypacf[i],6))
mytstat <- mypacf[i]*sqrtn
a<-table.element(a,round(mytstat,4))
a<-table.element(a,round(1-pt(abs(mytstat),lengthx),6))
a<-table.row.end(a)
}
a<-table.end(a)
table.save(a,file='mytable1.tab')