Free Statistics

of Irreproducible Research!

Author's title

Author*The author of this computation has been verified*
R Software Modulerwasp_smp.wasp
Title produced by softwareStandard Deviation-Mean Plot
Date of computationTue, 02 Dec 2008 15:11:02 -0700
Cite this page as followsStatistical Computations at FreeStatistics.org, Office for Research Development and Education, URL https://freestatistics.org/blog/index.php?v=date/2008/Dec/02/t1228255910hn5cduub8p5v4v9.htm/, Retrieved Sat, 25 May 2024 09:12:00 +0000
Statistical Computations at FreeStatistics.org, Office for Research Development and Education, URL https://freestatistics.org/blog/index.php?pk=28508, Retrieved Sat, 25 May 2024 09:12:00 +0000
QR Codes:

Original text written by user:
IsPrivate?No (this computation is public)
User-defined keywordsJonas Scheltjens
Estimated Impact148
Family? (F = Feedback message, R = changed R code, M = changed R Module, P = changed Parameters, D = changed Data)
F       [Standard Deviation-Mean Plot] [Non Stationary Ti...] [2008-12-02 22:11:02] [f4960a11bac8b7f1cb71c83b5826d5bd] [Current]
Feedback Forum
2008-12-09 20:16:09 [Gert-Jan Geudens] [reply
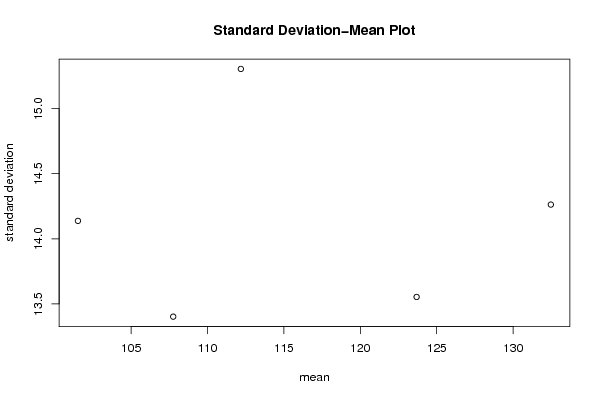
Foutieve conclusie. De transformatie is hier overbodig door de te hoge p-waarde in de eerste tabel (0.97). We kunnen in de standard-deviation mean plot, net zo goed een horizontale regressierechte tekenen. Bovendien zou, als we bovenaan links een punt zouden toevoegen, de regressierechte een zeer vertekend beeld krijgen. Een transformatie is hier dus nutteloos.

Post a new message
Dataseries X:
101,2
100,5
98
106,6
90,1
96,9
125,9
112
100
123,9
79,8
83,4
113,6
112,9
104
109,9
99
106,3
128,9
111,1
102,9
130
87
87,5
117,6
103,4
110,8
112,6
102,5
112,4
135,6
105,1
127,7
137
91
90,5
122,4
123,3
124,3
120
118,1
119
142,7
123,6
129,6
151,6
110,4
99,2
130,5
136,2
129,7
128
121,6
135,8
143,8
147,5
136,2
156,6
123,3
100,4


Summary of computational transaction
Raw Inputview raw input (R code)
Raw Outputview raw output of R engine
Computing time1 seconds
R Server'George Udny Yule' @ 72.249.76.132

\begin{tabular}{lllllllll}
\hline
Summary of computational transaction \tabularnewline
Raw Input & view raw input (R code)  \tabularnewline
Raw Output & view raw output of R engine  \tabularnewline
Computing time & 1 seconds \tabularnewline
R Server & 'George Udny Yule' @ 72.249.76.132 \tabularnewline
\hline
\end{tabular}
%Source: https://freestatistics.org/blog/index.php?pk=28508&T=0

[TABLE]
[ROW][C]Summary of computational transaction[/C][/ROW]
[ROW][C]Raw Input[/C][C]view raw input (R code) [/C][/ROW]
[ROW][C]Raw Output[/C][C]view raw output of R engine [/C][/ROW]
[ROW][C]Computing time[/C][C]1 seconds[/C][/ROW]
[ROW][C]R Server[/C][C]'George Udny Yule' @ 72.249.76.132[/C][/ROW]
[/TABLE]
Source: https://freestatistics.org/blog/index.php?pk=28508&T=0

Globally Unique Identifier (entire table): ba.freestatistics.org/blog/index.php?pk=28508&T=0

As an alternative you can also use a QR Code:  

The GUIDs for individual cells are displayed in the table below:

Summary of computational transaction
Raw Inputview raw input (R code)
Raw Outputview raw output of R engine
Computing time1 seconds
R Server'George Udny Yule' @ 72.249.76.132


Standard Deviation-Mean Plot
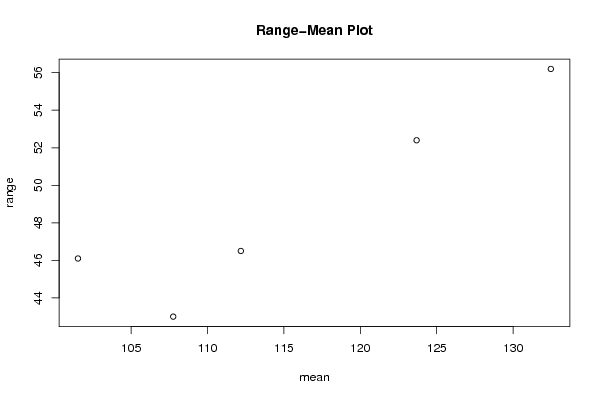
SectionMeanStandard DeviationRange
1101.52514.137578872057146.1
2107.75833333333313.402337539218743
3112.18333333333315.304297277285146.5
4123.68333333333313.553653203159552.4
5132.46666666666714.262814546500956.2

\begin{tabular}{lllllllll}
\hline
Standard Deviation-Mean Plot \tabularnewline
Section & Mean & Standard Deviation & Range \tabularnewline
1 & 101.525 & 14.1375788720571 & 46.1 \tabularnewline
2 & 107.758333333333 & 13.4023375392187 & 43 \tabularnewline
3 & 112.183333333333 & 15.3042972772851 & 46.5 \tabularnewline
4 & 123.683333333333 & 13.5536532031595 & 52.4 \tabularnewline
5 & 132.466666666667 & 14.2628145465009 & 56.2 \tabularnewline
\hline
\end{tabular}
%Source: https://freestatistics.org/blog/index.php?pk=28508&T=1

[TABLE]
[ROW][C]Standard Deviation-Mean Plot[/C][/ROW]
[ROW][C]Section[/C][C]Mean[/C][C]Standard Deviation[/C][C]Range[/C][/ROW]
[ROW][C]1[/C][C]101.525[/C][C]14.1375788720571[/C][C]46.1[/C][/ROW]
[ROW][C]2[/C][C]107.758333333333[/C][C]13.4023375392187[/C][C]43[/C][/ROW]
[ROW][C]3[/C][C]112.183333333333[/C][C]15.3042972772851[/C][C]46.5[/C][/ROW]
[ROW][C]4[/C][C]123.683333333333[/C][C]13.5536532031595[/C][C]52.4[/C][/ROW]
[ROW][C]5[/C][C]132.466666666667[/C][C]14.2628145465009[/C][C]56.2[/C][/ROW]
[/TABLE]
Source: https://freestatistics.org/blog/index.php?pk=28508&T=1

Globally Unique Identifier (entire table): ba.freestatistics.org/blog/index.php?pk=28508&T=1

As an alternative you can also use a QR Code:  

The GUIDs for individual cells are displayed in the table below:

Standard Deviation-Mean Plot
SectionMeanStandard DeviationRange
1101.52514.137578872057146.1
2107.75833333333313.402337539218743
3112.18333333333315.304297277285146.5
4123.68333333333313.553653203159552.4
5132.46666666666714.262814546500956.2


Regression: S.E.(k) = alpha + beta * Mean(k)
alpha14.2866372174161
beta-0.00133740020577492
S.D.0.0348061487136123
T-STAT-0.0384242513234989
p-value0.971763396477687

\begin{tabular}{lllllllll}
\hline
Regression: S.E.(k) = alpha + beta * Mean(k) \tabularnewline
alpha & 14.2866372174161 \tabularnewline
beta & -0.00133740020577492 \tabularnewline
S.D. & 0.0348061487136123 \tabularnewline
T-STAT & -0.0384242513234989 \tabularnewline
p-value & 0.971763396477687 \tabularnewline
\hline
\end{tabular}
%Source: https://freestatistics.org/blog/index.php?pk=28508&T=2

[TABLE]
[ROW][C]Regression: S.E.(k) = alpha + beta * Mean(k)[/C][/ROW]
[ROW][C]alpha[/C][C]14.2866372174161[/C][/ROW]
[ROW][C]beta[/C][C]-0.00133740020577492[/C][/ROW]
[ROW][C]S.D.[/C][C]0.0348061487136123[/C][/ROW]
[ROW][C]T-STAT[/C][C]-0.0384242513234989[/C][/ROW]
[ROW][C]p-value[/C][C]0.971763396477687[/C][/ROW]
[/TABLE]
Source: https://freestatistics.org/blog/index.php?pk=28508&T=2

Globally Unique Identifier (entire table): ba.freestatistics.org/blog/index.php?pk=28508&T=2

As an alternative you can also use a QR Code:  

The GUIDs for individual cells are displayed in the table below:

Regression: S.E.(k) = alpha + beta * Mean(k)
alpha14.2866372174161
beta-0.00133740020577492
S.D.0.0348061487136123
T-STAT-0.0384242513234989
p-value0.971763396477687


Regression: ln S.E.(k) = alpha + beta * ln Mean(k)
alpha2.68022434779773
beta-0.00693002705007568
S.D.0.283143213790620
T-STAT-0.0244753422033286
p-value0.98201044349165
Lambda1.00693002705008

\begin{tabular}{lllllllll}
\hline
Regression: ln S.E.(k) = alpha + beta * ln Mean(k) \tabularnewline
alpha & 2.68022434779773 \tabularnewline
beta & -0.00693002705007568 \tabularnewline
S.D. & 0.283143213790620 \tabularnewline
T-STAT & -0.0244753422033286 \tabularnewline
p-value & 0.98201044349165 \tabularnewline
Lambda & 1.00693002705008 \tabularnewline
\hline
\end{tabular}
%Source: https://freestatistics.org/blog/index.php?pk=28508&T=3

[TABLE]
[ROW][C]Regression: ln S.E.(k) = alpha + beta * ln Mean(k)[/C][/ROW]
[ROW][C]alpha[/C][C]2.68022434779773[/C][/ROW]
[ROW][C]beta[/C][C]-0.00693002705007568[/C][/ROW]
[ROW][C]S.D.[/C][C]0.283143213790620[/C][/ROW]
[ROW][C]T-STAT[/C][C]-0.0244753422033286[/C][/ROW]
[ROW][C]p-value[/C][C]0.98201044349165[/C][/ROW]
[ROW][C]Lambda[/C][C]1.00693002705008[/C][/ROW]
[/TABLE]
Source: https://freestatistics.org/blog/index.php?pk=28508&T=3

Globally Unique Identifier (entire table): ba.freestatistics.org/blog/index.php?pk=28508&T=3

As an alternative you can also use a QR Code:  

The GUIDs for individual cells are displayed in the table below:

Regression: ln S.E.(k) = alpha + beta * ln Mean(k)
alpha2.68022434779773
beta-0.00693002705007568
S.D.0.283143213790620
T-STAT-0.0244753422033286
p-value0.98201044349165
Lambda1.00693002705008


Parameters (Session):
par1 = 12 ;
Parameters (R input):
par1 = 12 ;
R code (references can be found in the software module):
par1 <- as.numeric(par1)
(n <- length(x))
(np <- floor(n / par1))
arr <- array(NA,dim=c(par1,np))
j <- 0
k <- 1
for (i in 1:(np*par1))
{
j = j + 1
arr[j,k] <- x[i]
if (j == par1) {
j = 0
k=k+1
}
}
arr
arr.mean <- array(NA,dim=np)
arr.sd <- array(NA,dim=np)
arr.range <- array(NA,dim=np)
for (j in 1:np)
{
arr.mean[j] <- mean(arr[,j],na.rm=TRUE)
arr.sd[j] <- sd(arr[,j],na.rm=TRUE)
arr.range[j] <- max(arr[,j],na.rm=TRUE) - min(arr[,j],na.rm=TRUE)
}
arr.mean
arr.sd
arr.range
(lm1 <- lm(arr.sd~arr.mean))
(lnlm1 <- lm(log(arr.sd)~log(arr.mean)))
(lm2 <- lm(arr.range~arr.mean))
bitmap(file='test1.png')
plot(arr.mean,arr.sd,main='Standard Deviation-Mean Plot',xlab='mean',ylab='standard deviation')
dev.off()
bitmap(file='test2.png')
plot(arr.mean,arr.range,main='Range-Mean Plot',xlab='mean',ylab='range')
dev.off()
load(file='createtable')
a<-table.start()
a<-table.row.start(a)
a<-table.element(a,'Standard Deviation-Mean Plot',4,TRUE)
a<-table.row.end(a)
a<-table.row.start(a)
a<-table.element(a,'Section',header=TRUE)
a<-table.element(a,'Mean',header=TRUE)
a<-table.element(a,'Standard Deviation',header=TRUE)
a<-table.element(a,'Range',header=TRUE)
a<-table.row.end(a)
for (j in 1:np) {
a<-table.row.start(a)
a<-table.element(a,j,header=TRUE)
a<-table.element(a,arr.mean[j])
a<-table.element(a,arr.sd[j] )
a<-table.element(a,arr.range[j] )
a<-table.row.end(a)
}
a<-table.end(a)
table.save(a,file='mytable.tab')
a<-table.start()
a<-table.row.start(a)
a<-table.element(a,'Regression: S.E.(k) = alpha + beta * Mean(k)',2,TRUE)
a<-table.row.end(a)
a<-table.row.start(a)
a<-table.element(a,'alpha',header=TRUE)
a<-table.element(a,lm1$coefficients[[1]])
a<-table.row.end(a)
a<-table.row.start(a)
a<-table.element(a,'beta',header=TRUE)
a<-table.element(a,lm1$coefficients[[2]])
a<-table.row.end(a)
a<-table.row.start(a)
a<-table.element(a,'S.D.',header=TRUE)
a<-table.element(a,summary(lm1)$coefficients[2,2])
a<-table.row.end(a)
a<-table.row.start(a)
a<-table.element(a,'T-STAT',header=TRUE)
a<-table.element(a,summary(lm1)$coefficients[2,3])
a<-table.row.end(a)
a<-table.row.start(a)
a<-table.element(a,'p-value',header=TRUE)
a<-table.element(a,summary(lm1)$coefficients[2,4])
a<-table.row.end(a)
a<-table.end(a)
table.save(a,file='mytable1.tab')
a<-table.start()
a<-table.row.start(a)
a<-table.element(a,'Regression: ln S.E.(k) = alpha + beta * ln Mean(k)',2,TRUE)
a<-table.row.end(a)
a<-table.row.start(a)
a<-table.element(a,'alpha',header=TRUE)
a<-table.element(a,lnlm1$coefficients[[1]])
a<-table.row.end(a)
a<-table.row.start(a)
a<-table.element(a,'beta',header=TRUE)
a<-table.element(a,lnlm1$coefficients[[2]])
a<-table.row.end(a)
a<-table.row.start(a)
a<-table.element(a,'S.D.',header=TRUE)
a<-table.element(a,summary(lnlm1)$coefficients[2,2])
a<-table.row.end(a)
a<-table.row.start(a)
a<-table.element(a,'T-STAT',header=TRUE)
a<-table.element(a,summary(lnlm1)$coefficients[2,3])
a<-table.row.end(a)
a<-table.row.start(a)
a<-table.element(a,'p-value',header=TRUE)
a<-table.element(a,summary(lnlm1)$coefficients[2,4])
a<-table.row.end(a)
a<-table.row.start(a)
a<-table.element(a,'Lambda',header=TRUE)
a<-table.element(a,1-lnlm1$coefficients[[2]])
a<-table.row.end(a)
a<-table.end(a)
table.save(a,file='mytable2.tab')