Free Statistics

of Irreproducible Research!

Author's title

Author*The author of this computation has been verified*
R Software Modulerwasp_autocorrelation.wasp
Title produced by software(Partial) Autocorrelation Function
Date of computationTue, 02 Dec 2008 13:32:36 -0700
Cite this page as followsStatistical Computations at FreeStatistics.org, Office for Research Development and Education, URL https://freestatistics.org/blog/index.php?v=date/2008/Dec/02/t1228250042ilvq1br8xlrsv8d.htm/, Retrieved Sat, 25 May 2024 09:14:22 +0000
Statistical Computations at FreeStatistics.org, Office for Research Development and Education, URL https://freestatistics.org/blog/index.php?pk=28392, Retrieved Sat, 25 May 2024 09:14:22 +0000
QR Codes:

Original text written by user:
IsPrivate?No (this computation is public)
User-defined keywords
Estimated Impact129
Family? (F = Feedback message, R = changed R code, M = changed R Module, P = changed Parameters, D = changed Data)
F       [(Partial) Autocorrelation Function] [non s ts Q8 ACF i...] [2008-12-02 20:32:36] [c5d6d05aee6be5527ac4a30a8c3b8fe5] [Current]
Feedback Forum
2008-12-08 16:59:25 [Jonas Janssens] [reply
Correct. Goede uitleg.
2008-12-08 19:46:51 [5faab2fc6fb120339944528a32d48a04] [reply
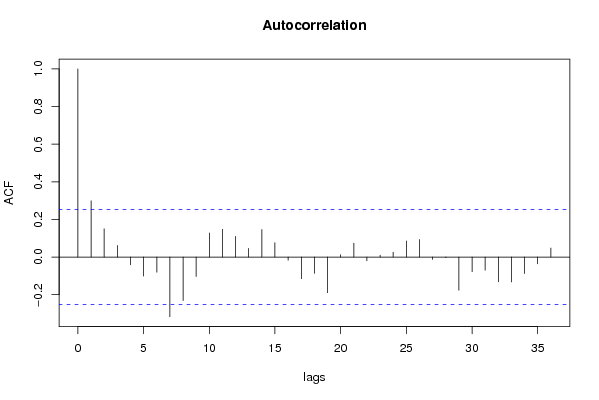
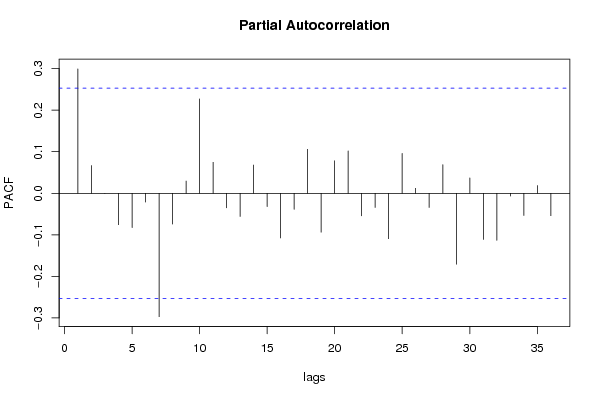
Door differentiatie van d=1 en D=0 is de seizonaliteit en de lange termijntrend uit de reeks verwijderd. Ze is nu stationair.
2008-12-09 22:55:37 [Gert-Jan Geudens] [reply
Correct. De studente heeft de correcte parameters gekozen om een stationaire reeks te bekomen.

Post a new message
Dataseries X:
109,1
111,4
114,1
121,8
127,6
129,9
128
123,5
124
127,4
127,6
128,4
131,4
135,1
134
144,5
147,3
150,9
148,7
141,4
138,9
139,8
145,6
147,9
148,5
151,1
157,5
167,5
172,3
173,5
187,5
205,5
195,1
204,5
204,5
201,7
207
206,6
210,6
211,1
215
223,9
238,2
238,9
229,6
232,2
222,1
221,6
227,3
221
213,6
243,4
253,8
265,3
268,2
268,5
266,9
268,4
250,8
231,2
192


Summary of computational transaction
Raw Inputview raw input (R code)
Raw Outputview raw output of R engine
Computing time1 seconds
R Server'Gwilym Jenkins' @ 72.249.127.135

\begin{tabular}{lllllllll}
\hline
Summary of computational transaction \tabularnewline
Raw Input & view raw input (R code)  \tabularnewline
Raw Output & view raw output of R engine  \tabularnewline
Computing time & 1 seconds \tabularnewline
R Server & 'Gwilym Jenkins' @ 72.249.127.135 \tabularnewline
\hline
\end{tabular}
%Source: https://freestatistics.org/blog/index.php?pk=28392&T=0

[TABLE]
[ROW][C]Summary of computational transaction[/C][/ROW]
[ROW][C]Raw Input[/C][C]view raw input (R code) [/C][/ROW]
[ROW][C]Raw Output[/C][C]view raw output of R engine [/C][/ROW]
[ROW][C]Computing time[/C][C]1 seconds[/C][/ROW]
[ROW][C]R Server[/C][C]'Gwilym Jenkins' @ 72.249.127.135[/C][/ROW]
[/TABLE]
Source: https://freestatistics.org/blog/index.php?pk=28392&T=0

Globally Unique Identifier (entire table): ba.freestatistics.org/blog/index.php?pk=28392&T=0

As an alternative you can also use a QR Code:  

The GUIDs for individual cells are displayed in the table below:

Summary of computational transaction
Raw Inputview raw input (R code)
Raw Outputview raw output of R engine
Computing time1 seconds
R Server'Gwilym Jenkins' @ 72.249.127.135


Autocorrelation Function
Time lag kACF(k)T-STATP-value
10.2991692.31740.011957
20.1501181.16280.124755
30.0617070.4780.3172
4-0.04137-0.32050.37487
5-0.100834-0.78110.218921
6-0.080431-0.6230.267818
7-0.316801-2.45390.008525
8-0.231014-1.78940.039297
9-0.102955-0.79750.214156
100.1282590.99350.16223
110.1477211.14420.128534
120.1096790.84960.199471
130.0460770.35690.361204
140.1459361.13040.131399
150.0767250.59430.27727
16-0.016545-0.12820.449227
17-0.115267-0.89290.187752
18-0.086263-0.66820.253287
19-0.18969-1.46930.073484
200.0128390.09950.460555
210.0737840.57150.284889
22-0.019987-0.15480.438743
230.0096870.0750.470217
240.0256190.19840.421685
250.0855230.66250.255107
260.0927080.71810.237738
27-0.012631-0.09780.461194
28-0.003437-0.02660.489426
29-0.176451-1.36680.088397
30-0.077616-0.60120.274982
31-0.069932-0.54170.295018
32-0.131297-1.0170.156613
33-0.131959-1.02220.155407
34-0.08773-0.67960.249701
35-0.035895-0.2780.390968
360.0481750.37320.355172

\begin{tabular}{lllllllll}
\hline
Autocorrelation Function \tabularnewline
Time lag k & ACF(k) & T-STAT & P-value \tabularnewline
1 & 0.299169 & 2.3174 & 0.011957 \tabularnewline
2 & 0.150118 & 1.1628 & 0.124755 \tabularnewline
3 & 0.061707 & 0.478 & 0.3172 \tabularnewline
4 & -0.04137 & -0.3205 & 0.37487 \tabularnewline
5 & -0.100834 & -0.7811 & 0.218921 \tabularnewline
6 & -0.080431 & -0.623 & 0.267818 \tabularnewline
7 & -0.316801 & -2.4539 & 0.008525 \tabularnewline
8 & -0.231014 & -1.7894 & 0.039297 \tabularnewline
9 & -0.102955 & -0.7975 & 0.214156 \tabularnewline
10 & 0.128259 & 0.9935 & 0.16223 \tabularnewline
11 & 0.147721 & 1.1442 & 0.128534 \tabularnewline
12 & 0.109679 & 0.8496 & 0.199471 \tabularnewline
13 & 0.046077 & 0.3569 & 0.361204 \tabularnewline
14 & 0.145936 & 1.1304 & 0.131399 \tabularnewline
15 & 0.076725 & 0.5943 & 0.27727 \tabularnewline
16 & -0.016545 & -0.1282 & 0.449227 \tabularnewline
17 & -0.115267 & -0.8929 & 0.187752 \tabularnewline
18 & -0.086263 & -0.6682 & 0.253287 \tabularnewline
19 & -0.18969 & -1.4693 & 0.073484 \tabularnewline
20 & 0.012839 & 0.0995 & 0.460555 \tabularnewline
21 & 0.073784 & 0.5715 & 0.284889 \tabularnewline
22 & -0.019987 & -0.1548 & 0.438743 \tabularnewline
23 & 0.009687 & 0.075 & 0.470217 \tabularnewline
24 & 0.025619 & 0.1984 & 0.421685 \tabularnewline
25 & 0.085523 & 0.6625 & 0.255107 \tabularnewline
26 & 0.092708 & 0.7181 & 0.237738 \tabularnewline
27 & -0.012631 & -0.0978 & 0.461194 \tabularnewline
28 & -0.003437 & -0.0266 & 0.489426 \tabularnewline
29 & -0.176451 & -1.3668 & 0.088397 \tabularnewline
30 & -0.077616 & -0.6012 & 0.274982 \tabularnewline
31 & -0.069932 & -0.5417 & 0.295018 \tabularnewline
32 & -0.131297 & -1.017 & 0.156613 \tabularnewline
33 & -0.131959 & -1.0222 & 0.155407 \tabularnewline
34 & -0.08773 & -0.6796 & 0.249701 \tabularnewline
35 & -0.035895 & -0.278 & 0.390968 \tabularnewline
36 & 0.048175 & 0.3732 & 0.355172 \tabularnewline
\hline
\end{tabular}
%Source: https://freestatistics.org/blog/index.php?pk=28392&T=1

[TABLE]
[ROW][C]Autocorrelation Function[/C][/ROW]
[ROW][C]Time lag k[/C][C]ACF(k)[/C][C]T-STAT[/C][C]P-value[/C][/ROW]
[ROW][C]1[/C][C]0.299169[/C][C]2.3174[/C][C]0.011957[/C][/ROW]
[ROW][C]2[/C][C]0.150118[/C][C]1.1628[/C][C]0.124755[/C][/ROW]
[ROW][C]3[/C][C]0.061707[/C][C]0.478[/C][C]0.3172[/C][/ROW]
[ROW][C]4[/C][C]-0.04137[/C][C]-0.3205[/C][C]0.37487[/C][/ROW]
[ROW][C]5[/C][C]-0.100834[/C][C]-0.7811[/C][C]0.218921[/C][/ROW]
[ROW][C]6[/C][C]-0.080431[/C][C]-0.623[/C][C]0.267818[/C][/ROW]
[ROW][C]7[/C][C]-0.316801[/C][C]-2.4539[/C][C]0.008525[/C][/ROW]
[ROW][C]8[/C][C]-0.231014[/C][C]-1.7894[/C][C]0.039297[/C][/ROW]
[ROW][C]9[/C][C]-0.102955[/C][C]-0.7975[/C][C]0.214156[/C][/ROW]
[ROW][C]10[/C][C]0.128259[/C][C]0.9935[/C][C]0.16223[/C][/ROW]
[ROW][C]11[/C][C]0.147721[/C][C]1.1442[/C][C]0.128534[/C][/ROW]
[ROW][C]12[/C][C]0.109679[/C][C]0.8496[/C][C]0.199471[/C][/ROW]
[ROW][C]13[/C][C]0.046077[/C][C]0.3569[/C][C]0.361204[/C][/ROW]
[ROW][C]14[/C][C]0.145936[/C][C]1.1304[/C][C]0.131399[/C][/ROW]
[ROW][C]15[/C][C]0.076725[/C][C]0.5943[/C][C]0.27727[/C][/ROW]
[ROW][C]16[/C][C]-0.016545[/C][C]-0.1282[/C][C]0.449227[/C][/ROW]
[ROW][C]17[/C][C]-0.115267[/C][C]-0.8929[/C][C]0.187752[/C][/ROW]
[ROW][C]18[/C][C]-0.086263[/C][C]-0.6682[/C][C]0.253287[/C][/ROW]
[ROW][C]19[/C][C]-0.18969[/C][C]-1.4693[/C][C]0.073484[/C][/ROW]
[ROW][C]20[/C][C]0.012839[/C][C]0.0995[/C][C]0.460555[/C][/ROW]
[ROW][C]21[/C][C]0.073784[/C][C]0.5715[/C][C]0.284889[/C][/ROW]
[ROW][C]22[/C][C]-0.019987[/C][C]-0.1548[/C][C]0.438743[/C][/ROW]
[ROW][C]23[/C][C]0.009687[/C][C]0.075[/C][C]0.470217[/C][/ROW]
[ROW][C]24[/C][C]0.025619[/C][C]0.1984[/C][C]0.421685[/C][/ROW]
[ROW][C]25[/C][C]0.085523[/C][C]0.6625[/C][C]0.255107[/C][/ROW]
[ROW][C]26[/C][C]0.092708[/C][C]0.7181[/C][C]0.237738[/C][/ROW]
[ROW][C]27[/C][C]-0.012631[/C][C]-0.0978[/C][C]0.461194[/C][/ROW]
[ROW][C]28[/C][C]-0.003437[/C][C]-0.0266[/C][C]0.489426[/C][/ROW]
[ROW][C]29[/C][C]-0.176451[/C][C]-1.3668[/C][C]0.088397[/C][/ROW]
[ROW][C]30[/C][C]-0.077616[/C][C]-0.6012[/C][C]0.274982[/C][/ROW]
[ROW][C]31[/C][C]-0.069932[/C][C]-0.5417[/C][C]0.295018[/C][/ROW]
[ROW][C]32[/C][C]-0.131297[/C][C]-1.017[/C][C]0.156613[/C][/ROW]
[ROW][C]33[/C][C]-0.131959[/C][C]-1.0222[/C][C]0.155407[/C][/ROW]
[ROW][C]34[/C][C]-0.08773[/C][C]-0.6796[/C][C]0.249701[/C][/ROW]
[ROW][C]35[/C][C]-0.035895[/C][C]-0.278[/C][C]0.390968[/C][/ROW]
[ROW][C]36[/C][C]0.048175[/C][C]0.3732[/C][C]0.355172[/C][/ROW]
[/TABLE]
Source: https://freestatistics.org/blog/index.php?pk=28392&T=1

Globally Unique Identifier (entire table): ba.freestatistics.org/blog/index.php?pk=28392&T=1

As an alternative you can also use a QR Code:  

The GUIDs for individual cells are displayed in the table below:

Autocorrelation Function
Time lag kACF(k)T-STATP-value
10.2991692.31740.011957
20.1501181.16280.124755
30.0617070.4780.3172
4-0.04137-0.32050.37487
5-0.100834-0.78110.218921
6-0.080431-0.6230.267818
7-0.316801-2.45390.008525
8-0.231014-1.78940.039297
9-0.102955-0.79750.214156
100.1282590.99350.16223
110.1477211.14420.128534
120.1096790.84960.199471
130.0460770.35690.361204
140.1459361.13040.131399
150.0767250.59430.27727
16-0.016545-0.12820.449227
17-0.115267-0.89290.187752
18-0.086263-0.66820.253287
19-0.18969-1.46930.073484
200.0128390.09950.460555
210.0737840.57150.284889
22-0.019987-0.15480.438743
230.0096870.0750.470217
240.0256190.19840.421685
250.0855230.66250.255107
260.0927080.71810.237738
27-0.012631-0.09780.461194
28-0.003437-0.02660.489426
29-0.176451-1.36680.088397
30-0.077616-0.60120.274982
31-0.069932-0.54170.295018
32-0.131297-1.0170.156613
33-0.131959-1.02220.155407
34-0.08773-0.67960.249701
35-0.035895-0.2780.390968
360.0481750.37320.355172


Partial Autocorrelation Function
Time lag kPACF(k)T-STATP-value
10.2991692.31740.011957
20.0665750.51570.303985
3-0.000144-0.00110.499557
4-0.075634-0.58590.280084
5-0.082354-0.63790.262978
6-0.021208-0.16430.435034
7-0.296805-2.2990.0125
8-0.073937-0.57270.28449
90.029440.2280.410194
100.2270891.7590.041836
110.0744350.57660.283194
12-0.034938-0.27060.393804
13-0.055713-0.43160.333807
140.0678040.52520.300688
15-0.032003-0.24790.402531
16-0.107444-0.83230.204283
17-0.038678-0.29960.38276
180.1057260.81890.208029
19-0.093523-0.72440.23581
200.0782820.60640.273279
210.1017940.78850.216755
22-0.054095-0.4190.338349
23-0.034103-0.26420.39628
24-0.109254-0.84630.20038
250.0958190.74220.230428
260.0119850.09280.463171
27-0.034061-0.26380.396405
280.0687440.53250.298177
29-0.17068-1.32210.09558
300.0368710.28560.388085
31-0.110902-0.8590.196867
32-0.113071-0.87580.192303
33-0.006809-0.05270.479057
34-0.053245-0.41240.340746
350.0186730.14460.442739
36-0.053828-0.41690.339102

\begin{tabular}{lllllllll}
\hline
Partial Autocorrelation Function \tabularnewline
Time lag k & PACF(k) & T-STAT & P-value \tabularnewline
1 & 0.299169 & 2.3174 & 0.011957 \tabularnewline
2 & 0.066575 & 0.5157 & 0.303985 \tabularnewline
3 & -0.000144 & -0.0011 & 0.499557 \tabularnewline
4 & -0.075634 & -0.5859 & 0.280084 \tabularnewline
5 & -0.082354 & -0.6379 & 0.262978 \tabularnewline
6 & -0.021208 & -0.1643 & 0.435034 \tabularnewline
7 & -0.296805 & -2.299 & 0.0125 \tabularnewline
8 & -0.073937 & -0.5727 & 0.28449 \tabularnewline
9 & 0.02944 & 0.228 & 0.410194 \tabularnewline
10 & 0.227089 & 1.759 & 0.041836 \tabularnewline
11 & 0.074435 & 0.5766 & 0.283194 \tabularnewline
12 & -0.034938 & -0.2706 & 0.393804 \tabularnewline
13 & -0.055713 & -0.4316 & 0.333807 \tabularnewline
14 & 0.067804 & 0.5252 & 0.300688 \tabularnewline
15 & -0.032003 & -0.2479 & 0.402531 \tabularnewline
16 & -0.107444 & -0.8323 & 0.204283 \tabularnewline
17 & -0.038678 & -0.2996 & 0.38276 \tabularnewline
18 & 0.105726 & 0.8189 & 0.208029 \tabularnewline
19 & -0.093523 & -0.7244 & 0.23581 \tabularnewline
20 & 0.078282 & 0.6064 & 0.273279 \tabularnewline
21 & 0.101794 & 0.7885 & 0.216755 \tabularnewline
22 & -0.054095 & -0.419 & 0.338349 \tabularnewline
23 & -0.034103 & -0.2642 & 0.39628 \tabularnewline
24 & -0.109254 & -0.8463 & 0.20038 \tabularnewline
25 & 0.095819 & 0.7422 & 0.230428 \tabularnewline
26 & 0.011985 & 0.0928 & 0.463171 \tabularnewline
27 & -0.034061 & -0.2638 & 0.396405 \tabularnewline
28 & 0.068744 & 0.5325 & 0.298177 \tabularnewline
29 & -0.17068 & -1.3221 & 0.09558 \tabularnewline
30 & 0.036871 & 0.2856 & 0.388085 \tabularnewline
31 & -0.110902 & -0.859 & 0.196867 \tabularnewline
32 & -0.113071 & -0.8758 & 0.192303 \tabularnewline
33 & -0.006809 & -0.0527 & 0.479057 \tabularnewline
34 & -0.053245 & -0.4124 & 0.340746 \tabularnewline
35 & 0.018673 & 0.1446 & 0.442739 \tabularnewline
36 & -0.053828 & -0.4169 & 0.339102 \tabularnewline
\hline
\end{tabular}
%Source: https://freestatistics.org/blog/index.php?pk=28392&T=2

[TABLE]
[ROW][C]Partial Autocorrelation Function[/C][/ROW]
[ROW][C]Time lag k[/C][C]PACF(k)[/C][C]T-STAT[/C][C]P-value[/C][/ROW]
[ROW][C]1[/C][C]0.299169[/C][C]2.3174[/C][C]0.011957[/C][/ROW]
[ROW][C]2[/C][C]0.066575[/C][C]0.5157[/C][C]0.303985[/C][/ROW]
[ROW][C]3[/C][C]-0.000144[/C][C]-0.0011[/C][C]0.499557[/C][/ROW]
[ROW][C]4[/C][C]-0.075634[/C][C]-0.5859[/C][C]0.280084[/C][/ROW]
[ROW][C]5[/C][C]-0.082354[/C][C]-0.6379[/C][C]0.262978[/C][/ROW]
[ROW][C]6[/C][C]-0.021208[/C][C]-0.1643[/C][C]0.435034[/C][/ROW]
[ROW][C]7[/C][C]-0.296805[/C][C]-2.299[/C][C]0.0125[/C][/ROW]
[ROW][C]8[/C][C]-0.073937[/C][C]-0.5727[/C][C]0.28449[/C][/ROW]
[ROW][C]9[/C][C]0.02944[/C][C]0.228[/C][C]0.410194[/C][/ROW]
[ROW][C]10[/C][C]0.227089[/C][C]1.759[/C][C]0.041836[/C][/ROW]
[ROW][C]11[/C][C]0.074435[/C][C]0.5766[/C][C]0.283194[/C][/ROW]
[ROW][C]12[/C][C]-0.034938[/C][C]-0.2706[/C][C]0.393804[/C][/ROW]
[ROW][C]13[/C][C]-0.055713[/C][C]-0.4316[/C][C]0.333807[/C][/ROW]
[ROW][C]14[/C][C]0.067804[/C][C]0.5252[/C][C]0.300688[/C][/ROW]
[ROW][C]15[/C][C]-0.032003[/C][C]-0.2479[/C][C]0.402531[/C][/ROW]
[ROW][C]16[/C][C]-0.107444[/C][C]-0.8323[/C][C]0.204283[/C][/ROW]
[ROW][C]17[/C][C]-0.038678[/C][C]-0.2996[/C][C]0.38276[/C][/ROW]
[ROW][C]18[/C][C]0.105726[/C][C]0.8189[/C][C]0.208029[/C][/ROW]
[ROW][C]19[/C][C]-0.093523[/C][C]-0.7244[/C][C]0.23581[/C][/ROW]
[ROW][C]20[/C][C]0.078282[/C][C]0.6064[/C][C]0.273279[/C][/ROW]
[ROW][C]21[/C][C]0.101794[/C][C]0.7885[/C][C]0.216755[/C][/ROW]
[ROW][C]22[/C][C]-0.054095[/C][C]-0.419[/C][C]0.338349[/C][/ROW]
[ROW][C]23[/C][C]-0.034103[/C][C]-0.2642[/C][C]0.39628[/C][/ROW]
[ROW][C]24[/C][C]-0.109254[/C][C]-0.8463[/C][C]0.20038[/C][/ROW]
[ROW][C]25[/C][C]0.095819[/C][C]0.7422[/C][C]0.230428[/C][/ROW]
[ROW][C]26[/C][C]0.011985[/C][C]0.0928[/C][C]0.463171[/C][/ROW]
[ROW][C]27[/C][C]-0.034061[/C][C]-0.2638[/C][C]0.396405[/C][/ROW]
[ROW][C]28[/C][C]0.068744[/C][C]0.5325[/C][C]0.298177[/C][/ROW]
[ROW][C]29[/C][C]-0.17068[/C][C]-1.3221[/C][C]0.09558[/C][/ROW]
[ROW][C]30[/C][C]0.036871[/C][C]0.2856[/C][C]0.388085[/C][/ROW]
[ROW][C]31[/C][C]-0.110902[/C][C]-0.859[/C][C]0.196867[/C][/ROW]
[ROW][C]32[/C][C]-0.113071[/C][C]-0.8758[/C][C]0.192303[/C][/ROW]
[ROW][C]33[/C][C]-0.006809[/C][C]-0.0527[/C][C]0.479057[/C][/ROW]
[ROW][C]34[/C][C]-0.053245[/C][C]-0.4124[/C][C]0.340746[/C][/ROW]
[ROW][C]35[/C][C]0.018673[/C][C]0.1446[/C][C]0.442739[/C][/ROW]
[ROW][C]36[/C][C]-0.053828[/C][C]-0.4169[/C][C]0.339102[/C][/ROW]
[/TABLE]
Source: https://freestatistics.org/blog/index.php?pk=28392&T=2

Globally Unique Identifier (entire table): ba.freestatistics.org/blog/index.php?pk=28392&T=2

As an alternative you can also use a QR Code:  

The GUIDs for individual cells are displayed in the table below:

Partial Autocorrelation Function
Time lag kPACF(k)T-STATP-value
10.2991692.31740.011957
20.0665750.51570.303985
3-0.000144-0.00110.499557
4-0.075634-0.58590.280084
5-0.082354-0.63790.262978
6-0.021208-0.16430.435034
7-0.296805-2.2990.0125
8-0.073937-0.57270.28449
90.029440.2280.410194
100.2270891.7590.041836
110.0744350.57660.283194
12-0.034938-0.27060.393804
13-0.055713-0.43160.333807
140.0678040.52520.300688
15-0.032003-0.24790.402531
16-0.107444-0.83230.204283
17-0.038678-0.29960.38276
180.1057260.81890.208029
19-0.093523-0.72440.23581
200.0782820.60640.273279
210.1017940.78850.216755
22-0.054095-0.4190.338349
23-0.034103-0.26420.39628
24-0.109254-0.84630.20038
250.0958190.74220.230428
260.0119850.09280.463171
27-0.034061-0.26380.396405
280.0687440.53250.298177
29-0.17068-1.32210.09558
300.0368710.28560.388085
31-0.110902-0.8590.196867
32-0.113071-0.87580.192303
33-0.006809-0.05270.479057
34-0.053245-0.41240.340746
350.0186730.14460.442739
36-0.053828-0.41690.339102


Parameters (Session):
par1 = 36 ; par2 = 1 ; par3 = 1 ; par4 = 0 ; par5 = 12 ;
Parameters (R input):
par1 = 36 ; par2 = 1 ; par3 = 1 ; par4 = 0 ; par5 = 12 ;
R code (references can be found in the software module):
if (par1 == 'Default') {
par1 = 10*log10(length(x))
} else {
par1 <- as.numeric(par1)
}
par2 <- as.numeric(par2)
par3 <- as.numeric(par3)
par4 <- as.numeric(par4)
par5 <- as.numeric(par5)
if (par2 == 0) {
x <- log(x)
} else {
x <- (x ^ par2 - 1) / par2
}
if (par3 > 0) x <- diff(x,lag=1,difference=par3)
if (par4 > 0) x <- diff(x,lag=par5,difference=par4)
bitmap(file='pic1.png')
racf <- acf(x,par1,main='Autocorrelation',xlab='lags',ylab='ACF')
dev.off()
bitmap(file='pic2.png')
rpacf <- pacf(x,par1,main='Partial Autocorrelation',xlab='lags',ylab='PACF')
dev.off()
(myacf <- c(racf$acf))
(mypacf <- c(rpacf$acf))
lengthx <- length(x)
sqrtn <- sqrt(lengthx)
load(file='createtable')
a<-table.start()
a<-table.row.start(a)
a<-table.element(a,'Autocorrelation Function',4,TRUE)
a<-table.row.end(a)
a<-table.row.start(a)
a<-table.element(a,'Time lag k',header=TRUE)
a<-table.element(a,hyperlink('basics.htm','ACF(k)','click here for more information about the Autocorrelation Function'),header=TRUE)
a<-table.element(a,'T-STAT',header=TRUE)
a<-table.element(a,'P-value',header=TRUE)
a<-table.row.end(a)
for (i in 2:(par1+1)) {
a<-table.row.start(a)
a<-table.element(a,i-1,header=TRUE)
a<-table.element(a,round(myacf[i],6))
mytstat <- myacf[i]*sqrtn
a<-table.element(a,round(mytstat,4))
a<-table.element(a,round(1-pt(abs(mytstat),lengthx),6))
a<-table.row.end(a)
}
a<-table.end(a)
table.save(a,file='mytable.tab')
a<-table.start()
a<-table.row.start(a)
a<-table.element(a,'Partial Autocorrelation Function',4,TRUE)
a<-table.row.end(a)
a<-table.row.start(a)
a<-table.element(a,'Time lag k',header=TRUE)
a<-table.element(a,hyperlink('basics.htm','PACF(k)','click here for more information about the Partial Autocorrelation Function'),header=TRUE)
a<-table.element(a,'T-STAT',header=TRUE)
a<-table.element(a,'P-value',header=TRUE)
a<-table.row.end(a)
for (i in 1:par1) {
a<-table.row.start(a)
a<-table.element(a,i,header=TRUE)
a<-table.element(a,round(mypacf[i],6))
mytstat <- mypacf[i]*sqrtn
a<-table.element(a,round(mytstat,4))
a<-table.element(a,round(1-pt(abs(mytstat),lengthx),6))
a<-table.row.end(a)
}
a<-table.end(a)
table.save(a,file='mytable1.tab')