Free Statistics

of Irreproducible Research!

Author's title

Author*The author of this computation has been verified*
R Software Modulerwasp_cross.wasp
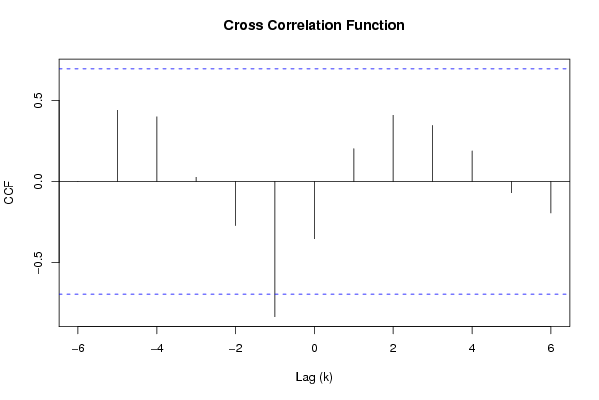
Title produced by softwareCross Correlation Function
Date of computationTue, 02 Dec 2008 12:29:04 -0700
Cite this page as followsStatistical Computations at FreeStatistics.org, Office for Research Development and Education, URL https://freestatistics.org/blog/index.php?v=date/2008/Dec/02/t1228246198ixqoxo3u533x283.htm/, Retrieved Sat, 25 May 2024 06:22:09 +0000
Statistical Computations at FreeStatistics.org, Office for Research Development and Education, URL https://freestatistics.org/blog/index.php?pk=28230, Retrieved Sat, 25 May 2024 06:22:09 +0000
QR Codes:

Original text written by user:
IsPrivate?No (this computation is public)
User-defined keywords
Estimated Impact178
Family? (F = Feedback message, R = changed R code, M = changed R Module, P = changed Parameters, D = changed Data)
F       [Cross Correlation Function] [cross correlation] [2008-12-02 19:29:04] [0bb3b56b7083c5944c3818446f605d68] [Current]
F RMPD    [Variance Reduction Matrix] [VRM Q7] [2008-12-02 19:35:34] [abc1badd8768b83426be5031c0f123a6]
Feedback Forum
2008-12-08 18:15:54 [Natalie De Wilde] [reply
Inderdaad, Cross correlation geeft het verband tussen twee reeksen op dynamische waarden. We voorspellen Y(t) aan de hand van X(t) of het verleden van X(t).
Wanneer k=0 heeft er geen verschuiving in de tijd plaatsgevonden.
Bij k groter dan 0 wordt de toekomstige waarde van X(t) gecorreleerd aan de waarde van Y(t). Bij k kleiner dan 0 wordt de verleden waarde van X(t) gecorreleerd aan de waarde van Y(t).
X(t) is leading indicator voor Y(t), deze geeft op voorhand informatie over andere variabelen.
Je had hier nog wel een interpretatie van de cross correlation van je eigen datareeks mogen geven. Je zegt alleen wat cross correlation is, niet hoe deze is voor je eigen datareeks.

Post a new message
Dataseries X:
0.038
0.010
0.007
0.009
0.012
0.014
0.022
0.024
Dataseries Y:
7.438 
6.562 
8.117 
8.642 
9.151 
8.925 
7.746 
7.270


Summary of computational transaction
Raw Inputview raw input (R code)
Raw Outputview raw output of R engine
Computing time2 seconds
R Server'Herman Ole Andreas Wold' @ 193.190.124.10:1001

\begin{tabular}{lllllllll}
\hline
Summary of computational transaction \tabularnewline
Raw Input & view raw input (R code)  \tabularnewline
Raw Output & view raw output of R engine  \tabularnewline
Computing time & 2 seconds \tabularnewline
R Server & 'Herman Ole Andreas Wold' @ 193.190.124.10:1001 \tabularnewline
\hline
\end{tabular}
%Source: https://freestatistics.org/blog/index.php?pk=28230&T=0

[TABLE]
[ROW][C]Summary of computational transaction[/C][/ROW]
[ROW][C]Raw Input[/C][C]view raw input (R code) [/C][/ROW]
[ROW][C]Raw Output[/C][C]view raw output of R engine [/C][/ROW]
[ROW][C]Computing time[/C][C]2 seconds[/C][/ROW]
[ROW][C]R Server[/C][C]'Herman Ole Andreas Wold' @ 193.190.124.10:1001[/C][/ROW]
[/TABLE]
Source: https://freestatistics.org/blog/index.php?pk=28230&T=0

Globally Unique Identifier (entire table): ba.freestatistics.org/blog/index.php?pk=28230&T=0

As an alternative you can also use a QR Code:  

The GUIDs for individual cells are displayed in the table below:

Summary of computational transaction
Raw Inputview raw input (R code)
Raw Outputview raw output of R engine
Computing time2 seconds
R Server'Herman Ole Andreas Wold' @ 193.190.124.10:1001


Cross Correlation Function
ParameterValue
Box-Cox transformation parameter (lambda) of X series1
Degree of non-seasonal differencing (d) of X series0
Degree of seasonal differencing (D) of X series0
Seasonal Period (s)12
Box-Cox transformation parameter (lambda) of Y series1
Degree of non-seasonal differencing (d) of Y series0
Degree of seasonal differencing (D) of Y series0
krho(Y[t],X[t+k])
-60.000563356767199257
-50.438076952779063
-40.398588326049682
-30.0258971656758331
-2-0.271491973482410
-1-0.83221016153712
0-0.351841211449044
10.201902083297487
20.407490895915012
30.345333865934051
40.188207148552006
5-0.0692488102374356
6-0.193955686992812

\begin{tabular}{lllllllll}
\hline
Cross Correlation Function \tabularnewline
Parameter & Value \tabularnewline
Box-Cox transformation parameter (lambda) of X series & 1 \tabularnewline
Degree of non-seasonal differencing (d) of X series & 0 \tabularnewline
Degree of seasonal differencing (D) of X series & 0 \tabularnewline
Seasonal Period (s) & 12 \tabularnewline
Box-Cox transformation parameter (lambda) of Y series & 1 \tabularnewline
Degree of non-seasonal differencing (d) of Y series & 0 \tabularnewline
Degree of seasonal differencing (D) of Y series & 0 \tabularnewline
k & rho(Y[t],X[t+k]) \tabularnewline
-6 & 0.000563356767199257 \tabularnewline
-5 & 0.438076952779063 \tabularnewline
-4 & 0.398588326049682 \tabularnewline
-3 & 0.0258971656758331 \tabularnewline
-2 & -0.271491973482410 \tabularnewline
-1 & -0.83221016153712 \tabularnewline
0 & -0.351841211449044 \tabularnewline
1 & 0.201902083297487 \tabularnewline
2 & 0.407490895915012 \tabularnewline
3 & 0.345333865934051 \tabularnewline
4 & 0.188207148552006 \tabularnewline
5 & -0.0692488102374356 \tabularnewline
6 & -0.193955686992812 \tabularnewline
\hline
\end{tabular}
%Source: https://freestatistics.org/blog/index.php?pk=28230&T=1

[TABLE]
[ROW][C]Cross Correlation Function[/C][/ROW]
[ROW][C]Parameter[/C][C]Value[/C][/ROW]
[ROW][C]Box-Cox transformation parameter (lambda) of X series[/C][C]1[/C][/ROW]
[ROW][C]Degree of non-seasonal differencing (d) of X series[/C][C]0[/C][/ROW]
[ROW][C]Degree of seasonal differencing (D) of X series[/C][C]0[/C][/ROW]
[ROW][C]Seasonal Period (s)[/C][C]12[/C][/ROW]
[ROW][C]Box-Cox transformation parameter (lambda) of Y series[/C][C]1[/C][/ROW]
[ROW][C]Degree of non-seasonal differencing (d) of Y series[/C][C]0[/C][/ROW]
[ROW][C]Degree of seasonal differencing (D) of Y series[/C][C]0[/C][/ROW]
[ROW][C]k[/C][C]rho(Y[t],X[t+k])[/C][/ROW]
[ROW][C]-6[/C][C]0.000563356767199257[/C][/ROW]
[ROW][C]-5[/C][C]0.438076952779063[/C][/ROW]
[ROW][C]-4[/C][C]0.398588326049682[/C][/ROW]
[ROW][C]-3[/C][C]0.0258971656758331[/C][/ROW]
[ROW][C]-2[/C][C]-0.271491973482410[/C][/ROW]
[ROW][C]-1[/C][C]-0.83221016153712[/C][/ROW]
[ROW][C]0[/C][C]-0.351841211449044[/C][/ROW]
[ROW][C]1[/C][C]0.201902083297487[/C][/ROW]
[ROW][C]2[/C][C]0.407490895915012[/C][/ROW]
[ROW][C]3[/C][C]0.345333865934051[/C][/ROW]
[ROW][C]4[/C][C]0.188207148552006[/C][/ROW]
[ROW][C]5[/C][C]-0.0692488102374356[/C][/ROW]
[ROW][C]6[/C][C]-0.193955686992812[/C][/ROW]
[/TABLE]
Source: https://freestatistics.org/blog/index.php?pk=28230&T=1

Globally Unique Identifier (entire table): ba.freestatistics.org/blog/index.php?pk=28230&T=1

As an alternative you can also use a QR Code:  

The GUIDs for individual cells are displayed in the table below:

Cross Correlation Function
ParameterValue
Box-Cox transformation parameter (lambda) of X series1
Degree of non-seasonal differencing (d) of X series0
Degree of seasonal differencing (D) of X series0
Seasonal Period (s)12
Box-Cox transformation parameter (lambda) of Y series1
Degree of non-seasonal differencing (d) of Y series0
Degree of seasonal differencing (D) of Y series0
krho(Y[t],X[t+k])
-60.000563356767199257
-50.438076952779063
-40.398588326049682
-30.0258971656758331
-2-0.271491973482410
-1-0.83221016153712
0-0.351841211449044
10.201902083297487
20.407490895915012
30.345333865934051
40.188207148552006
5-0.0692488102374356
6-0.193955686992812


Parameters (Session):
par1 = 1 ; par2 = 0 ; par3 = 0 ; par4 = 12 ; par5 = 1 ; par6 = 0 ; par7 = 0 ;
Parameters (R input):
par1 = 1 ; par2 = 0 ; par3 = 0 ; par4 = 12 ; par5 = 1 ; par6 = 0 ; par7 = 0 ;
R code (references can be found in the software module):
par1 <- as.numeric(par1)
par2 <- as.numeric(par2)
par3 <- as.numeric(par3)
par4 <- as.numeric(par4)
par5 <- as.numeric(par5)
par6 <- as.numeric(par6)
par7 <- as.numeric(par7)
if (par1 == 0) {
x <- log(x)
} else {
x <- (x ^ par1 - 1) / par1
}
if (par5 == 0) {
y <- log(y)
} else {
y <- (y ^ par5 - 1) / par5
}
if (par2 > 0) x <- diff(x,lag=1,difference=par2)
if (par6 > 0) y <- diff(y,lag=1,difference=par6)
if (par3 > 0) x <- diff(x,lag=par4,difference=par3)
if (par7 > 0) y <- diff(y,lag=par4,difference=par7)
x
y
bitmap(file='test1.png')
(r <- ccf(x,y,main='Cross Correlation Function',ylab='CCF',xlab='Lag (k)'))
dev.off()
load(file='createtable')
a<-table.start()
a<-table.row.start(a)
a<-table.element(a,'Cross Correlation Function',2,TRUE)
a<-table.row.end(a)
a<-table.row.start(a)
a<-table.element(a,'Parameter',header=TRUE)
a<-table.element(a,'Value',header=TRUE)
a<-table.row.end(a)
a<-table.row.start(a)
a<-table.element(a,'Box-Cox transformation parameter (lambda) of X series',header=TRUE)
a<-table.element(a,par1)
a<-table.row.end(a)
a<-table.row.start(a)
a<-table.element(a,'Degree of non-seasonal differencing (d) of X series',header=TRUE)
a<-table.element(a,par2)
a<-table.row.end(a)
a<-table.row.start(a)
a<-table.element(a,'Degree of seasonal differencing (D) of X series',header=TRUE)
a<-table.element(a,par3)
a<-table.row.end(a)
a<-table.row.start(a)
a<-table.element(a,'Seasonal Period (s)',header=TRUE)
a<-table.element(a,par4)
a<-table.row.end(a)
a<-table.row.start(a)
a<-table.element(a,'Box-Cox transformation parameter (lambda) of Y series',header=TRUE)
a<-table.element(a,par5)
a<-table.row.end(a)
a<-table.row.start(a)
a<-table.element(a,'Degree of non-seasonal differencing (d) of Y series',header=TRUE)
a<-table.element(a,par6)
a<-table.row.end(a)
a<-table.row.start(a)
a<-table.element(a,'Degree of seasonal differencing (D) of Y series',header=TRUE)
a<-table.element(a,par7)
a<-table.row.end(a)
a<-table.row.start(a)
a<-table.element(a,'k',header=TRUE)
a<-table.element(a,'rho(Y[t],X[t+k])',header=TRUE)
a<-table.row.end(a)
mylength <- length(r$acf)
myhalf <- floor((mylength-1)/2)
for (i in 1:mylength) {
a<-table.row.start(a)
a<-table.element(a,i-myhalf-1,header=TRUE)
a<-table.element(a,r$acf[i])
a<-table.row.end(a)
}
a<-table.end(a)
table.save(a,file='mytable.tab')