Free Statistics

of Irreproducible Research!

Author's title

Author*Unverified author*
R Software Modulerwasp_autocorrelation.wasp
Title produced by software(Partial) Autocorrelation Function
Date of computationTue, 02 Dec 2008 08:31:27 -0700
Cite this page as followsStatistical Computations at FreeStatistics.org, Office for Research Development and Education, URL https://freestatistics.org/blog/index.php?v=date/2008/Dec/02/t1228231931t3s6sfakfi5xq41.htm/, Retrieved Sat, 25 May 2024 09:24:41 +0000
Statistical Computations at FreeStatistics.org, Office for Research Development and Education, URL https://freestatistics.org/blog/index.php?pk=27956, Retrieved Sat, 25 May 2024 09:24:41 +0000
QR Codes:

Original text written by user:
IsPrivate?No (this computation is public)
User-defined keywordsjulie govaerts
Estimated Impact144
Family? (F = Feedback message, R = changed R code, M = changed R Module, P = changed Parameters, D = changed Data)
-       [(Partial) Autocorrelation Function] [beter] [2008-12-02 15:31:27] [02bc582261bca489735616f51251e20c] [Current]
Feedback Forum

Post a new message
Dataseries X:
345
334
345
333
336
324
320
330
313
301
288
294
302
294
293
290
283
286
293
334
329
411
416
418
408
402
401
400
389
371
364
350
332
323
316
312
315
314
313
314
317
308
312
306
304
297
284
278
273
265
259
252
245
235
232
229
219
218
215
211


Summary of computational transaction
Raw Inputview raw input (R code)
Raw Outputview raw output of R engine
Computing time4 seconds
R Server'Herman Ole Andreas Wold' @ 193.190.124.10:1001

\begin{tabular}{lllllllll}
\hline
Summary of computational transaction \tabularnewline
Raw Input & view raw input (R code)  \tabularnewline
Raw Output & view raw output of R engine  \tabularnewline
Computing time & 4 seconds \tabularnewline
R Server & 'Herman Ole Andreas Wold' @ 193.190.124.10:1001 \tabularnewline
\hline
\end{tabular}
%Source: https://freestatistics.org/blog/index.php?pk=27956&T=0

[TABLE]
[ROW][C]Summary of computational transaction[/C][/ROW]
[ROW][C]Raw Input[/C][C]view raw input (R code) [/C][/ROW]
[ROW][C]Raw Output[/C][C]view raw output of R engine [/C][/ROW]
[ROW][C]Computing time[/C][C]4 seconds[/C][/ROW]
[ROW][C]R Server[/C][C]'Herman Ole Andreas Wold' @ 193.190.124.10:1001[/C][/ROW]
[/TABLE]
Source: https://freestatistics.org/blog/index.php?pk=27956&T=0

Globally Unique Identifier (entire table): ba.freestatistics.org/blog/index.php?pk=27956&T=0

As an alternative you can also use a QR Code:  

The GUIDs for individual cells are displayed in the table below:

Summary of computational transaction
Raw Inputview raw input (R code)
Raw Outputview raw output of R engine
Computing time4 seconds
R Server'Herman Ole Andreas Wold' @ 193.190.124.10:1001


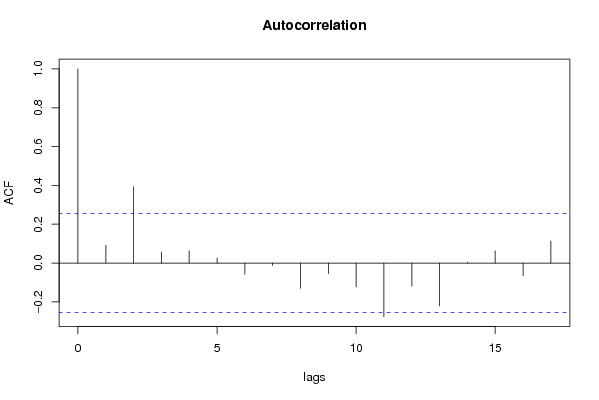
Autocorrelation Function
Time lag kACF(k)T-STATP-value
10.0911210.69990.243367
20.3932083.02030.001864
30.0568350.43660.332013
40.0636370.48880.313396
50.0254650.19560.422798
6-0.057457-0.44130.33029
7-0.012314-0.09460.462483
8-0.130063-0.9990.160929
9-0.054156-0.4160.339467
10-0.123325-0.94730.173682
11-0.276203-2.12160.019043
12-0.119414-0.91720.181376
13-0.220796-1.6960.047582
140.0044540.03420.486412
150.0635590.48820.313607
16-0.065402-0.50240.308642
170.1130070.8680.194448

\begin{tabular}{lllllllll}
\hline
Autocorrelation Function \tabularnewline
Time lag k & ACF(k) & T-STAT & P-value \tabularnewline
1 & 0.091121 & 0.6999 & 0.243367 \tabularnewline
2 & 0.393208 & 3.0203 & 0.001864 \tabularnewline
3 & 0.056835 & 0.4366 & 0.332013 \tabularnewline
4 & 0.063637 & 0.4888 & 0.313396 \tabularnewline
5 & 0.025465 & 0.1956 & 0.422798 \tabularnewline
6 & -0.057457 & -0.4413 & 0.33029 \tabularnewline
7 & -0.012314 & -0.0946 & 0.462483 \tabularnewline
8 & -0.130063 & -0.999 & 0.160929 \tabularnewline
9 & -0.054156 & -0.416 & 0.339467 \tabularnewline
10 & -0.123325 & -0.9473 & 0.173682 \tabularnewline
11 & -0.276203 & -2.1216 & 0.019043 \tabularnewline
12 & -0.119414 & -0.9172 & 0.181376 \tabularnewline
13 & -0.220796 & -1.696 & 0.047582 \tabularnewline
14 & 0.004454 & 0.0342 & 0.486412 \tabularnewline
15 & 0.063559 & 0.4882 & 0.313607 \tabularnewline
16 & -0.065402 & -0.5024 & 0.308642 \tabularnewline
17 & 0.113007 & 0.868 & 0.194448 \tabularnewline
\hline
\end{tabular}
%Source: https://freestatistics.org/blog/index.php?pk=27956&T=1

[TABLE]
[ROW][C]Autocorrelation Function[/C][/ROW]
[ROW][C]Time lag k[/C][C]ACF(k)[/C][C]T-STAT[/C][C]P-value[/C][/ROW]
[ROW][C]1[/C][C]0.091121[/C][C]0.6999[/C][C]0.243367[/C][/ROW]
[ROW][C]2[/C][C]0.393208[/C][C]3.0203[/C][C]0.001864[/C][/ROW]
[ROW][C]3[/C][C]0.056835[/C][C]0.4366[/C][C]0.332013[/C][/ROW]
[ROW][C]4[/C][C]0.063637[/C][C]0.4888[/C][C]0.313396[/C][/ROW]
[ROW][C]5[/C][C]0.025465[/C][C]0.1956[/C][C]0.422798[/C][/ROW]
[ROW][C]6[/C][C]-0.057457[/C][C]-0.4413[/C][C]0.33029[/C][/ROW]
[ROW][C]7[/C][C]-0.012314[/C][C]-0.0946[/C][C]0.462483[/C][/ROW]
[ROW][C]8[/C][C]-0.130063[/C][C]-0.999[/C][C]0.160929[/C][/ROW]
[ROW][C]9[/C][C]-0.054156[/C][C]-0.416[/C][C]0.339467[/C][/ROW]
[ROW][C]10[/C][C]-0.123325[/C][C]-0.9473[/C][C]0.173682[/C][/ROW]
[ROW][C]11[/C][C]-0.276203[/C][C]-2.1216[/C][C]0.019043[/C][/ROW]
[ROW][C]12[/C][C]-0.119414[/C][C]-0.9172[/C][C]0.181376[/C][/ROW]
[ROW][C]13[/C][C]-0.220796[/C][C]-1.696[/C][C]0.047582[/C][/ROW]
[ROW][C]14[/C][C]0.004454[/C][C]0.0342[/C][C]0.486412[/C][/ROW]
[ROW][C]15[/C][C]0.063559[/C][C]0.4882[/C][C]0.313607[/C][/ROW]
[ROW][C]16[/C][C]-0.065402[/C][C]-0.5024[/C][C]0.308642[/C][/ROW]
[ROW][C]17[/C][C]0.113007[/C][C]0.868[/C][C]0.194448[/C][/ROW]
[/TABLE]
Source: https://freestatistics.org/blog/index.php?pk=27956&T=1

Globally Unique Identifier (entire table): ba.freestatistics.org/blog/index.php?pk=27956&T=1

As an alternative you can also use a QR Code:  

The GUIDs for individual cells are displayed in the table below:

Autocorrelation Function
Time lag kACF(k)T-STATP-value
10.0911210.69990.243367
20.3932083.02030.001864
30.0568350.43660.332013
40.0636370.48880.313396
50.0254650.19560.422798
6-0.057457-0.44130.33029
7-0.012314-0.09460.462483
8-0.130063-0.9990.160929
9-0.054156-0.4160.339467
10-0.123325-0.94730.173682
11-0.276203-2.12160.019043
12-0.119414-0.91720.181376
13-0.220796-1.6960.047582
140.0044540.03420.486412
150.0635590.48820.313607
16-0.065402-0.50240.308642
170.1130070.8680.194448


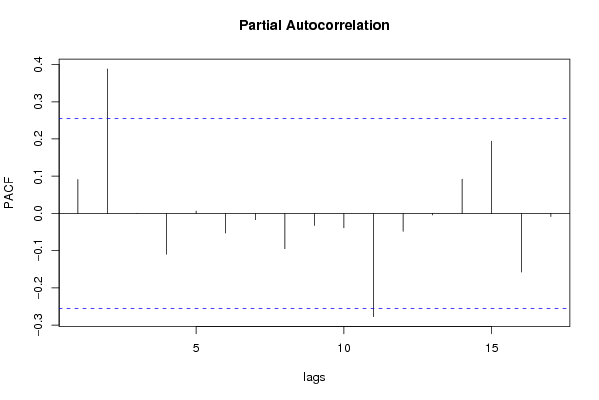
Partial Autocorrelation Function
Time lag kPACF(k)T-STATP-value
10.0911210.69990.243367
20.3881272.98130.002083
3-0.00054-0.00410.498353
4-0.109368-0.84010.20213
50.0062540.0480.480924
6-0.052741-0.40510.343429
7-0.016792-0.1290.448904
8-0.09462-0.72680.235113
9-0.032294-0.24810.402478
10-0.038516-0.29580.384194
11-0.277329-2.13020.018667
12-0.048202-0.37020.356261
13-0.004249-0.03260.487037
140.0921140.70750.241007
150.1942111.49180.070544
16-0.157432-1.20930.115693
17-0.008297-0.06370.474699

\begin{tabular}{lllllllll}
\hline
Partial Autocorrelation Function \tabularnewline
Time lag k & PACF(k) & T-STAT & P-value \tabularnewline
1 & 0.091121 & 0.6999 & 0.243367 \tabularnewline
2 & 0.388127 & 2.9813 & 0.002083 \tabularnewline
3 & -0.00054 & -0.0041 & 0.498353 \tabularnewline
4 & -0.109368 & -0.8401 & 0.20213 \tabularnewline
5 & 0.006254 & 0.048 & 0.480924 \tabularnewline
6 & -0.052741 & -0.4051 & 0.343429 \tabularnewline
7 & -0.016792 & -0.129 & 0.448904 \tabularnewline
8 & -0.09462 & -0.7268 & 0.235113 \tabularnewline
9 & -0.032294 & -0.2481 & 0.402478 \tabularnewline
10 & -0.038516 & -0.2958 & 0.384194 \tabularnewline
11 & -0.277329 & -2.1302 & 0.018667 \tabularnewline
12 & -0.048202 & -0.3702 & 0.356261 \tabularnewline
13 & -0.004249 & -0.0326 & 0.487037 \tabularnewline
14 & 0.092114 & 0.7075 & 0.241007 \tabularnewline
15 & 0.194211 & 1.4918 & 0.070544 \tabularnewline
16 & -0.157432 & -1.2093 & 0.115693 \tabularnewline
17 & -0.008297 & -0.0637 & 0.474699 \tabularnewline
\hline
\end{tabular}
%Source: https://freestatistics.org/blog/index.php?pk=27956&T=2

[TABLE]
[ROW][C]Partial Autocorrelation Function[/C][/ROW]
[ROW][C]Time lag k[/C][C]PACF(k)[/C][C]T-STAT[/C][C]P-value[/C][/ROW]
[ROW][C]1[/C][C]0.091121[/C][C]0.6999[/C][C]0.243367[/C][/ROW]
[ROW][C]2[/C][C]0.388127[/C][C]2.9813[/C][C]0.002083[/C][/ROW]
[ROW][C]3[/C][C]-0.00054[/C][C]-0.0041[/C][C]0.498353[/C][/ROW]
[ROW][C]4[/C][C]-0.109368[/C][C]-0.8401[/C][C]0.20213[/C][/ROW]
[ROW][C]5[/C][C]0.006254[/C][C]0.048[/C][C]0.480924[/C][/ROW]
[ROW][C]6[/C][C]-0.052741[/C][C]-0.4051[/C][C]0.343429[/C][/ROW]
[ROW][C]7[/C][C]-0.016792[/C][C]-0.129[/C][C]0.448904[/C][/ROW]
[ROW][C]8[/C][C]-0.09462[/C][C]-0.7268[/C][C]0.235113[/C][/ROW]
[ROW][C]9[/C][C]-0.032294[/C][C]-0.2481[/C][C]0.402478[/C][/ROW]
[ROW][C]10[/C][C]-0.038516[/C][C]-0.2958[/C][C]0.384194[/C][/ROW]
[ROW][C]11[/C][C]-0.277329[/C][C]-2.1302[/C][C]0.018667[/C][/ROW]
[ROW][C]12[/C][C]-0.048202[/C][C]-0.3702[/C][C]0.356261[/C][/ROW]
[ROW][C]13[/C][C]-0.004249[/C][C]-0.0326[/C][C]0.487037[/C][/ROW]
[ROW][C]14[/C][C]0.092114[/C][C]0.7075[/C][C]0.241007[/C][/ROW]
[ROW][C]15[/C][C]0.194211[/C][C]1.4918[/C][C]0.070544[/C][/ROW]
[ROW][C]16[/C][C]-0.157432[/C][C]-1.2093[/C][C]0.115693[/C][/ROW]
[ROW][C]17[/C][C]-0.008297[/C][C]-0.0637[/C][C]0.474699[/C][/ROW]
[/TABLE]
Source: https://freestatistics.org/blog/index.php?pk=27956&T=2

Globally Unique Identifier (entire table): ba.freestatistics.org/blog/index.php?pk=27956&T=2

As an alternative you can also use a QR Code:  

The GUIDs for individual cells are displayed in the table below:

Partial Autocorrelation Function
Time lag kPACF(k)T-STATP-value
10.0911210.69990.243367
20.3881272.98130.002083
3-0.00054-0.00410.498353
4-0.109368-0.84010.20213
50.0062540.0480.480924
6-0.052741-0.40510.343429
7-0.016792-0.1290.448904
8-0.09462-0.72680.235113
9-0.032294-0.24810.402478
10-0.038516-0.29580.384194
11-0.277329-2.13020.018667
12-0.048202-0.37020.356261
13-0.004249-0.03260.487037
140.0921140.70750.241007
150.1942111.49180.070544
16-0.157432-1.20930.115693
17-0.008297-0.06370.474699


Parameters (Session):
par1 = Default ; par2 = 1 ; par3 = 1 ; par4 = 0 ; par5 = 12 ;
Parameters (R input):
par1 = Default ; par2 = 1 ; par3 = 1 ; par4 = 0 ; par5 = 12 ;
R code (references can be found in the software module):
if (par1 == 'Default') {
par1 = 10*log10(length(x))
} else {
par1 <- as.numeric(par1)
}
par2 <- as.numeric(par2)
par3 <- as.numeric(par3)
par4 <- as.numeric(par4)
par5 <- as.numeric(par5)
if (par2 == 0) {
x <- log(x)
} else {
x <- (x ^ par2 - 1) / par2
}
if (par3 > 0) x <- diff(x,lag=1,difference=par3)
if (par4 > 0) x <- diff(x,lag=par5,difference=par4)
bitmap(file='pic1.png')
racf <- acf(x,par1,main='Autocorrelation',xlab='lags',ylab='ACF')
dev.off()
bitmap(file='pic2.png')
rpacf <- pacf(x,par1,main='Partial Autocorrelation',xlab='lags',ylab='PACF')
dev.off()
(myacf <- c(racf$acf))
(mypacf <- c(rpacf$acf))
lengthx <- length(x)
sqrtn <- sqrt(lengthx)
load(file='createtable')
a<-table.start()
a<-table.row.start(a)
a<-table.element(a,'Autocorrelation Function',4,TRUE)
a<-table.row.end(a)
a<-table.row.start(a)
a<-table.element(a,'Time lag k',header=TRUE)
a<-table.element(a,hyperlink('basics.htm','ACF(k)','click here for more information about the Autocorrelation Function'),header=TRUE)
a<-table.element(a,'T-STAT',header=TRUE)
a<-table.element(a,'P-value',header=TRUE)
a<-table.row.end(a)
for (i in 2:(par1+1)) {
a<-table.row.start(a)
a<-table.element(a,i-1,header=TRUE)
a<-table.element(a,round(myacf[i],6))
mytstat <- myacf[i]*sqrtn
a<-table.element(a,round(mytstat,4))
a<-table.element(a,round(1-pt(abs(mytstat),lengthx),6))
a<-table.row.end(a)
}
a<-table.end(a)
table.save(a,file='mytable.tab')
a<-table.start()
a<-table.row.start(a)
a<-table.element(a,'Partial Autocorrelation Function',4,TRUE)
a<-table.row.end(a)
a<-table.row.start(a)
a<-table.element(a,'Time lag k',header=TRUE)
a<-table.element(a,hyperlink('basics.htm','PACF(k)','click here for more information about the Partial Autocorrelation Function'),header=TRUE)
a<-table.element(a,'T-STAT',header=TRUE)
a<-table.element(a,'P-value',header=TRUE)
a<-table.row.end(a)
for (i in 1:par1) {
a<-table.row.start(a)
a<-table.element(a,i,header=TRUE)
a<-table.element(a,round(mypacf[i],6))
mytstat <- mypacf[i]*sqrtn
a<-table.element(a,round(mytstat,4))
a<-table.element(a,round(1-pt(abs(mytstat),lengthx),6))
a<-table.row.end(a)
}
a<-table.end(a)
table.save(a,file='mytable1.tab')