Free Statistics

of Irreproducible Research!

Author's title

Author*The author of this computation has been verified*
R Software Modulerwasp_cross.wasp
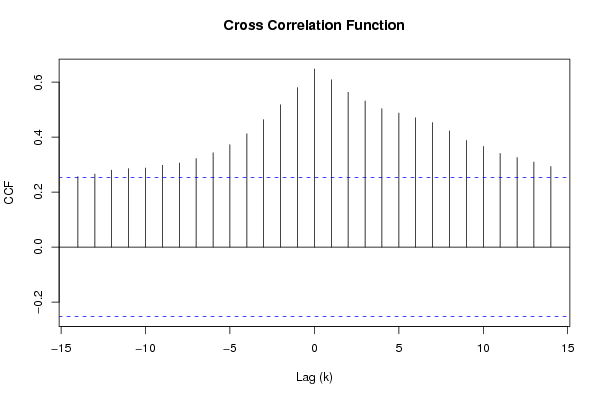
Title produced by softwareCross Correlation Function
Date of computationTue, 02 Dec 2008 08:20:00 -0700
Cite this page as followsStatistical Computations at FreeStatistics.org, Office for Research Development and Education, URL https://freestatistics.org/blog/index.php?v=date/2008/Dec/02/t1228231275zcd94uxmsfvnknl.htm/, Retrieved Sat, 25 May 2024 11:52:09 +0000
Statistical Computations at FreeStatistics.org, Office for Research Development and Education, URL https://freestatistics.org/blog/index.php?pk=27939, Retrieved Sat, 25 May 2024 11:52:09 +0000
QR Codes:

Original text written by user:
IsPrivate?No (this computation is public)
User-defined keywordsQ7 Cross correlation Own time series
Estimated Impact165
Family? (F = Feedback message, R = changed R code, M = changed R Module, P = changed Parameters, D = changed Data)
F       [Cross Correlation Function] [Q7 Cross correlat...] [2008-12-02 15:20:00] [9f72e095d5529918bf5b0810c01bf6ce] [Current]
Feedback Forum
2008-12-06 17:55:49 [a2386b643d711541400692649981f2dc] [reply
Je kon nog vermelden waarom we de cross correlatie methode gebruiken. Bij cross correlatie kijken we naar het verband tussen 2 verschillende reeksen. We gaan na op welke basis we yt kunnen verklaren op de waarde van xt of de vorige waarde van xt. Met andere woorden gaan we kijken of xt een ‘leading indicator’ is. (Of hij op voorhand al informatie gaat geven over yt)
  2008-12-09 00:13:25 [Jessica Alves Pires] [reply
Ik vermeld dit wel. Ik zeg bijvoorbeeld: De correlatie tussen Yt (=dollarkoers) en X-14 (goudkoers met 14 perioden vertraagd ten opzichte van Yt) is 0.256409574671366.

Post a new message
Dataseries X:
1.0622
1.0773
1.0807
1.0848
1.1582
1.1663
1.1372
1.1139
1.1222
1.1692
1.1702
1.2286
1.2613
1.2646
1.2262
1.1985
1.2007
1.2138
1.2266
1.2176
1.2218
1.249
1.2991
1.3408
1.3119
1.3014
1.3201
1.2938
1.2694
1.2165
1.2037
1.2292
1.2256
1.2015
1.1786
1.1856
1.2103
1.1938
1.202
1.2271
1.277
1.265
1.2684
1.2811
1.2727
1.2611
1.2881
1.3213
1.2999
1.3074
1.3242
1.3516
1.3511
1.3419
1.3716
1.3622
1.3896
1.4227
1.4684
1.457
Dataseries Y:
10812
10738
10171
9721
9897
9828
9924
10371
10846
10413
10709
10662
10570
10297
10635
10872
10296
10383
10431
10574
10653
10805
10872
10625
10407
10463
10556
10646
10702
11353
11346
11451
11964
12574
13031
13812
14544
14931
14886
16005
17064
15168
16050
15839
15137
14954
15648
15305
15579
16348
15928
16171
15937
15713
15594
15683
16438
17032
17696
17745


Summary of computational transaction
Raw Inputview raw input (R code)
Raw Outputview raw output of R engine
Computing time0 seconds
R Server'Gwilym Jenkins' @ 72.249.127.135

\begin{tabular}{lllllllll}
\hline
Summary of computational transaction \tabularnewline
Raw Input & view raw input (R code)  \tabularnewline
Raw Output & view raw output of R engine  \tabularnewline
Computing time & 0 seconds \tabularnewline
R Server & 'Gwilym Jenkins' @ 72.249.127.135 \tabularnewline
\hline
\end{tabular}
%Source: https://freestatistics.org/blog/index.php?pk=27939&T=0

[TABLE]
[ROW][C]Summary of computational transaction[/C][/ROW]
[ROW][C]Raw Input[/C][C]view raw input (R code) [/C][/ROW]
[ROW][C]Raw Output[/C][C]view raw output of R engine [/C][/ROW]
[ROW][C]Computing time[/C][C]0 seconds[/C][/ROW]
[ROW][C]R Server[/C][C]'Gwilym Jenkins' @ 72.249.127.135[/C][/ROW]
[/TABLE]
Source: https://freestatistics.org/blog/index.php?pk=27939&T=0

Globally Unique Identifier (entire table): ba.freestatistics.org/blog/index.php?pk=27939&T=0

As an alternative you can also use a QR Code:  

The GUIDs for individual cells are displayed in the table below:

Summary of computational transaction
Raw Inputview raw input (R code)
Raw Outputview raw output of R engine
Computing time0 seconds
R Server'Gwilym Jenkins' @ 72.249.127.135


Cross Correlation Function
ParameterValue
Box-Cox transformation parameter (lambda) of X series1
Degree of non-seasonal differencing (d) of X series0
Degree of seasonal differencing (D) of X series0
Seasonal Period (s)12
Box-Cox transformation parameter (lambda) of Y series1
Degree of non-seasonal differencing (d) of Y series0
Degree of seasonal differencing (D) of Y series0
krho(Y[t],X[t+k])
-140.256409574671366
-130.265846733744858
-120.279922981192363
-110.285275909611388
-100.287743153504901
-90.29751608293154
-80.306091632729388
-70.322333857036132
-60.34295280573191
-50.372726532660059
-40.412074413444569
-30.463576323572652
-20.517924062266369
-10.580489065697295
00.648319002938759
10.608918733932995
20.563499638365693
30.532102040354569
40.503653866158179
50.487889885058581
60.470318960082304
70.453060443202404
80.422689988903763
90.387985828090237
100.366309411336508
110.341033397262784
120.325698427329402
130.309388627721830
140.293024316540169

\begin{tabular}{lllllllll}
\hline
Cross Correlation Function \tabularnewline
Parameter & Value \tabularnewline
Box-Cox transformation parameter (lambda) of X series & 1 \tabularnewline
Degree of non-seasonal differencing (d) of X series & 0 \tabularnewline
Degree of seasonal differencing (D) of X series & 0 \tabularnewline
Seasonal Period (s) & 12 \tabularnewline
Box-Cox transformation parameter (lambda) of Y series & 1 \tabularnewline
Degree of non-seasonal differencing (d) of Y series & 0 \tabularnewline
Degree of seasonal differencing (D) of Y series & 0 \tabularnewline
k & rho(Y[t],X[t+k]) \tabularnewline
-14 & 0.256409574671366 \tabularnewline
-13 & 0.265846733744858 \tabularnewline
-12 & 0.279922981192363 \tabularnewline
-11 & 0.285275909611388 \tabularnewline
-10 & 0.287743153504901 \tabularnewline
-9 & 0.29751608293154 \tabularnewline
-8 & 0.306091632729388 \tabularnewline
-7 & 0.322333857036132 \tabularnewline
-6 & 0.34295280573191 \tabularnewline
-5 & 0.372726532660059 \tabularnewline
-4 & 0.412074413444569 \tabularnewline
-3 & 0.463576323572652 \tabularnewline
-2 & 0.517924062266369 \tabularnewline
-1 & 0.580489065697295 \tabularnewline
0 & 0.648319002938759 \tabularnewline
1 & 0.608918733932995 \tabularnewline
2 & 0.563499638365693 \tabularnewline
3 & 0.532102040354569 \tabularnewline
4 & 0.503653866158179 \tabularnewline
5 & 0.487889885058581 \tabularnewline
6 & 0.470318960082304 \tabularnewline
7 & 0.453060443202404 \tabularnewline
8 & 0.422689988903763 \tabularnewline
9 & 0.387985828090237 \tabularnewline
10 & 0.366309411336508 \tabularnewline
11 & 0.341033397262784 \tabularnewline
12 & 0.325698427329402 \tabularnewline
13 & 0.309388627721830 \tabularnewline
14 & 0.293024316540169 \tabularnewline
\hline
\end{tabular}
%Source: https://freestatistics.org/blog/index.php?pk=27939&T=1

[TABLE]
[ROW][C]Cross Correlation Function[/C][/ROW]
[ROW][C]Parameter[/C][C]Value[/C][/ROW]
[ROW][C]Box-Cox transformation parameter (lambda) of X series[/C][C]1[/C][/ROW]
[ROW][C]Degree of non-seasonal differencing (d) of X series[/C][C]0[/C][/ROW]
[ROW][C]Degree of seasonal differencing (D) of X series[/C][C]0[/C][/ROW]
[ROW][C]Seasonal Period (s)[/C][C]12[/C][/ROW]
[ROW][C]Box-Cox transformation parameter (lambda) of Y series[/C][C]1[/C][/ROW]
[ROW][C]Degree of non-seasonal differencing (d) of Y series[/C][C]0[/C][/ROW]
[ROW][C]Degree of seasonal differencing (D) of Y series[/C][C]0[/C][/ROW]
[ROW][C]k[/C][C]rho(Y[t],X[t+k])[/C][/ROW]
[ROW][C]-14[/C][C]0.256409574671366[/C][/ROW]
[ROW][C]-13[/C][C]0.265846733744858[/C][/ROW]
[ROW][C]-12[/C][C]0.279922981192363[/C][/ROW]
[ROW][C]-11[/C][C]0.285275909611388[/C][/ROW]
[ROW][C]-10[/C][C]0.287743153504901[/C][/ROW]
[ROW][C]-9[/C][C]0.29751608293154[/C][/ROW]
[ROW][C]-8[/C][C]0.306091632729388[/C][/ROW]
[ROW][C]-7[/C][C]0.322333857036132[/C][/ROW]
[ROW][C]-6[/C][C]0.34295280573191[/C][/ROW]
[ROW][C]-5[/C][C]0.372726532660059[/C][/ROW]
[ROW][C]-4[/C][C]0.412074413444569[/C][/ROW]
[ROW][C]-3[/C][C]0.463576323572652[/C][/ROW]
[ROW][C]-2[/C][C]0.517924062266369[/C][/ROW]
[ROW][C]-1[/C][C]0.580489065697295[/C][/ROW]
[ROW][C]0[/C][C]0.648319002938759[/C][/ROW]
[ROW][C]1[/C][C]0.608918733932995[/C][/ROW]
[ROW][C]2[/C][C]0.563499638365693[/C][/ROW]
[ROW][C]3[/C][C]0.532102040354569[/C][/ROW]
[ROW][C]4[/C][C]0.503653866158179[/C][/ROW]
[ROW][C]5[/C][C]0.487889885058581[/C][/ROW]
[ROW][C]6[/C][C]0.470318960082304[/C][/ROW]
[ROW][C]7[/C][C]0.453060443202404[/C][/ROW]
[ROW][C]8[/C][C]0.422689988903763[/C][/ROW]
[ROW][C]9[/C][C]0.387985828090237[/C][/ROW]
[ROW][C]10[/C][C]0.366309411336508[/C][/ROW]
[ROW][C]11[/C][C]0.341033397262784[/C][/ROW]
[ROW][C]12[/C][C]0.325698427329402[/C][/ROW]
[ROW][C]13[/C][C]0.309388627721830[/C][/ROW]
[ROW][C]14[/C][C]0.293024316540169[/C][/ROW]
[/TABLE]
Source: https://freestatistics.org/blog/index.php?pk=27939&T=1

Globally Unique Identifier (entire table): ba.freestatistics.org/blog/index.php?pk=27939&T=1

As an alternative you can also use a QR Code:  

The GUIDs for individual cells are displayed in the table below:

Cross Correlation Function
ParameterValue
Box-Cox transformation parameter (lambda) of X series1
Degree of non-seasonal differencing (d) of X series0
Degree of seasonal differencing (D) of X series0
Seasonal Period (s)12
Box-Cox transformation parameter (lambda) of Y series1
Degree of non-seasonal differencing (d) of Y series0
Degree of seasonal differencing (D) of Y series0
krho(Y[t],X[t+k])
-140.256409574671366
-130.265846733744858
-120.279922981192363
-110.285275909611388
-100.287743153504901
-90.29751608293154
-80.306091632729388
-70.322333857036132
-60.34295280573191
-50.372726532660059
-40.412074413444569
-30.463576323572652
-20.517924062266369
-10.580489065697295
00.648319002938759
10.608918733932995
20.563499638365693
30.532102040354569
40.503653866158179
50.487889885058581
60.470318960082304
70.453060443202404
80.422689988903763
90.387985828090237
100.366309411336508
110.341033397262784
120.325698427329402
130.309388627721830
140.293024316540169


Parameters (Session):
par1 = 1 ; par2 = 0 ; par3 = 0 ; par4 = 12 ; par5 = 1 ; par6 = 0 ; par7 = 0 ;
Parameters (R input):
par1 = 1 ; par2 = 0 ; par3 = 0 ; par4 = 12 ; par5 = 1 ; par6 = 0 ; par7 = 0 ;
R code (references can be found in the software module):
par1 <- as.numeric(par1)
par2 <- as.numeric(par2)
par3 <- as.numeric(par3)
par4 <- as.numeric(par4)
par5 <- as.numeric(par5)
par6 <- as.numeric(par6)
par7 <- as.numeric(par7)
if (par1 == 0) {
x <- log(x)
} else {
x <- (x ^ par1 - 1) / par1
}
if (par5 == 0) {
y <- log(y)
} else {
y <- (y ^ par5 - 1) / par5
}
if (par2 > 0) x <- diff(x,lag=1,difference=par2)
if (par6 > 0) y <- diff(y,lag=1,difference=par6)
if (par3 > 0) x <- diff(x,lag=par4,difference=par3)
if (par7 > 0) y <- diff(y,lag=par4,difference=par7)
x
y
bitmap(file='test1.png')
(r <- ccf(x,y,main='Cross Correlation Function',ylab='CCF',xlab='Lag (k)'))
dev.off()
load(file='createtable')
a<-table.start()
a<-table.row.start(a)
a<-table.element(a,'Cross Correlation Function',2,TRUE)
a<-table.row.end(a)
a<-table.row.start(a)
a<-table.element(a,'Parameter',header=TRUE)
a<-table.element(a,'Value',header=TRUE)
a<-table.row.end(a)
a<-table.row.start(a)
a<-table.element(a,'Box-Cox transformation parameter (lambda) of X series',header=TRUE)
a<-table.element(a,par1)
a<-table.row.end(a)
a<-table.row.start(a)
a<-table.element(a,'Degree of non-seasonal differencing (d) of X series',header=TRUE)
a<-table.element(a,par2)
a<-table.row.end(a)
a<-table.row.start(a)
a<-table.element(a,'Degree of seasonal differencing (D) of X series',header=TRUE)
a<-table.element(a,par3)
a<-table.row.end(a)
a<-table.row.start(a)
a<-table.element(a,'Seasonal Period (s)',header=TRUE)
a<-table.element(a,par4)
a<-table.row.end(a)
a<-table.row.start(a)
a<-table.element(a,'Box-Cox transformation parameter (lambda) of Y series',header=TRUE)
a<-table.element(a,par5)
a<-table.row.end(a)
a<-table.row.start(a)
a<-table.element(a,'Degree of non-seasonal differencing (d) of Y series',header=TRUE)
a<-table.element(a,par6)
a<-table.row.end(a)
a<-table.row.start(a)
a<-table.element(a,'Degree of seasonal differencing (D) of Y series',header=TRUE)
a<-table.element(a,par7)
a<-table.row.end(a)
a<-table.row.start(a)
a<-table.element(a,'k',header=TRUE)
a<-table.element(a,'rho(Y[t],X[t+k])',header=TRUE)
a<-table.row.end(a)
mylength <- length(r$acf)
myhalf <- floor((mylength-1)/2)
for (i in 1:mylength) {
a<-table.row.start(a)
a<-table.element(a,i-myhalf-1,header=TRUE)
a<-table.element(a,r$acf[i])
a<-table.row.end(a)
}
a<-table.end(a)
table.save(a,file='mytable.tab')