Free Statistics

of Irreproducible Research!

Author's title

Author*The author of this computation has been verified*
R Software Modulerwasp_cross.wasp
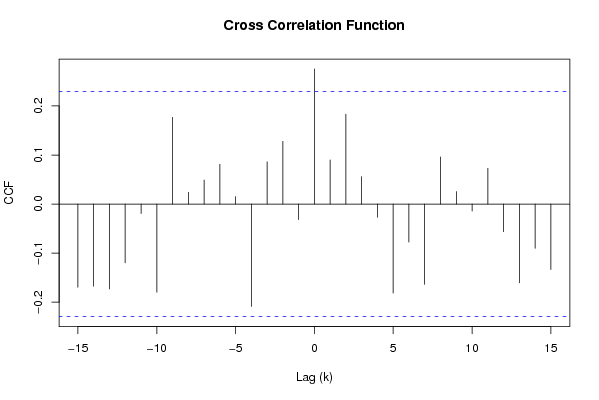
Title produced by softwareCross Correlation Function
Date of computationTue, 02 Dec 2008 06:45:44 -0700
Cite this page as followsStatistical Computations at FreeStatistics.org, Office for Research Development and Education, URL https://freestatistics.org/blog/index.php?v=date/2008/Dec/02/t1228225607l3qkwou8mfi22gt.htm/, Retrieved Sat, 25 May 2024 15:37:02 +0000
Statistical Computations at FreeStatistics.org, Office for Research Development and Education, URL https://freestatistics.org/blog/index.php?pk=27778, Retrieved Sat, 25 May 2024 15:37:02 +0000
QR Codes:

Original text written by user:
IsPrivate?No (this computation is public)
User-defined keywords
Estimated Impact187
Family? (F = Feedback message, R = changed R code, M = changed R Module, P = changed Parameters, D = changed Data)
F     [Cross Correlation Function] [CCF] [2008-12-02 13:17:13] [a4602103a5e123497aa555277d0e627b]
F   PD    [Cross Correlation Function] [CCF] [2008-12-02 13:45:44] [09074fbe368d26382bb94e5bb318a104] [Current]
Feedback Forum
2008-12-04 13:58:44 [Steven Vercammen] [reply
Dit klopt, maar de uitleg is niet volledig.
Het feit dat er veel minder correlaties significant zijn betekent dat er sprake was van een schijncorrelatie. Er was een ‘Z’ die invloed had op beide variabelen en dus zorgde voor een schijnbare correlatie tussen X en Y. In bovenstaande grafiek is de invloed van die Z geëlimineerd. Dit geeft dus een betrouwbaarder beeld en toont aan dat we Y veel minder goed kunnen voorspellen op basis van vroegere en toekomstige waarden van X.
2008-12-08 19:29:23 [5faab2fc6fb120339944528a32d48a04] [reply
In deze grafiek wordt het verband tussen beide variabelen weergegeven. Het lange termijn effect en seizonaaleffect is wel verwijderd uit de reeks.

Post a new message
Dataseries X:
103.1
100.6
103.1
95.5
90.5
90.9
88.8
90.7
94.3
104.6
111.1
110.8
107.2
99.0
99.0
91.0
96.2
96.9
96.2
100.1
99.0
115.4
106.9
107.1
99.3
99.2
108.3
105.6
99.5
107.4
93.1
88.1
110.7
113.1
99.6
93.6
98.6
99.6
114.3
107.8
101.2
112.5
100.5
93.9
116.2
112.0
106.4
95.7
96.0
95.8
103.0
102.2
98.4
111.4
86.6
91.3
107.9
101.8
104.4
93.4
100.1
98.5
112.9
101.4
107.1
110.8
90.3
95.5
111.4
113.0
107.5
95.9
106.3
105.2
117.2
106.9
108.2
113.0
97.2
99.9
108.1
118.1
109.1
93.3
112.1
Dataseries Y:
119.5
125.0
145.0
105.3
116.9
120.1
88.9
78.4
114.6
113.3
117.0
99.6
99.4
101.9
115.2
108.5
113.8
121.0
92.2
90.2
101.5
126.6
93.9
89.8
93.4
101.5
110.4
105.9
108.4
113.9
86.1
69.4
101.2
100.5
98.0
106.6
90.1
96.9
125.9
112.0
100.0
123.9
79.8
83.4
113.6
112.9
104.0
109.9
99.0
106.3
128.9
111.1
102.9
130.0
87.0
87.5
117.6
103.4
110.8
112.6
102.5
112.4
135.6
105.1
127.7
137.0
91.0
90.5
122.4
123.3
124.3
120.0
118.1
119.0
142.7
123.6
129.6
151.6
110.4
99.2
130.5
136.2
129.7
128.0
121.6


Summary of computational transaction
Raw Inputview raw input (R code)
Raw Outputview raw output of R engine
Computing time1 seconds
R Server'Gwilym Jenkins' @ 72.249.127.135

\begin{tabular}{lllllllll}
\hline
Summary of computational transaction \tabularnewline
Raw Input & view raw input (R code)  \tabularnewline
Raw Output & view raw output of R engine  \tabularnewline
Computing time & 1 seconds \tabularnewline
R Server & 'Gwilym Jenkins' @ 72.249.127.135 \tabularnewline
\hline
\end{tabular}
%Source: https://freestatistics.org/blog/index.php?pk=27778&T=0

[TABLE]
[ROW][C]Summary of computational transaction[/C][/ROW]
[ROW][C]Raw Input[/C][C]view raw input (R code) [/C][/ROW]
[ROW][C]Raw Output[/C][C]view raw output of R engine [/C][/ROW]
[ROW][C]Computing time[/C][C]1 seconds[/C][/ROW]
[ROW][C]R Server[/C][C]'Gwilym Jenkins' @ 72.249.127.135[/C][/ROW]
[/TABLE]
Source: https://freestatistics.org/blog/index.php?pk=27778&T=0

Globally Unique Identifier (entire table): ba.freestatistics.org/blog/index.php?pk=27778&T=0

As an alternative you can also use a QR Code:  

The GUIDs for individual cells are displayed in the table below:

Summary of computational transaction
Raw Inputview raw input (R code)
Raw Outputview raw output of R engine
Computing time1 seconds
R Server'Gwilym Jenkins' @ 72.249.127.135


Cross Correlation Function
ParameterValue
Box-Cox transformation parameter (lambda) of X series1
Degree of non-seasonal differencing (d) of X series0
Degree of seasonal differencing (D) of X series1
Seasonal Period (s)12
Box-Cox transformation parameter (lambda) of Y series1
Degree of non-seasonal differencing (d) of Y series0
Degree of seasonal differencing (D) of Y series1
krho(Y[t],X[t+k])
-15-0.169383815871046
-14-0.167284594655772
-13-0.173021841879155
-12-0.11964390960387
-11-0.0190756217012779
-10-0.179538050285359
-90.176817897652426
-80.0240340221140066
-70.0490381633392539
-60.0812556817693805
-50.0154063864827919
-4-0.208657213079134
-30.0863055318187623
-20.127954348042543
-1-0.0315833686954385
00.275512376353450
10.089967775186433
20.183232587126697
30.0559616135390919
4-0.0267040948864472
5-0.181276820799616
6-0.0773714363449297
7-0.163436776766494
80.0961070277002962
90.0256350305957453
10-0.0140853489468331
110.0730980062954541
12-0.0561038368435531
13-0.160464140000711
14-0.090100764642634
15-0.133218066848514

\begin{tabular}{lllllllll}
\hline
Cross Correlation Function \tabularnewline
Parameter & Value \tabularnewline
Box-Cox transformation parameter (lambda) of X series & 1 \tabularnewline
Degree of non-seasonal differencing (d) of X series & 0 \tabularnewline
Degree of seasonal differencing (D) of X series & 1 \tabularnewline
Seasonal Period (s) & 12 \tabularnewline
Box-Cox transformation parameter (lambda) of Y series & 1 \tabularnewline
Degree of non-seasonal differencing (d) of Y series & 0 \tabularnewline
Degree of seasonal differencing (D) of Y series & 1 \tabularnewline
k & rho(Y[t],X[t+k]) \tabularnewline
-15 & -0.169383815871046 \tabularnewline
-14 & -0.167284594655772 \tabularnewline
-13 & -0.173021841879155 \tabularnewline
-12 & -0.11964390960387 \tabularnewline
-11 & -0.0190756217012779 \tabularnewline
-10 & -0.179538050285359 \tabularnewline
-9 & 0.176817897652426 \tabularnewline
-8 & 0.0240340221140066 \tabularnewline
-7 & 0.0490381633392539 \tabularnewline
-6 & 0.0812556817693805 \tabularnewline
-5 & 0.0154063864827919 \tabularnewline
-4 & -0.208657213079134 \tabularnewline
-3 & 0.0863055318187623 \tabularnewline
-2 & 0.127954348042543 \tabularnewline
-1 & -0.0315833686954385 \tabularnewline
0 & 0.275512376353450 \tabularnewline
1 & 0.089967775186433 \tabularnewline
2 & 0.183232587126697 \tabularnewline
3 & 0.0559616135390919 \tabularnewline
4 & -0.0267040948864472 \tabularnewline
5 & -0.181276820799616 \tabularnewline
6 & -0.0773714363449297 \tabularnewline
7 & -0.163436776766494 \tabularnewline
8 & 0.0961070277002962 \tabularnewline
9 & 0.0256350305957453 \tabularnewline
10 & -0.0140853489468331 \tabularnewline
11 & 0.0730980062954541 \tabularnewline
12 & -0.0561038368435531 \tabularnewline
13 & -0.160464140000711 \tabularnewline
14 & -0.090100764642634 \tabularnewline
15 & -0.133218066848514 \tabularnewline
\hline
\end{tabular}
%Source: https://freestatistics.org/blog/index.php?pk=27778&T=1

[TABLE]
[ROW][C]Cross Correlation Function[/C][/ROW]
[ROW][C]Parameter[/C][C]Value[/C][/ROW]
[ROW][C]Box-Cox transformation parameter (lambda) of X series[/C][C]1[/C][/ROW]
[ROW][C]Degree of non-seasonal differencing (d) of X series[/C][C]0[/C][/ROW]
[ROW][C]Degree of seasonal differencing (D) of X series[/C][C]1[/C][/ROW]
[ROW][C]Seasonal Period (s)[/C][C]12[/C][/ROW]
[ROW][C]Box-Cox transformation parameter (lambda) of Y series[/C][C]1[/C][/ROW]
[ROW][C]Degree of non-seasonal differencing (d) of Y series[/C][C]0[/C][/ROW]
[ROW][C]Degree of seasonal differencing (D) of Y series[/C][C]1[/C][/ROW]
[ROW][C]k[/C][C]rho(Y[t],X[t+k])[/C][/ROW]
[ROW][C]-15[/C][C]-0.169383815871046[/C][/ROW]
[ROW][C]-14[/C][C]-0.167284594655772[/C][/ROW]
[ROW][C]-13[/C][C]-0.173021841879155[/C][/ROW]
[ROW][C]-12[/C][C]-0.11964390960387[/C][/ROW]
[ROW][C]-11[/C][C]-0.0190756217012779[/C][/ROW]
[ROW][C]-10[/C][C]-0.179538050285359[/C][/ROW]
[ROW][C]-9[/C][C]0.176817897652426[/C][/ROW]
[ROW][C]-8[/C][C]0.0240340221140066[/C][/ROW]
[ROW][C]-7[/C][C]0.0490381633392539[/C][/ROW]
[ROW][C]-6[/C][C]0.0812556817693805[/C][/ROW]
[ROW][C]-5[/C][C]0.0154063864827919[/C][/ROW]
[ROW][C]-4[/C][C]-0.208657213079134[/C][/ROW]
[ROW][C]-3[/C][C]0.0863055318187623[/C][/ROW]
[ROW][C]-2[/C][C]0.127954348042543[/C][/ROW]
[ROW][C]-1[/C][C]-0.0315833686954385[/C][/ROW]
[ROW][C]0[/C][C]0.275512376353450[/C][/ROW]
[ROW][C]1[/C][C]0.089967775186433[/C][/ROW]
[ROW][C]2[/C][C]0.183232587126697[/C][/ROW]
[ROW][C]3[/C][C]0.0559616135390919[/C][/ROW]
[ROW][C]4[/C][C]-0.0267040948864472[/C][/ROW]
[ROW][C]5[/C][C]-0.181276820799616[/C][/ROW]
[ROW][C]6[/C][C]-0.0773714363449297[/C][/ROW]
[ROW][C]7[/C][C]-0.163436776766494[/C][/ROW]
[ROW][C]8[/C][C]0.0961070277002962[/C][/ROW]
[ROW][C]9[/C][C]0.0256350305957453[/C][/ROW]
[ROW][C]10[/C][C]-0.0140853489468331[/C][/ROW]
[ROW][C]11[/C][C]0.0730980062954541[/C][/ROW]
[ROW][C]12[/C][C]-0.0561038368435531[/C][/ROW]
[ROW][C]13[/C][C]-0.160464140000711[/C][/ROW]
[ROW][C]14[/C][C]-0.090100764642634[/C][/ROW]
[ROW][C]15[/C][C]-0.133218066848514[/C][/ROW]
[/TABLE]
Source: https://freestatistics.org/blog/index.php?pk=27778&T=1

Globally Unique Identifier (entire table): ba.freestatistics.org/blog/index.php?pk=27778&T=1

As an alternative you can also use a QR Code:  

The GUIDs for individual cells are displayed in the table below:

Cross Correlation Function
ParameterValue
Box-Cox transformation parameter (lambda) of X series1
Degree of non-seasonal differencing (d) of X series0
Degree of seasonal differencing (D) of X series1
Seasonal Period (s)12
Box-Cox transformation parameter (lambda) of Y series1
Degree of non-seasonal differencing (d) of Y series0
Degree of seasonal differencing (D) of Y series1
krho(Y[t],X[t+k])
-15-0.169383815871046
-14-0.167284594655772
-13-0.173021841879155
-12-0.11964390960387
-11-0.0190756217012779
-10-0.179538050285359
-90.176817897652426
-80.0240340221140066
-70.0490381633392539
-60.0812556817693805
-50.0154063864827919
-4-0.208657213079134
-30.0863055318187623
-20.127954348042543
-1-0.0315833686954385
00.275512376353450
10.089967775186433
20.183232587126697
30.0559616135390919
4-0.0267040948864472
5-0.181276820799616
6-0.0773714363449297
7-0.163436776766494
80.0961070277002962
90.0256350305957453
10-0.0140853489468331
110.0730980062954541
12-0.0561038368435531
13-0.160464140000711
14-0.090100764642634
15-0.133218066848514


Parameters (Session):
par1 = 1 ; par2 = 0 ; par3 = 1 ; par4 = 12 ; par5 = 1 ; par6 = 0 ; par7 = 1 ;
Parameters (R input):
par1 = 1 ; par2 = 0 ; par3 = 1 ; par4 = 12 ; par5 = 1 ; par6 = 0 ; par7 = 1 ;
R code (references can be found in the software module):
par1 <- as.numeric(par1)
par2 <- as.numeric(par2)
par3 <- as.numeric(par3)
par4 <- as.numeric(par4)
par5 <- as.numeric(par5)
par6 <- as.numeric(par6)
par7 <- as.numeric(par7)
if (par1 == 0) {
x <- log(x)
} else {
x <- (x ^ par1 - 1) / par1
}
if (par5 == 0) {
y <- log(y)
} else {
y <- (y ^ par5 - 1) / par5
}
if (par2 > 0) x <- diff(x,lag=1,difference=par2)
if (par6 > 0) y <- diff(y,lag=1,difference=par6)
if (par3 > 0) x <- diff(x,lag=par4,difference=par3)
if (par7 > 0) y <- diff(y,lag=par4,difference=par7)
x
y
bitmap(file='test1.png')
(r <- ccf(x,y,main='Cross Correlation Function',ylab='CCF',xlab='Lag (k)'))
dev.off()
load(file='createtable')
a<-table.start()
a<-table.row.start(a)
a<-table.element(a,'Cross Correlation Function',2,TRUE)
a<-table.row.end(a)
a<-table.row.start(a)
a<-table.element(a,'Parameter',header=TRUE)
a<-table.element(a,'Value',header=TRUE)
a<-table.row.end(a)
a<-table.row.start(a)
a<-table.element(a,'Box-Cox transformation parameter (lambda) of X series',header=TRUE)
a<-table.element(a,par1)
a<-table.row.end(a)
a<-table.row.start(a)
a<-table.element(a,'Degree of non-seasonal differencing (d) of X series',header=TRUE)
a<-table.element(a,par2)
a<-table.row.end(a)
a<-table.row.start(a)
a<-table.element(a,'Degree of seasonal differencing (D) of X series',header=TRUE)
a<-table.element(a,par3)
a<-table.row.end(a)
a<-table.row.start(a)
a<-table.element(a,'Seasonal Period (s)',header=TRUE)
a<-table.element(a,par4)
a<-table.row.end(a)
a<-table.row.start(a)
a<-table.element(a,'Box-Cox transformation parameter (lambda) of Y series',header=TRUE)
a<-table.element(a,par5)
a<-table.row.end(a)
a<-table.row.start(a)
a<-table.element(a,'Degree of non-seasonal differencing (d) of Y series',header=TRUE)
a<-table.element(a,par6)
a<-table.row.end(a)
a<-table.row.start(a)
a<-table.element(a,'Degree of seasonal differencing (D) of Y series',header=TRUE)
a<-table.element(a,par7)
a<-table.row.end(a)
a<-table.row.start(a)
a<-table.element(a,'k',header=TRUE)
a<-table.element(a,'rho(Y[t],X[t+k])',header=TRUE)
a<-table.row.end(a)
mylength <- length(r$acf)
myhalf <- floor((mylength-1)/2)
for (i in 1:mylength) {
a<-table.row.start(a)
a<-table.element(a,i-myhalf-1,header=TRUE)
a<-table.element(a,r$acf[i])
a<-table.row.end(a)
}
a<-table.end(a)
table.save(a,file='mytable.tab')