Free Statistics

of Irreproducible Research!

Author's title

Author*Unverified author*
R Software Modulerwasp_autocorrelation.wasp
Title produced by software(Partial) Autocorrelation Function
Date of computationTue, 27 Nov 2007 03:25:05 -0700
Cite this page as followsStatistical Computations at FreeStatistics.org, Office for Research Development and Education, URL https://freestatistics.org/blog/index.php?v=date/2007/Nov/27/t1196158634vpm2x5pyd9dc031.htm/, Retrieved Mon, 29 Apr 2024 13:43:16 +0000
Statistical Computations at FreeStatistics.org, Office for Research Development and Education, URL https://freestatistics.org/blog/index.php?pk=6824, Retrieved Mon, 29 Apr 2024 13:43:16 +0000
QR Codes:

Original text written by user:
IsPrivate?No (this computation is public)
User-defined keywordsYannick Leroy, Nick Vandewalle, Jeroen Goetschalckx, Nick Van Hove, Jef Jacobs, Michiel Van den Broeck
Estimated Impact224
Family? (F = Feedback message, R = changed R code, M = changed R Module, P = changed Parameters, D = changed Data)
-       [(Partial) Autocorrelation Function] [Autocorrelatie d=...] [2007-11-27 10:25:05] [9ec4fcc2bfe8b6d942eac6074e595603] [Current]
- RMPD    [(Partial) Autocorrelation Function] [PAPER] [2009-12-02 23:32:15] [37daf76adc256428993ec4063536c760]
-   P       [(Partial) Autocorrelation Function] [PAPER] [2009-12-02 23:46:11] [37daf76adc256428993ec4063536c760]
Feedback Forum

Post a new message
Dataseries X:
3.926
3.517
4.142
4.353
5.029
4.755
3.862
4.406
4.567
4.863
4.121
3.626
3.804
3.491
4.151
4.254
4.717
4.866
4.001
3.758
4.78
5.016
4.296
4.467
3.891
3.872
3.867
3.973
4.64
4.538
3.836
3.77
4.374
4.497
3.945
3.862
3.608
3.301
3.882
3.605
4.305
4.216
3.971
3.988
4.317
4.484
4.247
3.52
3.687
3.405
3.99
4.047
4.549
4.559
3.926
4.206
4.517
4.387
3.219
3.129


Summary of compuational transaction
Raw Inputview raw input (R code)
Raw Outputview raw output of R engine
Computing time2 seconds
R Server'Gwilym Jenkins' @ 72.249.127.135

\begin{tabular}{lllllllll}
\hline
Summary of compuational transaction \tabularnewline
Raw Input & view raw input (R code)  \tabularnewline
Raw Output & view raw output of R engine  \tabularnewline
Computing time & 2 seconds \tabularnewline
R Server & 'Gwilym Jenkins' @ 72.249.127.135 \tabularnewline
\hline
\end{tabular}
%Source: https://freestatistics.org/blog/index.php?pk=6824&T=0

[TABLE]
[ROW][C]Summary of compuational transaction[/C][/ROW]
[ROW][C]Raw Input[/C][C]view raw input (R code) [/C][/ROW]
[ROW][C]Raw Output[/C][C]view raw output of R engine [/C][/ROW]
[ROW][C]Computing time[/C][C]2 seconds[/C][/ROW]
[ROW][C]R Server[/C][C]'Gwilym Jenkins' @ 72.249.127.135[/C][/ROW]
[/TABLE]
Source: https://freestatistics.org/blog/index.php?pk=6824&T=0

Globally Unique Identifier (entire table): ba.freestatistics.org/blog/index.php?pk=6824&T=0

As an alternative you can also use a QR Code:  

The GUIDs for individual cells are displayed in the table below:

Summary of compuational transaction
Raw Inputview raw input (R code)
Raw Outputview raw output of R engine
Computing time2 seconds
R Server'Gwilym Jenkins' @ 72.249.127.135


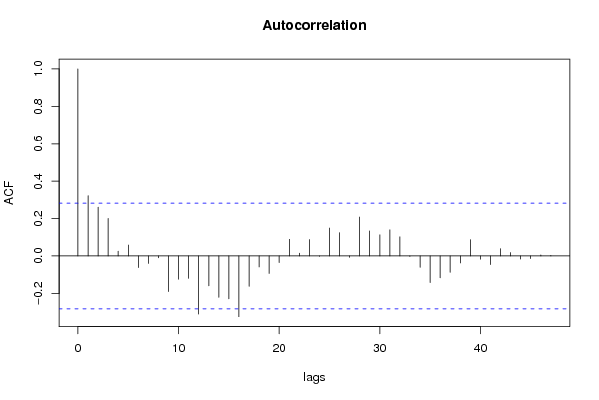
Autocorrelation Function
Time lag kACF(k)T-STATP-value
016.92820
10.3223342.23320.015117
20.2609941.80820.03842
30.2009561.39230.08513
40.025460.17640.430364
50.0583750.40440.343845
6-0.062043-0.42980.665385
7-0.039967-0.27690.608476
8-0.009698-0.06720.526646
9-0.190406-1.31920.903314
10-0.124184-0.86040.803069
11-0.119167-0.82560.793445
12-0.310634-2.15210.981778
13-0.159154-1.10270.862162
14-0.221072-1.53160.933911
15-0.228875-1.58570.940312
16-0.324337-2.24710.985365
17-0.161959-1.12210.866296
18-0.058305-0.40390.655978
19-0.093001-0.64430.738786
20-0.035095-0.24310.595535
210.0893150.61880.269489
220.0151110.10470.458527
230.0881240.61050.272192
24-0.002054-0.01420.505649
250.1492261.03390.153189
260.124890.86530.1956
27-0.006862-0.04750.51886
280.2084221.4440.077618
290.1337490.92660.179374
300.1131690.78410.218429
310.1399080.96930.168625
320.1027940.71220.239901
33-0.002702-0.01870.507429
34-0.060789-0.42120.662241
35-0.142221-0.98530.8353
36-0.116598-0.80780.788409
37-0.087041-0.6030.725338
38-0.037245-0.2580.60126
390.0872480.60450.274188
40-0.017328-0.12010.54753
41-0.045752-0.3170.623682
420.039010.27030.394057
430.018440.12780.449438
44-0.016294-0.11290.544706
45-0.013519-0.09370.537116
460.0058650.04060.483879
470.0029120.02020.491993

\begin{tabular}{lllllllll}
\hline
Autocorrelation Function \tabularnewline
Time lag k & ACF(k) & T-STAT & P-value \tabularnewline
0 & 1 & 6.9282 & 0 \tabularnewline
1 & 0.322334 & 2.2332 & 0.015117 \tabularnewline
2 & 0.260994 & 1.8082 & 0.03842 \tabularnewline
3 & 0.200956 & 1.3923 & 0.08513 \tabularnewline
4 & 0.02546 & 0.1764 & 0.430364 \tabularnewline
5 & 0.058375 & 0.4044 & 0.343845 \tabularnewline
6 & -0.062043 & -0.4298 & 0.665385 \tabularnewline
7 & -0.039967 & -0.2769 & 0.608476 \tabularnewline
8 & -0.009698 & -0.0672 & 0.526646 \tabularnewline
9 & -0.190406 & -1.3192 & 0.903314 \tabularnewline
10 & -0.124184 & -0.8604 & 0.803069 \tabularnewline
11 & -0.119167 & -0.8256 & 0.793445 \tabularnewline
12 & -0.310634 & -2.1521 & 0.981778 \tabularnewline
13 & -0.159154 & -1.1027 & 0.862162 \tabularnewline
14 & -0.221072 & -1.5316 & 0.933911 \tabularnewline
15 & -0.228875 & -1.5857 & 0.940312 \tabularnewline
16 & -0.324337 & -2.2471 & 0.985365 \tabularnewline
17 & -0.161959 & -1.1221 & 0.866296 \tabularnewline
18 & -0.058305 & -0.4039 & 0.655978 \tabularnewline
19 & -0.093001 & -0.6443 & 0.738786 \tabularnewline
20 & -0.035095 & -0.2431 & 0.595535 \tabularnewline
21 & 0.089315 & 0.6188 & 0.269489 \tabularnewline
22 & 0.015111 & 0.1047 & 0.458527 \tabularnewline
23 & 0.088124 & 0.6105 & 0.272192 \tabularnewline
24 & -0.002054 & -0.0142 & 0.505649 \tabularnewline
25 & 0.149226 & 1.0339 & 0.153189 \tabularnewline
26 & 0.12489 & 0.8653 & 0.1956 \tabularnewline
27 & -0.006862 & -0.0475 & 0.51886 \tabularnewline
28 & 0.208422 & 1.444 & 0.077618 \tabularnewline
29 & 0.133749 & 0.9266 & 0.179374 \tabularnewline
30 & 0.113169 & 0.7841 & 0.218429 \tabularnewline
31 & 0.139908 & 0.9693 & 0.168625 \tabularnewline
32 & 0.102794 & 0.7122 & 0.239901 \tabularnewline
33 & -0.002702 & -0.0187 & 0.507429 \tabularnewline
34 & -0.060789 & -0.4212 & 0.662241 \tabularnewline
35 & -0.142221 & -0.9853 & 0.8353 \tabularnewline
36 & -0.116598 & -0.8078 & 0.788409 \tabularnewline
37 & -0.087041 & -0.603 & 0.725338 \tabularnewline
38 & -0.037245 & -0.258 & 0.60126 \tabularnewline
39 & 0.087248 & 0.6045 & 0.274188 \tabularnewline
40 & -0.017328 & -0.1201 & 0.54753 \tabularnewline
41 & -0.045752 & -0.317 & 0.623682 \tabularnewline
42 & 0.03901 & 0.2703 & 0.394057 \tabularnewline
43 & 0.01844 & 0.1278 & 0.449438 \tabularnewline
44 & -0.016294 & -0.1129 & 0.544706 \tabularnewline
45 & -0.013519 & -0.0937 & 0.537116 \tabularnewline
46 & 0.005865 & 0.0406 & 0.483879 \tabularnewline
47 & 0.002912 & 0.0202 & 0.491993 \tabularnewline
\hline
\end{tabular}
%Source: https://freestatistics.org/blog/index.php?pk=6824&T=1

[TABLE]
[ROW][C]Autocorrelation Function[/C][/ROW]
[ROW][C]Time lag k[/C][C]ACF(k)[/C][C]T-STAT[/C][C]P-value[/C][/ROW]
[ROW][C]0[/C][C]1[/C][C]6.9282[/C][C]0[/C][/ROW]
[ROW][C]1[/C][C]0.322334[/C][C]2.2332[/C][C]0.015117[/C][/ROW]
[ROW][C]2[/C][C]0.260994[/C][C]1.8082[/C][C]0.03842[/C][/ROW]
[ROW][C]3[/C][C]0.200956[/C][C]1.3923[/C][C]0.08513[/C][/ROW]
[ROW][C]4[/C][C]0.02546[/C][C]0.1764[/C][C]0.430364[/C][/ROW]
[ROW][C]5[/C][C]0.058375[/C][C]0.4044[/C][C]0.343845[/C][/ROW]
[ROW][C]6[/C][C]-0.062043[/C][C]-0.4298[/C][C]0.665385[/C][/ROW]
[ROW][C]7[/C][C]-0.039967[/C][C]-0.2769[/C][C]0.608476[/C][/ROW]
[ROW][C]8[/C][C]-0.009698[/C][C]-0.0672[/C][C]0.526646[/C][/ROW]
[ROW][C]9[/C][C]-0.190406[/C][C]-1.3192[/C][C]0.903314[/C][/ROW]
[ROW][C]10[/C][C]-0.124184[/C][C]-0.8604[/C][C]0.803069[/C][/ROW]
[ROW][C]11[/C][C]-0.119167[/C][C]-0.8256[/C][C]0.793445[/C][/ROW]
[ROW][C]12[/C][C]-0.310634[/C][C]-2.1521[/C][C]0.981778[/C][/ROW]
[ROW][C]13[/C][C]-0.159154[/C][C]-1.1027[/C][C]0.862162[/C][/ROW]
[ROW][C]14[/C][C]-0.221072[/C][C]-1.5316[/C][C]0.933911[/C][/ROW]
[ROW][C]15[/C][C]-0.228875[/C][C]-1.5857[/C][C]0.940312[/C][/ROW]
[ROW][C]16[/C][C]-0.324337[/C][C]-2.2471[/C][C]0.985365[/C][/ROW]
[ROW][C]17[/C][C]-0.161959[/C][C]-1.1221[/C][C]0.866296[/C][/ROW]
[ROW][C]18[/C][C]-0.058305[/C][C]-0.4039[/C][C]0.655978[/C][/ROW]
[ROW][C]19[/C][C]-0.093001[/C][C]-0.6443[/C][C]0.738786[/C][/ROW]
[ROW][C]20[/C][C]-0.035095[/C][C]-0.2431[/C][C]0.595535[/C][/ROW]
[ROW][C]21[/C][C]0.089315[/C][C]0.6188[/C][C]0.269489[/C][/ROW]
[ROW][C]22[/C][C]0.015111[/C][C]0.1047[/C][C]0.458527[/C][/ROW]
[ROW][C]23[/C][C]0.088124[/C][C]0.6105[/C][C]0.272192[/C][/ROW]
[ROW][C]24[/C][C]-0.002054[/C][C]-0.0142[/C][C]0.505649[/C][/ROW]
[ROW][C]25[/C][C]0.149226[/C][C]1.0339[/C][C]0.153189[/C][/ROW]
[ROW][C]26[/C][C]0.12489[/C][C]0.8653[/C][C]0.1956[/C][/ROW]
[ROW][C]27[/C][C]-0.006862[/C][C]-0.0475[/C][C]0.51886[/C][/ROW]
[ROW][C]28[/C][C]0.208422[/C][C]1.444[/C][C]0.077618[/C][/ROW]
[ROW][C]29[/C][C]0.133749[/C][C]0.9266[/C][C]0.179374[/C][/ROW]
[ROW][C]30[/C][C]0.113169[/C][C]0.7841[/C][C]0.218429[/C][/ROW]
[ROW][C]31[/C][C]0.139908[/C][C]0.9693[/C][C]0.168625[/C][/ROW]
[ROW][C]32[/C][C]0.102794[/C][C]0.7122[/C][C]0.239901[/C][/ROW]
[ROW][C]33[/C][C]-0.002702[/C][C]-0.0187[/C][C]0.507429[/C][/ROW]
[ROW][C]34[/C][C]-0.060789[/C][C]-0.4212[/C][C]0.662241[/C][/ROW]
[ROW][C]35[/C][C]-0.142221[/C][C]-0.9853[/C][C]0.8353[/C][/ROW]
[ROW][C]36[/C][C]-0.116598[/C][C]-0.8078[/C][C]0.788409[/C][/ROW]
[ROW][C]37[/C][C]-0.087041[/C][C]-0.603[/C][C]0.725338[/C][/ROW]
[ROW][C]38[/C][C]-0.037245[/C][C]-0.258[/C][C]0.60126[/C][/ROW]
[ROW][C]39[/C][C]0.087248[/C][C]0.6045[/C][C]0.274188[/C][/ROW]
[ROW][C]40[/C][C]-0.017328[/C][C]-0.1201[/C][C]0.54753[/C][/ROW]
[ROW][C]41[/C][C]-0.045752[/C][C]-0.317[/C][C]0.623682[/C][/ROW]
[ROW][C]42[/C][C]0.03901[/C][C]0.2703[/C][C]0.394057[/C][/ROW]
[ROW][C]43[/C][C]0.01844[/C][C]0.1278[/C][C]0.449438[/C][/ROW]
[ROW][C]44[/C][C]-0.016294[/C][C]-0.1129[/C][C]0.544706[/C][/ROW]
[ROW][C]45[/C][C]-0.013519[/C][C]-0.0937[/C][C]0.537116[/C][/ROW]
[ROW][C]46[/C][C]0.005865[/C][C]0.0406[/C][C]0.483879[/C][/ROW]
[ROW][C]47[/C][C]0.002912[/C][C]0.0202[/C][C]0.491993[/C][/ROW]
[/TABLE]
Source: https://freestatistics.org/blog/index.php?pk=6824&T=1

Globally Unique Identifier (entire table): ba.freestatistics.org/blog/index.php?pk=6824&T=1

As an alternative you can also use a QR Code:  

The GUIDs for individual cells are displayed in the table below:

Autocorrelation Function
Time lag kACF(k)T-STATP-value
016.92820
10.3223342.23320.015117
20.2609941.80820.03842
30.2009561.39230.08513
40.025460.17640.430364
50.0583750.40440.343845
6-0.062043-0.42980.665385
7-0.039967-0.27690.608476
8-0.009698-0.06720.526646
9-0.190406-1.31920.903314
10-0.124184-0.86040.803069
11-0.119167-0.82560.793445
12-0.310634-2.15210.981778
13-0.159154-1.10270.862162
14-0.221072-1.53160.933911
15-0.228875-1.58570.940312
16-0.324337-2.24710.985365
17-0.161959-1.12210.866296
18-0.058305-0.40390.655978
19-0.093001-0.64430.738786
20-0.035095-0.24310.595535
210.0893150.61880.269489
220.0151110.10470.458527
230.0881240.61050.272192
24-0.002054-0.01420.505649
250.1492261.03390.153189
260.124890.86530.1956
27-0.006862-0.04750.51886
280.2084221.4440.077618
290.1337490.92660.179374
300.1131690.78410.218429
310.1399080.96930.168625
320.1027940.71220.239901
33-0.002702-0.01870.507429
34-0.060789-0.42120.662241
35-0.142221-0.98530.8353
36-0.116598-0.80780.788409
37-0.087041-0.6030.725338
38-0.037245-0.2580.60126
390.0872480.60450.274188
40-0.017328-0.12010.54753
41-0.045752-0.3170.623682
420.039010.27030.394057
430.018440.12780.449438
44-0.016294-0.11290.544706
45-0.013519-0.09370.537116
460.0058650.04060.483879
470.0029120.02020.491993


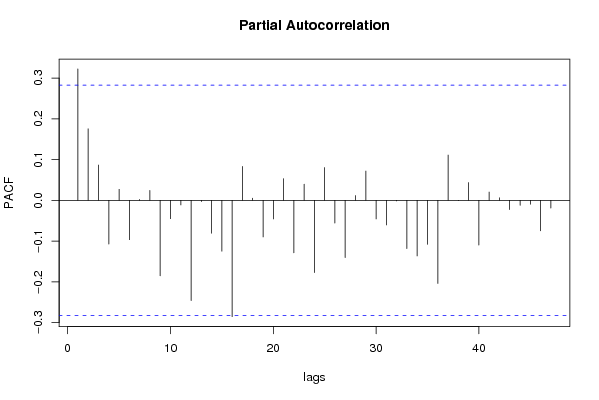
Partial Autocorrelation Function
Time lag kPACF(k)T-STATP-value
00.3223342.23320.015117
10.175311.21460.115234
20.0864290.59880.276061
3-0.107337-0.74370.769644
40.0268460.1860.426616
5-0.096634-0.66950.746809
60.0020240.0140.494435
70.0240740.16680.434119
8-0.185276-1.28360.897283
9-0.04527-0.31360.622422
10-0.011382-0.07890.531262
11-0.246142-1.70530.9527
12-0.003123-0.02160.508587
13-0.080749-0.55940.710771
14-0.125015-0.86610.804636
15-0.285555-1.97840.97318
160.0830180.57520.283934
170.0051550.03570.485829
18-0.089833-0.62240.731682
19-0.045691-0.31660.623523
200.0530340.36740.357457
21-0.128856-0.89270.811775
220.0393910.27290.393047
23-0.177272-1.22820.887316
240.0803840.55690.290087
25-0.055917-0.38740.649916
26-0.140478-0.97330.832349
270.0116880.0810.467899
280.071780.49730.310621
29-0.045882-0.31790.624023
30-0.060562-0.41960.66167
31-0.001482-0.01030.504075
32-0.118451-0.82070.792049
33-0.136604-0.94640.825662
34-0.108075-0.74880.771174
35-0.204191-1.41470.918191
360.1110330.76930.222754
37-0.000707-0.00490.501945
380.0435750.30190.382018
39-0.109812-0.76080.77475
400.0202240.14010.444577
410.006060.0420.483343
42-0.02262-0.15670.561937
43-0.012466-0.08640.534233
44-0.009563-0.06630.526276
45-0.074782-0.51810.696618
46-0.019127-0.13250.552435
47NANANA

\begin{tabular}{lllllllll}
\hline
Partial Autocorrelation Function \tabularnewline
Time lag k & PACF(k) & T-STAT & P-value \tabularnewline
0 & 0.322334 & 2.2332 & 0.015117 \tabularnewline
1 & 0.17531 & 1.2146 & 0.115234 \tabularnewline
2 & 0.086429 & 0.5988 & 0.276061 \tabularnewline
3 & -0.107337 & -0.7437 & 0.769644 \tabularnewline
4 & 0.026846 & 0.186 & 0.426616 \tabularnewline
5 & -0.096634 & -0.6695 & 0.746809 \tabularnewline
6 & 0.002024 & 0.014 & 0.494435 \tabularnewline
7 & 0.024074 & 0.1668 & 0.434119 \tabularnewline
8 & -0.185276 & -1.2836 & 0.897283 \tabularnewline
9 & -0.04527 & -0.3136 & 0.622422 \tabularnewline
10 & -0.011382 & -0.0789 & 0.531262 \tabularnewline
11 & -0.246142 & -1.7053 & 0.9527 \tabularnewline
12 & -0.003123 & -0.0216 & 0.508587 \tabularnewline
13 & -0.080749 & -0.5594 & 0.710771 \tabularnewline
14 & -0.125015 & -0.8661 & 0.804636 \tabularnewline
15 & -0.285555 & -1.9784 & 0.97318 \tabularnewline
16 & 0.083018 & 0.5752 & 0.283934 \tabularnewline
17 & 0.005155 & 0.0357 & 0.485829 \tabularnewline
18 & -0.089833 & -0.6224 & 0.731682 \tabularnewline
19 & -0.045691 & -0.3166 & 0.623523 \tabularnewline
20 & 0.053034 & 0.3674 & 0.357457 \tabularnewline
21 & -0.128856 & -0.8927 & 0.811775 \tabularnewline
22 & 0.039391 & 0.2729 & 0.393047 \tabularnewline
23 & -0.177272 & -1.2282 & 0.887316 \tabularnewline
24 & 0.080384 & 0.5569 & 0.290087 \tabularnewline
25 & -0.055917 & -0.3874 & 0.649916 \tabularnewline
26 & -0.140478 & -0.9733 & 0.832349 \tabularnewline
27 & 0.011688 & 0.081 & 0.467899 \tabularnewline
28 & 0.07178 & 0.4973 & 0.310621 \tabularnewline
29 & -0.045882 & -0.3179 & 0.624023 \tabularnewline
30 & -0.060562 & -0.4196 & 0.66167 \tabularnewline
31 & -0.001482 & -0.0103 & 0.504075 \tabularnewline
32 & -0.118451 & -0.8207 & 0.792049 \tabularnewline
33 & -0.136604 & -0.9464 & 0.825662 \tabularnewline
34 & -0.108075 & -0.7488 & 0.771174 \tabularnewline
35 & -0.204191 & -1.4147 & 0.918191 \tabularnewline
36 & 0.111033 & 0.7693 & 0.222754 \tabularnewline
37 & -0.000707 & -0.0049 & 0.501945 \tabularnewline
38 & 0.043575 & 0.3019 & 0.382018 \tabularnewline
39 & -0.109812 & -0.7608 & 0.77475 \tabularnewline
40 & 0.020224 & 0.1401 & 0.444577 \tabularnewline
41 & 0.00606 & 0.042 & 0.483343 \tabularnewline
42 & -0.02262 & -0.1567 & 0.561937 \tabularnewline
43 & -0.012466 & -0.0864 & 0.534233 \tabularnewline
44 & -0.009563 & -0.0663 & 0.526276 \tabularnewline
45 & -0.074782 & -0.5181 & 0.696618 \tabularnewline
46 & -0.019127 & -0.1325 & 0.552435 \tabularnewline
47 & NA & NA & NA \tabularnewline
\hline
\end{tabular}
%Source: https://freestatistics.org/blog/index.php?pk=6824&T=2

[TABLE]
[ROW][C]Partial Autocorrelation Function[/C][/ROW]
[ROW][C]Time lag k[/C][C]PACF(k)[/C][C]T-STAT[/C][C]P-value[/C][/ROW]
[ROW][C]0[/C][C]0.322334[/C][C]2.2332[/C][C]0.015117[/C][/ROW]
[ROW][C]1[/C][C]0.17531[/C][C]1.2146[/C][C]0.115234[/C][/ROW]
[ROW][C]2[/C][C]0.086429[/C][C]0.5988[/C][C]0.276061[/C][/ROW]
[ROW][C]3[/C][C]-0.107337[/C][C]-0.7437[/C][C]0.769644[/C][/ROW]
[ROW][C]4[/C][C]0.026846[/C][C]0.186[/C][C]0.426616[/C][/ROW]
[ROW][C]5[/C][C]-0.096634[/C][C]-0.6695[/C][C]0.746809[/C][/ROW]
[ROW][C]6[/C][C]0.002024[/C][C]0.014[/C][C]0.494435[/C][/ROW]
[ROW][C]7[/C][C]0.024074[/C][C]0.1668[/C][C]0.434119[/C][/ROW]
[ROW][C]8[/C][C]-0.185276[/C][C]-1.2836[/C][C]0.897283[/C][/ROW]
[ROW][C]9[/C][C]-0.04527[/C][C]-0.3136[/C][C]0.622422[/C][/ROW]
[ROW][C]10[/C][C]-0.011382[/C][C]-0.0789[/C][C]0.531262[/C][/ROW]
[ROW][C]11[/C][C]-0.246142[/C][C]-1.7053[/C][C]0.9527[/C][/ROW]
[ROW][C]12[/C][C]-0.003123[/C][C]-0.0216[/C][C]0.508587[/C][/ROW]
[ROW][C]13[/C][C]-0.080749[/C][C]-0.5594[/C][C]0.710771[/C][/ROW]
[ROW][C]14[/C][C]-0.125015[/C][C]-0.8661[/C][C]0.804636[/C][/ROW]
[ROW][C]15[/C][C]-0.285555[/C][C]-1.9784[/C][C]0.97318[/C][/ROW]
[ROW][C]16[/C][C]0.083018[/C][C]0.5752[/C][C]0.283934[/C][/ROW]
[ROW][C]17[/C][C]0.005155[/C][C]0.0357[/C][C]0.485829[/C][/ROW]
[ROW][C]18[/C][C]-0.089833[/C][C]-0.6224[/C][C]0.731682[/C][/ROW]
[ROW][C]19[/C][C]-0.045691[/C][C]-0.3166[/C][C]0.623523[/C][/ROW]
[ROW][C]20[/C][C]0.053034[/C][C]0.3674[/C][C]0.357457[/C][/ROW]
[ROW][C]21[/C][C]-0.128856[/C][C]-0.8927[/C][C]0.811775[/C][/ROW]
[ROW][C]22[/C][C]0.039391[/C][C]0.2729[/C][C]0.393047[/C][/ROW]
[ROW][C]23[/C][C]-0.177272[/C][C]-1.2282[/C][C]0.887316[/C][/ROW]
[ROW][C]24[/C][C]0.080384[/C][C]0.5569[/C][C]0.290087[/C][/ROW]
[ROW][C]25[/C][C]-0.055917[/C][C]-0.3874[/C][C]0.649916[/C][/ROW]
[ROW][C]26[/C][C]-0.140478[/C][C]-0.9733[/C][C]0.832349[/C][/ROW]
[ROW][C]27[/C][C]0.011688[/C][C]0.081[/C][C]0.467899[/C][/ROW]
[ROW][C]28[/C][C]0.07178[/C][C]0.4973[/C][C]0.310621[/C][/ROW]
[ROW][C]29[/C][C]-0.045882[/C][C]-0.3179[/C][C]0.624023[/C][/ROW]
[ROW][C]30[/C][C]-0.060562[/C][C]-0.4196[/C][C]0.66167[/C][/ROW]
[ROW][C]31[/C][C]-0.001482[/C][C]-0.0103[/C][C]0.504075[/C][/ROW]
[ROW][C]32[/C][C]-0.118451[/C][C]-0.8207[/C][C]0.792049[/C][/ROW]
[ROW][C]33[/C][C]-0.136604[/C][C]-0.9464[/C][C]0.825662[/C][/ROW]
[ROW][C]34[/C][C]-0.108075[/C][C]-0.7488[/C][C]0.771174[/C][/ROW]
[ROW][C]35[/C][C]-0.204191[/C][C]-1.4147[/C][C]0.918191[/C][/ROW]
[ROW][C]36[/C][C]0.111033[/C][C]0.7693[/C][C]0.222754[/C][/ROW]
[ROW][C]37[/C][C]-0.000707[/C][C]-0.0049[/C][C]0.501945[/C][/ROW]
[ROW][C]38[/C][C]0.043575[/C][C]0.3019[/C][C]0.382018[/C][/ROW]
[ROW][C]39[/C][C]-0.109812[/C][C]-0.7608[/C][C]0.77475[/C][/ROW]
[ROW][C]40[/C][C]0.020224[/C][C]0.1401[/C][C]0.444577[/C][/ROW]
[ROW][C]41[/C][C]0.00606[/C][C]0.042[/C][C]0.483343[/C][/ROW]
[ROW][C]42[/C][C]-0.02262[/C][C]-0.1567[/C][C]0.561937[/C][/ROW]
[ROW][C]43[/C][C]-0.012466[/C][C]-0.0864[/C][C]0.534233[/C][/ROW]
[ROW][C]44[/C][C]-0.009563[/C][C]-0.0663[/C][C]0.526276[/C][/ROW]
[ROW][C]45[/C][C]-0.074782[/C][C]-0.5181[/C][C]0.696618[/C][/ROW]
[ROW][C]46[/C][C]-0.019127[/C][C]-0.1325[/C][C]0.552435[/C][/ROW]
[ROW][C]47[/C][C]NA[/C][C]NA[/C][C]NA[/C][/ROW]
[/TABLE]
Source: https://freestatistics.org/blog/index.php?pk=6824&T=2

Globally Unique Identifier (entire table): ba.freestatistics.org/blog/index.php?pk=6824&T=2

As an alternative you can also use a QR Code:  

The GUIDs for individual cells are displayed in the table below:

Partial Autocorrelation Function
Time lag kPACF(k)T-STATP-value
00.3223342.23320.015117
10.175311.21460.115234
20.0864290.59880.276061
3-0.107337-0.74370.769644
40.0268460.1860.426616
5-0.096634-0.66950.746809
60.0020240.0140.494435
70.0240740.16680.434119
8-0.185276-1.28360.897283
9-0.04527-0.31360.622422
10-0.011382-0.07890.531262
11-0.246142-1.70530.9527
12-0.003123-0.02160.508587
13-0.080749-0.55940.710771
14-0.125015-0.86610.804636
15-0.285555-1.97840.97318
160.0830180.57520.283934
170.0051550.03570.485829
18-0.089833-0.62240.731682
19-0.045691-0.31660.623523
200.0530340.36740.357457
21-0.128856-0.89270.811775
220.0393910.27290.393047
23-0.177272-1.22820.887316
240.0803840.55690.290087
25-0.055917-0.38740.649916
26-0.140478-0.97330.832349
270.0116880.0810.467899
280.071780.49730.310621
29-0.045882-0.31790.624023
30-0.060562-0.41960.66167
31-0.001482-0.01030.504075
32-0.118451-0.82070.792049
33-0.136604-0.94640.825662
34-0.108075-0.74880.771174
35-0.204191-1.41470.918191
360.1110330.76930.222754
37-0.000707-0.00490.501945
380.0435750.30190.382018
39-0.109812-0.76080.77475
400.0202240.14010.444577
410.006060.0420.483343
42-0.02262-0.15670.561937
43-0.012466-0.08640.534233
44-0.009563-0.06630.526276
45-0.074782-0.51810.696618
46-0.019127-0.13250.552435
47NANANA


Parameters (Session):
par1 = 48 ; par2 = 1 ; par3 = 0 ; par4 = 1 ; par5 = 12 ;
Parameters (R input):
par1 = 48 ; par2 = 1 ; par3 = 0 ; par4 = 1 ; par5 = 12 ;
R code (references can be found in the software module):
if (par1 == 'Default') {
par1 = 10*log10(length(x))
} else {
par1 <- as.numeric(par1)
}
par2 <- as.numeric(par2)
par3 <- as.numeric(par3)
par4 <- as.numeric(par4)
par5 <- as.numeric(par5)
if (par2 == 0) {
x <- log(x)
} else {
x <- (x ^ par2 - 1) / par2
}
if (par3 > 0) x <- diff(x,lag=1,difference=par3)
if (par4 > 0) x <- diff(x,lag=par5,difference=par4)
bitmap(file='pic1.png')
racf <- acf(x,par1,main='Autocorrelation',xlab='lags',ylab='ACF')
dev.off()
bitmap(file='pic2.png')
rpacf <- pacf(x,par1,main='Partial Autocorrelation',xlab='lags',ylab='PACF')
dev.off()
(myacf <- c(racf$acf))
(mypacf <- c(rpacf$acf))
lengthx <- length(x)
sqrtn <- sqrt(lengthx)
load(file='createtable')
a<-table.start()
a<-table.row.start(a)
a<-table.element(a,'Autocorrelation Function',4,TRUE)
a<-table.row.end(a)
a<-table.row.start(a)
a<-table.element(a,'Time lag k',header=TRUE)
a<-table.element(a,hyperlink('basics.htm','ACF(k)','click here for more information about the Autocorrelation Function'),header=TRUE)
a<-table.element(a,'T-STAT',header=TRUE)
a<-table.element(a,'P-value',header=TRUE)
a<-table.row.end(a)
for (i in 1:par1) {
a<-table.row.start(a)
a<-table.element(a,i-1,header=TRUE)
a<-table.element(a,round(myacf[i],6))
mytstat <- myacf[i]*sqrtn
a<-table.element(a,round(mytstat,4))
a<-table.element(a,round(1-pt(mytstat,lengthx),6))
a<-table.row.end(a)
}
a<-table.end(a)
table.save(a,file='mytable.tab')
a<-table.start()
a<-table.row.start(a)
a<-table.element(a,'Partial Autocorrelation Function',4,TRUE)
a<-table.row.end(a)
a<-table.row.start(a)
a<-table.element(a,'Time lag k',header=TRUE)
a<-table.element(a,hyperlink('basics.htm','PACF(k)','click here for more information about the Partial Autocorrelation Function'),header=TRUE)
a<-table.element(a,'T-STAT',header=TRUE)
a<-table.element(a,'P-value',header=TRUE)
a<-table.row.end(a)
for (i in 1:par1) {
a<-table.row.start(a)
a<-table.element(a,i-1,header=TRUE)
a<-table.element(a,round(mypacf[i],6))
mytstat <- mypacf[i]*sqrtn
a<-table.element(a,round(mytstat,4))
a<-table.element(a,round(1-pt(mytstat,lengthx),6))
a<-table.row.end(a)
}
a<-table.end(a)
table.save(a,file='mytable1.tab')