Free Statistics

of Irreproducible Research!

Author's title

Author*Unverified author*
R Software Modulerwasp_centraltendency.wasp
Title produced by softwareCentral Tendency
Date of computationFri, 10 Oct 2014 10:19:17 +0100
Cite this page as followsStatistical Computations at FreeStatistics.org, Office for Research Development and Education, URL https://freestatistics.org/blog/index.php?v=date/2014/Oct/10/t141293282500a8fpajcjz3ela.htm/, Retrieved Thu, 31 Oct 2024 23:46:21 +0000
Statistical Computations at FreeStatistics.org, Office for Research Development and Education, URL https://freestatistics.org/blog/index.php?pk=240242, Retrieved Thu, 31 Oct 2024 23:46:21 +0000
QR Codes:

Original text written by user:
IsPrivate?No (this computation is public)
User-defined keywords
Estimated Impact162
Family? (F = Feedback message, R = changed R code, M = changed R Module, P = changed Parameters, D = changed Data)
-     [Univariate Data Series] [] [2014-09-17 11:31:44] [94f95ef037a5ad1df99581667eb46a7c]
- R P   [Univariate Data Series] [] [2014-09-18 13:29:36] [94f95ef037a5ad1df99581667eb46a7c]
- RMP       [Central Tendency] [] [2014-10-10 09:19:17] [1b1e43390f81e2233427cd22b8161931] [Current]
Feedback Forum

Post a new message
Dataseries X:
122.5
123.1
123.1
124.4
124.4
124.6
124.5
125.9
125.9
125.9
125.9
125.9
125.9
128.2
129.3
129.3
129.3
129.3
129.4
129.6
129.6
129.6
130
130
129.4
130.2
130.2
130.2
130.3
130.3
130.3
130.7
130.7
130.7
130.9
130.9
130.9
131.2
131.8
131.8
131.8
131.9
132
132.3
132.3
132.4
132.8
132.8
132.8
133
133.5
133.5
134.4
134.4
134.5
134.6
135.6
135.6
135.6
135.6
135.6
135.7
136.2
136.2
136.2
136.2
136.2
136.3
136.3
136.3
136.3
136.3
136.3


Summary of computational transaction
Raw Inputview raw input (R code)
Raw Outputview raw output of R engine
Computing time1 seconds
R Server'Gertrude Mary Cox' @ cox.wessa.net

\begin{tabular}{lllllllll}
\hline
Summary of computational transaction \tabularnewline
Raw Input & view raw input (R code)  \tabularnewline
Raw Output & view raw output of R engine  \tabularnewline
Computing time & 1 seconds \tabularnewline
R Server & 'Gertrude Mary Cox' @ cox.wessa.net \tabularnewline
\hline
\end{tabular}
%Source: https://freestatistics.org/blog/index.php?pk=240242&T=0

[TABLE]
[ROW][C]Summary of computational transaction[/C][/ROW]
[ROW][C]Raw Input[/C][C]view raw input (R code) [/C][/ROW]
[ROW][C]Raw Output[/C][C]view raw output of R engine [/C][/ROW]
[ROW][C]Computing time[/C][C]1 seconds[/C][/ROW]
[ROW][C]R Server[/C][C]'Gertrude Mary Cox' @ cox.wessa.net[/C][/ROW]
[/TABLE]
Source: https://freestatistics.org/blog/index.php?pk=240242&T=0

Globally Unique Identifier (entire table): ba.freestatistics.org/blog/index.php?pk=240242&T=0

As an alternative you can also use a QR Code:  

The GUIDs for individual cells are displayed in the table below:

Summary of computational transaction
Raw Inputview raw input (R code)
Raw Outputview raw output of R engine
Computing time1 seconds
R Server'Gertrude Mary Cox' @ cox.wessa.net


Central Tendency - Ungrouped Data
MeasureValueS.E.Value/S.E.
Arithmetic Mean131.20.451599558612961290.522870312288
Geometric Mean131.143518681954
Harmonic Mean131.086517593898
Quadratic Mean131.255947810438
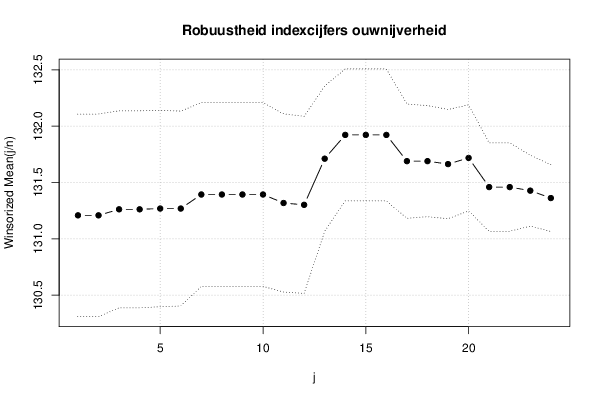
Winsorized Mean ( 1 / 24 )131.2082191780820.449470149017602291.917537716045
Winsorized Mean ( 2 / 24 )131.2082191780820.449470149017602291.917537716045
Winsorized Mean ( 3 / 24 )131.2616438356160.436938942863489300.411867560695
Winsorized Mean ( 4 / 24 )131.2616438356160.436938942863489300.411867560695
Winsorized Mean ( 5 / 24 )131.2684931506850.435452653413693301.452964223819
Winsorized Mean ( 6 / 24 )131.2684931506850.432374583536444303.599004541442
Winsorized Mean ( 7 / 24 )131.3931506849310.407298001437958322.597091616091
Winsorized Mean ( 8 / 24 )131.3931506849320.407298001437958322.597091616091
Winsorized Mean ( 9 / 24 )131.3931506849310.407298001437958322.597091616091
Winsorized Mean ( 10 / 24 )131.3931506849320.407298001437958322.597091616091
Winsorized Mean ( 11 / 24 )131.3178082191780.395317640360108332.183021480034
Winsorized Mean ( 12 / 24 )131.3013698630140.392802894550942334.267826649087
Winsorized Mean ( 13 / 24 )131.710958904110.321860563581537409.217449439851
Winsorized Mean ( 14 / 24 )131.9219178082190.292617475501450.834037107153
Winsorized Mean ( 15 / 24 )131.9219178082190.292617475501450.834037107153
Winsorized Mean ( 16 / 24 )131.9219178082190.292617475501450.834037107153
Winsorized Mean ( 17 / 24 )131.689041095890.253600868435453519.276774990257
Winsorized Mean ( 18 / 24 )131.689041095890.246478714366169534.281596828896
Winsorized Mean ( 19 / 24 )131.663013698630.242376197032227543.217590302913
Winsorized Mean ( 20 / 24 )131.7178082191780.235398092698828559.553421648576
Winsorized Mean ( 21 / 24 )131.4589041095890.196030194615675670.605384886342
Winsorized Mean ( 22 / 24 )131.4589041095890.196030194615675670.605384886342
Winsorized Mean ( 23 / 24 )131.4273972602740.157381303561454835.089011757706
Winsorized Mean ( 24 / 24 )131.3616438356160.148388478500517885.255008765108
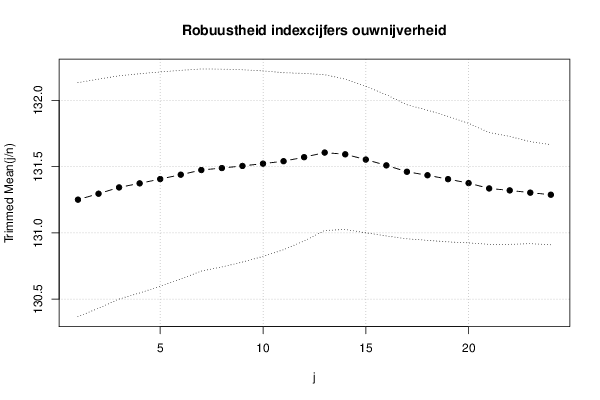
Trimmed Mean ( 1 / 24 )131.2507042253520.441790181357405297.088323289763
Trimmed Mean ( 2 / 24 )131.2956521739130.432574101012814303.521759315923
Trimmed Mean ( 3 / 24 )131.343283582090.421495173493293311.61278192947
Trimmed Mean ( 4 / 24 )131.3738461538460.413929788517914317.381956549282
Trimmed Mean ( 5 / 24 )131.4063492063490.404720438023308324.684243395638
Trimmed Mean ( 6 / 24 )131.4393442622950.39397288947618333.625352843579
Trimmed Mean ( 7 / 24 )131.4745762711860.381701512359252344.443425069389
Trimmed Mean ( 8 / 24 )131.4894736842110.37344233055643352.101149026922
Trimmed Mean ( 9 / 24 )131.5054545454550.363164340106103362.110042266357
Trimmed Mean ( 10 / 24 )131.5226415094340.350322695003477375.432832029706
Trimmed Mean ( 11 / 24 )131.5411764705880.334150095082777393.658952687122
Trimmed Mean ( 12 / 24 )131.5714285714290.316469684526796415.74733696266
Trimmed Mean ( 13 / 24 )131.6063829787230.294183582411076447.361412557768
Trimmed Mean ( 14 / 24 )131.5933333333330.283865809811252463.575847407732
Trimmed Mean ( 15 / 24 )131.5534883720930.276594318093982475.618911041381
Trimmed Mean ( 16 / 24 )131.5097560975610.266682529768115493.132250589908
Trimmed Mean ( 17 / 24 )131.4615384615380.253094622190169519.416561774124
Trimmed Mean ( 18 / 24 )131.4351351351350.245659503856616535.029718255273
Trimmed Mean ( 19 / 24 )131.4057142857140.236960545492384554.546808679327
Trimmed Mean ( 20 / 24 )131.3757575757580.225715625551264582.041040600974
Trimmed Mean ( 21 / 24 )131.3354838709680.211118291618336622.094290666195
Trimmed Mean ( 22 / 24 )131.3206896551720.203865315238424644.154153940264
Trimmed Mean ( 23 / 24 )131.3037037037040.192559716676807681.885629921674
Trimmed Mean ( 24 / 24 )131.2880.189060836769545694.421976773716
Median130.9
Midrange129.4
Midmean - Weighted Average at Xnp131.35
Midmean - Weighted Average at X(n+1)p131.435135135135
Midmean - Empirical Distribution Function131.435135135135
Midmean - Empirical Distribution Function - Averaging131.435135135135
Midmean - Empirical Distribution Function - Interpolation131.435135135135
Midmean - Closest Observation131.226829268293
Midmean - True Basic - Statistics Graphics Toolkit131.435135135135
Midmean - MS Excel (old versions)131.435135135135
Number of observations73

\begin{tabular}{lllllllll}
\hline
Central Tendency - Ungrouped Data \tabularnewline
Measure & Value & S.E. & Value/S.E. \tabularnewline
Arithmetic Mean & 131.2 & 0.451599558612961 & 290.522870312288 \tabularnewline
Geometric Mean & 131.143518681954 &  &  \tabularnewline
Harmonic Mean & 131.086517593898 &  &  \tabularnewline
Quadratic Mean & 131.255947810438 &  &  \tabularnewline
Winsorized Mean ( 1 / 24 ) & 131.208219178082 & 0.449470149017602 & 291.917537716045 \tabularnewline
Winsorized Mean ( 2 / 24 ) & 131.208219178082 & 0.449470149017602 & 291.917537716045 \tabularnewline
Winsorized Mean ( 3 / 24 ) & 131.261643835616 & 0.436938942863489 & 300.411867560695 \tabularnewline
Winsorized Mean ( 4 / 24 ) & 131.261643835616 & 0.436938942863489 & 300.411867560695 \tabularnewline
Winsorized Mean ( 5 / 24 ) & 131.268493150685 & 0.435452653413693 & 301.452964223819 \tabularnewline
Winsorized Mean ( 6 / 24 ) & 131.268493150685 & 0.432374583536444 & 303.599004541442 \tabularnewline
Winsorized Mean ( 7 / 24 ) & 131.393150684931 & 0.407298001437958 & 322.597091616091 \tabularnewline
Winsorized Mean ( 8 / 24 ) & 131.393150684932 & 0.407298001437958 & 322.597091616091 \tabularnewline
Winsorized Mean ( 9 / 24 ) & 131.393150684931 & 0.407298001437958 & 322.597091616091 \tabularnewline
Winsorized Mean ( 10 / 24 ) & 131.393150684932 & 0.407298001437958 & 322.597091616091 \tabularnewline
Winsorized Mean ( 11 / 24 ) & 131.317808219178 & 0.395317640360108 & 332.183021480034 \tabularnewline
Winsorized Mean ( 12 / 24 ) & 131.301369863014 & 0.392802894550942 & 334.267826649087 \tabularnewline
Winsorized Mean ( 13 / 24 ) & 131.71095890411 & 0.321860563581537 & 409.217449439851 \tabularnewline
Winsorized Mean ( 14 / 24 ) & 131.921917808219 & 0.292617475501 & 450.834037107153 \tabularnewline
Winsorized Mean ( 15 / 24 ) & 131.921917808219 & 0.292617475501 & 450.834037107153 \tabularnewline
Winsorized Mean ( 16 / 24 ) & 131.921917808219 & 0.292617475501 & 450.834037107153 \tabularnewline
Winsorized Mean ( 17 / 24 ) & 131.68904109589 & 0.253600868435453 & 519.276774990257 \tabularnewline
Winsorized Mean ( 18 / 24 ) & 131.68904109589 & 0.246478714366169 & 534.281596828896 \tabularnewline
Winsorized Mean ( 19 / 24 ) & 131.66301369863 & 0.242376197032227 & 543.217590302913 \tabularnewline
Winsorized Mean ( 20 / 24 ) & 131.717808219178 & 0.235398092698828 & 559.553421648576 \tabularnewline
Winsorized Mean ( 21 / 24 ) & 131.458904109589 & 0.196030194615675 & 670.605384886342 \tabularnewline
Winsorized Mean ( 22 / 24 ) & 131.458904109589 & 0.196030194615675 & 670.605384886342 \tabularnewline
Winsorized Mean ( 23 / 24 ) & 131.427397260274 & 0.157381303561454 & 835.089011757706 \tabularnewline
Winsorized Mean ( 24 / 24 ) & 131.361643835616 & 0.148388478500517 & 885.255008765108 \tabularnewline
Trimmed Mean ( 1 / 24 ) & 131.250704225352 & 0.441790181357405 & 297.088323289763 \tabularnewline
Trimmed Mean ( 2 / 24 ) & 131.295652173913 & 0.432574101012814 & 303.521759315923 \tabularnewline
Trimmed Mean ( 3 / 24 ) & 131.34328358209 & 0.421495173493293 & 311.61278192947 \tabularnewline
Trimmed Mean ( 4 / 24 ) & 131.373846153846 & 0.413929788517914 & 317.381956549282 \tabularnewline
Trimmed Mean ( 5 / 24 ) & 131.406349206349 & 0.404720438023308 & 324.684243395638 \tabularnewline
Trimmed Mean ( 6 / 24 ) & 131.439344262295 & 0.39397288947618 & 333.625352843579 \tabularnewline
Trimmed Mean ( 7 / 24 ) & 131.474576271186 & 0.381701512359252 & 344.443425069389 \tabularnewline
Trimmed Mean ( 8 / 24 ) & 131.489473684211 & 0.37344233055643 & 352.101149026922 \tabularnewline
Trimmed Mean ( 9 / 24 ) & 131.505454545455 & 0.363164340106103 & 362.110042266357 \tabularnewline
Trimmed Mean ( 10 / 24 ) & 131.522641509434 & 0.350322695003477 & 375.432832029706 \tabularnewline
Trimmed Mean ( 11 / 24 ) & 131.541176470588 & 0.334150095082777 & 393.658952687122 \tabularnewline
Trimmed Mean ( 12 / 24 ) & 131.571428571429 & 0.316469684526796 & 415.74733696266 \tabularnewline
Trimmed Mean ( 13 / 24 ) & 131.606382978723 & 0.294183582411076 & 447.361412557768 \tabularnewline
Trimmed Mean ( 14 / 24 ) & 131.593333333333 & 0.283865809811252 & 463.575847407732 \tabularnewline
Trimmed Mean ( 15 / 24 ) & 131.553488372093 & 0.276594318093982 & 475.618911041381 \tabularnewline
Trimmed Mean ( 16 / 24 ) & 131.509756097561 & 0.266682529768115 & 493.132250589908 \tabularnewline
Trimmed Mean ( 17 / 24 ) & 131.461538461538 & 0.253094622190169 & 519.416561774124 \tabularnewline
Trimmed Mean ( 18 / 24 ) & 131.435135135135 & 0.245659503856616 & 535.029718255273 \tabularnewline
Trimmed Mean ( 19 / 24 ) & 131.405714285714 & 0.236960545492384 & 554.546808679327 \tabularnewline
Trimmed Mean ( 20 / 24 ) & 131.375757575758 & 0.225715625551264 & 582.041040600974 \tabularnewline
Trimmed Mean ( 21 / 24 ) & 131.335483870968 & 0.211118291618336 & 622.094290666195 \tabularnewline
Trimmed Mean ( 22 / 24 ) & 131.320689655172 & 0.203865315238424 & 644.154153940264 \tabularnewline
Trimmed Mean ( 23 / 24 ) & 131.303703703704 & 0.192559716676807 & 681.885629921674 \tabularnewline
Trimmed Mean ( 24 / 24 ) & 131.288 & 0.189060836769545 & 694.421976773716 \tabularnewline
Median & 130.9 &  &  \tabularnewline
Midrange & 129.4 &  &  \tabularnewline
Midmean - Weighted Average at Xnp & 131.35 &  &  \tabularnewline
Midmean - Weighted Average at X(n+1)p & 131.435135135135 &  &  \tabularnewline
Midmean - Empirical Distribution Function & 131.435135135135 &  &  \tabularnewline
Midmean - Empirical Distribution Function - Averaging & 131.435135135135 &  &  \tabularnewline
Midmean - Empirical Distribution Function - Interpolation & 131.435135135135 &  &  \tabularnewline
Midmean - Closest Observation & 131.226829268293 &  &  \tabularnewline
Midmean - True Basic - Statistics Graphics Toolkit & 131.435135135135 &  &  \tabularnewline
Midmean - MS Excel (old versions) & 131.435135135135 &  &  \tabularnewline
Number of observations & 73 &  &  \tabularnewline
\hline
\end{tabular}
%Source: https://freestatistics.org/blog/index.php?pk=240242&T=1

[TABLE]
[ROW][C]Central Tendency - Ungrouped Data[/C][/ROW]
[ROW][C]Measure[/C][C]Value[/C][C]S.E.[/C][C]Value/S.E.[/C][/ROW]
[ROW][C]Arithmetic Mean[/C][C]131.2[/C][C]0.451599558612961[/C][C]290.522870312288[/C][/ROW]
[ROW][C]Geometric Mean[/C][C]131.143518681954[/C][C][/C][C][/C][/ROW]
[ROW][C]Harmonic Mean[/C][C]131.086517593898[/C][C][/C][C][/C][/ROW]
[ROW][C]Quadratic Mean[/C][C]131.255947810438[/C][C][/C][C][/C][/ROW]
[ROW][C]Winsorized Mean ( 1 / 24 )[/C][C]131.208219178082[/C][C]0.449470149017602[/C][C]291.917537716045[/C][/ROW]
[ROW][C]Winsorized Mean ( 2 / 24 )[/C][C]131.208219178082[/C][C]0.449470149017602[/C][C]291.917537716045[/C][/ROW]
[ROW][C]Winsorized Mean ( 3 / 24 )[/C][C]131.261643835616[/C][C]0.436938942863489[/C][C]300.411867560695[/C][/ROW]
[ROW][C]Winsorized Mean ( 4 / 24 )[/C][C]131.261643835616[/C][C]0.436938942863489[/C][C]300.411867560695[/C][/ROW]
[ROW][C]Winsorized Mean ( 5 / 24 )[/C][C]131.268493150685[/C][C]0.435452653413693[/C][C]301.452964223819[/C][/ROW]
[ROW][C]Winsorized Mean ( 6 / 24 )[/C][C]131.268493150685[/C][C]0.432374583536444[/C][C]303.599004541442[/C][/ROW]
[ROW][C]Winsorized Mean ( 7 / 24 )[/C][C]131.393150684931[/C][C]0.407298001437958[/C][C]322.597091616091[/C][/ROW]
[ROW][C]Winsorized Mean ( 8 / 24 )[/C][C]131.393150684932[/C][C]0.407298001437958[/C][C]322.597091616091[/C][/ROW]
[ROW][C]Winsorized Mean ( 9 / 24 )[/C][C]131.393150684931[/C][C]0.407298001437958[/C][C]322.597091616091[/C][/ROW]
[ROW][C]Winsorized Mean ( 10 / 24 )[/C][C]131.393150684932[/C][C]0.407298001437958[/C][C]322.597091616091[/C][/ROW]
[ROW][C]Winsorized Mean ( 11 / 24 )[/C][C]131.317808219178[/C][C]0.395317640360108[/C][C]332.183021480034[/C][/ROW]
[ROW][C]Winsorized Mean ( 12 / 24 )[/C][C]131.301369863014[/C][C]0.392802894550942[/C][C]334.267826649087[/C][/ROW]
[ROW][C]Winsorized Mean ( 13 / 24 )[/C][C]131.71095890411[/C][C]0.321860563581537[/C][C]409.217449439851[/C][/ROW]
[ROW][C]Winsorized Mean ( 14 / 24 )[/C][C]131.921917808219[/C][C]0.292617475501[/C][C]450.834037107153[/C][/ROW]
[ROW][C]Winsorized Mean ( 15 / 24 )[/C][C]131.921917808219[/C][C]0.292617475501[/C][C]450.834037107153[/C][/ROW]
[ROW][C]Winsorized Mean ( 16 / 24 )[/C][C]131.921917808219[/C][C]0.292617475501[/C][C]450.834037107153[/C][/ROW]
[ROW][C]Winsorized Mean ( 17 / 24 )[/C][C]131.68904109589[/C][C]0.253600868435453[/C][C]519.276774990257[/C][/ROW]
[ROW][C]Winsorized Mean ( 18 / 24 )[/C][C]131.68904109589[/C][C]0.246478714366169[/C][C]534.281596828896[/C][/ROW]
[ROW][C]Winsorized Mean ( 19 / 24 )[/C][C]131.66301369863[/C][C]0.242376197032227[/C][C]543.217590302913[/C][/ROW]
[ROW][C]Winsorized Mean ( 20 / 24 )[/C][C]131.717808219178[/C][C]0.235398092698828[/C][C]559.553421648576[/C][/ROW]
[ROW][C]Winsorized Mean ( 21 / 24 )[/C][C]131.458904109589[/C][C]0.196030194615675[/C][C]670.605384886342[/C][/ROW]
[ROW][C]Winsorized Mean ( 22 / 24 )[/C][C]131.458904109589[/C][C]0.196030194615675[/C][C]670.605384886342[/C][/ROW]
[ROW][C]Winsorized Mean ( 23 / 24 )[/C][C]131.427397260274[/C][C]0.157381303561454[/C][C]835.089011757706[/C][/ROW]
[ROW][C]Winsorized Mean ( 24 / 24 )[/C][C]131.361643835616[/C][C]0.148388478500517[/C][C]885.255008765108[/C][/ROW]
[ROW][C]Trimmed Mean ( 1 / 24 )[/C][C]131.250704225352[/C][C]0.441790181357405[/C][C]297.088323289763[/C][/ROW]
[ROW][C]Trimmed Mean ( 2 / 24 )[/C][C]131.295652173913[/C][C]0.432574101012814[/C][C]303.521759315923[/C][/ROW]
[ROW][C]Trimmed Mean ( 3 / 24 )[/C][C]131.34328358209[/C][C]0.421495173493293[/C][C]311.61278192947[/C][/ROW]
[ROW][C]Trimmed Mean ( 4 / 24 )[/C][C]131.373846153846[/C][C]0.413929788517914[/C][C]317.381956549282[/C][/ROW]
[ROW][C]Trimmed Mean ( 5 / 24 )[/C][C]131.406349206349[/C][C]0.404720438023308[/C][C]324.684243395638[/C][/ROW]
[ROW][C]Trimmed Mean ( 6 / 24 )[/C][C]131.439344262295[/C][C]0.39397288947618[/C][C]333.625352843579[/C][/ROW]
[ROW][C]Trimmed Mean ( 7 / 24 )[/C][C]131.474576271186[/C][C]0.381701512359252[/C][C]344.443425069389[/C][/ROW]
[ROW][C]Trimmed Mean ( 8 / 24 )[/C][C]131.489473684211[/C][C]0.37344233055643[/C][C]352.101149026922[/C][/ROW]
[ROW][C]Trimmed Mean ( 9 / 24 )[/C][C]131.505454545455[/C][C]0.363164340106103[/C][C]362.110042266357[/C][/ROW]
[ROW][C]Trimmed Mean ( 10 / 24 )[/C][C]131.522641509434[/C][C]0.350322695003477[/C][C]375.432832029706[/C][/ROW]
[ROW][C]Trimmed Mean ( 11 / 24 )[/C][C]131.541176470588[/C][C]0.334150095082777[/C][C]393.658952687122[/C][/ROW]
[ROW][C]Trimmed Mean ( 12 / 24 )[/C][C]131.571428571429[/C][C]0.316469684526796[/C][C]415.74733696266[/C][/ROW]
[ROW][C]Trimmed Mean ( 13 / 24 )[/C][C]131.606382978723[/C][C]0.294183582411076[/C][C]447.361412557768[/C][/ROW]
[ROW][C]Trimmed Mean ( 14 / 24 )[/C][C]131.593333333333[/C][C]0.283865809811252[/C][C]463.575847407732[/C][/ROW]
[ROW][C]Trimmed Mean ( 15 / 24 )[/C][C]131.553488372093[/C][C]0.276594318093982[/C][C]475.618911041381[/C][/ROW]
[ROW][C]Trimmed Mean ( 16 / 24 )[/C][C]131.509756097561[/C][C]0.266682529768115[/C][C]493.132250589908[/C][/ROW]
[ROW][C]Trimmed Mean ( 17 / 24 )[/C][C]131.461538461538[/C][C]0.253094622190169[/C][C]519.416561774124[/C][/ROW]
[ROW][C]Trimmed Mean ( 18 / 24 )[/C][C]131.435135135135[/C][C]0.245659503856616[/C][C]535.029718255273[/C][/ROW]
[ROW][C]Trimmed Mean ( 19 / 24 )[/C][C]131.405714285714[/C][C]0.236960545492384[/C][C]554.546808679327[/C][/ROW]
[ROW][C]Trimmed Mean ( 20 / 24 )[/C][C]131.375757575758[/C][C]0.225715625551264[/C][C]582.041040600974[/C][/ROW]
[ROW][C]Trimmed Mean ( 21 / 24 )[/C][C]131.335483870968[/C][C]0.211118291618336[/C][C]622.094290666195[/C][/ROW]
[ROW][C]Trimmed Mean ( 22 / 24 )[/C][C]131.320689655172[/C][C]0.203865315238424[/C][C]644.154153940264[/C][/ROW]
[ROW][C]Trimmed Mean ( 23 / 24 )[/C][C]131.303703703704[/C][C]0.192559716676807[/C][C]681.885629921674[/C][/ROW]
[ROW][C]Trimmed Mean ( 24 / 24 )[/C][C]131.288[/C][C]0.189060836769545[/C][C]694.421976773716[/C][/ROW]
[ROW][C]Median[/C][C]130.9[/C][C][/C][C][/C][/ROW]
[ROW][C]Midrange[/C][C]129.4[/C][C][/C][C][/C][/ROW]
[ROW][C]Midmean - Weighted Average at Xnp[/C][C]131.35[/C][C][/C][C][/C][/ROW]
[ROW][C]Midmean - Weighted Average at X(n+1)p[/C][C]131.435135135135[/C][C][/C][C][/C][/ROW]
[ROW][C]Midmean - Empirical Distribution Function[/C][C]131.435135135135[/C][C][/C][C][/C][/ROW]
[ROW][C]Midmean - Empirical Distribution Function - Averaging[/C][C]131.435135135135[/C][C][/C][C][/C][/ROW]
[ROW][C]Midmean - Empirical Distribution Function - Interpolation[/C][C]131.435135135135[/C][C][/C][C][/C][/ROW]
[ROW][C]Midmean - Closest Observation[/C][C]131.226829268293[/C][C][/C][C][/C][/ROW]
[ROW][C]Midmean - True Basic - Statistics Graphics Toolkit[/C][C]131.435135135135[/C][C][/C][C][/C][/ROW]
[ROW][C]Midmean - MS Excel (old versions)[/C][C]131.435135135135[/C][C][/C][C][/C][/ROW]
[ROW][C]Number of observations[/C][C]73[/C][C][/C][C][/C][/ROW]
[/TABLE]
Source: https://freestatistics.org/blog/index.php?pk=240242&T=1

Globally Unique Identifier (entire table): ba.freestatistics.org/blog/index.php?pk=240242&T=1

As an alternative you can also use a QR Code:  

The GUIDs for individual cells are displayed in the table below:

Central Tendency - Ungrouped Data
MeasureValueS.E.Value/S.E.
Arithmetic Mean131.20.451599558612961290.522870312288
Geometric Mean131.143518681954
Harmonic Mean131.086517593898
Quadratic Mean131.255947810438
Winsorized Mean ( 1 / 24 )131.2082191780820.449470149017602291.917537716045
Winsorized Mean ( 2 / 24 )131.2082191780820.449470149017602291.917537716045
Winsorized Mean ( 3 / 24 )131.2616438356160.436938942863489300.411867560695
Winsorized Mean ( 4 / 24 )131.2616438356160.436938942863489300.411867560695
Winsorized Mean ( 5 / 24 )131.2684931506850.435452653413693301.452964223819
Winsorized Mean ( 6 / 24 )131.2684931506850.432374583536444303.599004541442
Winsorized Mean ( 7 / 24 )131.3931506849310.407298001437958322.597091616091
Winsorized Mean ( 8 / 24 )131.3931506849320.407298001437958322.597091616091
Winsorized Mean ( 9 / 24 )131.3931506849310.407298001437958322.597091616091
Winsorized Mean ( 10 / 24 )131.3931506849320.407298001437958322.597091616091
Winsorized Mean ( 11 / 24 )131.3178082191780.395317640360108332.183021480034
Winsorized Mean ( 12 / 24 )131.3013698630140.392802894550942334.267826649087
Winsorized Mean ( 13 / 24 )131.710958904110.321860563581537409.217449439851
Winsorized Mean ( 14 / 24 )131.9219178082190.292617475501450.834037107153
Winsorized Mean ( 15 / 24 )131.9219178082190.292617475501450.834037107153
Winsorized Mean ( 16 / 24 )131.9219178082190.292617475501450.834037107153
Winsorized Mean ( 17 / 24 )131.689041095890.253600868435453519.276774990257
Winsorized Mean ( 18 / 24 )131.689041095890.246478714366169534.281596828896
Winsorized Mean ( 19 / 24 )131.663013698630.242376197032227543.217590302913
Winsorized Mean ( 20 / 24 )131.7178082191780.235398092698828559.553421648576
Winsorized Mean ( 21 / 24 )131.4589041095890.196030194615675670.605384886342
Winsorized Mean ( 22 / 24 )131.4589041095890.196030194615675670.605384886342
Winsorized Mean ( 23 / 24 )131.4273972602740.157381303561454835.089011757706
Winsorized Mean ( 24 / 24 )131.3616438356160.148388478500517885.255008765108
Trimmed Mean ( 1 / 24 )131.2507042253520.441790181357405297.088323289763
Trimmed Mean ( 2 / 24 )131.2956521739130.432574101012814303.521759315923
Trimmed Mean ( 3 / 24 )131.343283582090.421495173493293311.61278192947
Trimmed Mean ( 4 / 24 )131.3738461538460.413929788517914317.381956549282
Trimmed Mean ( 5 / 24 )131.4063492063490.404720438023308324.684243395638
Trimmed Mean ( 6 / 24 )131.4393442622950.39397288947618333.625352843579
Trimmed Mean ( 7 / 24 )131.4745762711860.381701512359252344.443425069389
Trimmed Mean ( 8 / 24 )131.4894736842110.37344233055643352.101149026922
Trimmed Mean ( 9 / 24 )131.5054545454550.363164340106103362.110042266357
Trimmed Mean ( 10 / 24 )131.5226415094340.350322695003477375.432832029706
Trimmed Mean ( 11 / 24 )131.5411764705880.334150095082777393.658952687122
Trimmed Mean ( 12 / 24 )131.5714285714290.316469684526796415.74733696266
Trimmed Mean ( 13 / 24 )131.6063829787230.294183582411076447.361412557768
Trimmed Mean ( 14 / 24 )131.5933333333330.283865809811252463.575847407732
Trimmed Mean ( 15 / 24 )131.5534883720930.276594318093982475.618911041381
Trimmed Mean ( 16 / 24 )131.5097560975610.266682529768115493.132250589908
Trimmed Mean ( 17 / 24 )131.4615384615380.253094622190169519.416561774124
Trimmed Mean ( 18 / 24 )131.4351351351350.245659503856616535.029718255273
Trimmed Mean ( 19 / 24 )131.4057142857140.236960545492384554.546808679327
Trimmed Mean ( 20 / 24 )131.3757575757580.225715625551264582.041040600974
Trimmed Mean ( 21 / 24 )131.3354838709680.211118291618336622.094290666195
Trimmed Mean ( 22 / 24 )131.3206896551720.203865315238424644.154153940264
Trimmed Mean ( 23 / 24 )131.3037037037040.192559716676807681.885629921674
Trimmed Mean ( 24 / 24 )131.2880.189060836769545694.421976773716
Median130.9
Midrange129.4
Midmean - Weighted Average at Xnp131.35
Midmean - Weighted Average at X(n+1)p131.435135135135
Midmean - Empirical Distribution Function131.435135135135
Midmean - Empirical Distribution Function - Averaging131.435135135135
Midmean - Empirical Distribution Function - Interpolation131.435135135135
Midmean - Closest Observation131.226829268293
Midmean - True Basic - Statistics Graphics Toolkit131.435135135135
Midmean - MS Excel (old versions)131.435135135135
Number of observations73


Parameters (Session):
Parameters (R input):
R code (references can be found in the software module):
geomean <- function(x) {
return(exp(mean(log(x))))
}
harmean <- function(x) {
return(1/mean(1/x))
}
quamean <- function(x) {
return(sqrt(mean(x*x)))
}
winmean <- function(x) {
x <-sort(x[!is.na(x)])
n<-length(x)
denom <- 3
nodenom <- n/denom
if (nodenom>40) denom <- n/40
sqrtn = sqrt(n)
roundnodenom = floor(nodenom)
win <- array(NA,dim=c(roundnodenom,2))
for (j in 1:roundnodenom) {
win[j,1] <- (j*x[j+1]+sum(x[(j+1):(n-j)])+j*x[n-j])/n
win[j,2] <- sd(c(rep(x[j+1],j),x[(j+1):(n-j)],rep(x[n-j],j)))/sqrtn
}
return(win)
}
trimean <- function(x) {
x <-sort(x[!is.na(x)])
n<-length(x)
denom <- 3
nodenom <- n/denom
if (nodenom>40) denom <- n/40
sqrtn = sqrt(n)
roundnodenom = floor(nodenom)
tri <- array(NA,dim=c(roundnodenom,2))
for (j in 1:roundnodenom) {
tri[j,1] <- mean(x,trim=j/n)
tri[j,2] <- sd(x[(j+1):(n-j)]) / sqrt(n-j*2)
}
return(tri)
}
midrange <- function(x) {
return((max(x)+min(x))/2)
}
q1 <- function(data,n,p,i,f) {
np <- n*p;
i <<- floor(np)
f <<- np - i
qvalue <- (1-f)*data[i] + f*data[i+1]
}
q2 <- function(data,n,p,i,f) {
np <- (n+1)*p
i <<- floor(np)
f <<- np - i
qvalue <- (1-f)*data[i] + f*data[i+1]
}
q3 <- function(data,n,p,i,f) {
np <- n*p
i <<- floor(np)
f <<- np - i
if (f==0) {
qvalue <- data[i]
} else {
qvalue <- data[i+1]
}
}
q4 <- function(data,n,p,i,f) {
np <- n*p
i <<- floor(np)
f <<- np - i
if (f==0) {
qvalue <- (data[i]+data[i+1])/2
} else {
qvalue <- data[i+1]
}
}
q5 <- function(data,n,p,i,f) {
np <- (n-1)*p
i <<- floor(np)
f <<- np - i
if (f==0) {
qvalue <- data[i+1]
} else {
qvalue <- data[i+1] + f*(data[i+2]-data[i+1])
}
}
q6 <- function(data,n,p,i,f) {
np <- n*p+0.5
i <<- floor(np)
f <<- np - i
qvalue <- data[i]
}
q7 <- function(data,n,p,i,f) {
np <- (n+1)*p
i <<- floor(np)
f <<- np - i
if (f==0) {
qvalue <- data[i]
} else {
qvalue <- f*data[i] + (1-f)*data[i+1]
}
}
q8 <- function(data,n,p,i,f) {
np <- (n+1)*p
i <<- floor(np)
f <<- np - i
if (f==0) {
qvalue <- data[i]
} else {
if (f == 0.5) {
qvalue <- (data[i]+data[i+1])/2
} else {
if (f < 0.5) {
qvalue <- data[i]
} else {
qvalue <- data[i+1]
}
}
}
}
midmean <- function(x,def) {
x <-sort(x[!is.na(x)])
n<-length(x)
if (def==1) {
qvalue1 <- q1(x,n,0.25,i,f)
qvalue3 <- q1(x,n,0.75,i,f)
}
if (def==2) {
qvalue1 <- q2(x,n,0.25,i,f)
qvalue3 <- q2(x,n,0.75,i,f)
}
if (def==3) {
qvalue1 <- q3(x,n,0.25,i,f)
qvalue3 <- q3(x,n,0.75,i,f)
}
if (def==4) {
qvalue1 <- q4(x,n,0.25,i,f)
qvalue3 <- q4(x,n,0.75,i,f)
}
if (def==5) {
qvalue1 <- q5(x,n,0.25,i,f)
qvalue3 <- q5(x,n,0.75,i,f)
}
if (def==6) {
qvalue1 <- q6(x,n,0.25,i,f)
qvalue3 <- q6(x,n,0.75,i,f)
}
if (def==7) {
qvalue1 <- q7(x,n,0.25,i,f)
qvalue3 <- q7(x,n,0.75,i,f)
}
if (def==8) {
qvalue1 <- q8(x,n,0.25,i,f)
qvalue3 <- q8(x,n,0.75,i,f)
}
midm <- 0
myn <- 0
roundno4 <- round(n/4)
round3no4 <- round(3*n/4)
for (i in 1:n) {
if ((x[i]>=qvalue1) & (x[i]<=qvalue3)){
midm = midm + x[i]
myn = myn + 1
}
}
midm = midm / myn
return(midm)
}
(arm <- mean(x))
sqrtn <- sqrt(length(x))
(armse <- sd(x) / sqrtn)
(armose <- arm / armse)
(geo <- geomean(x))
(har <- harmean(x))
(qua <- quamean(x))
(win <- winmean(x))
(tri <- trimean(x))
(midr <- midrange(x))
midm <- array(NA,dim=8)
for (j in 1:8) midm[j] <- midmean(x,j)
midm
bitmap(file='test1.png')
lb <- win[,1] - 2*win[,2]
ub <- win[,1] + 2*win[,2]
if ((ylimmin == '') | (ylimmax == '')) plot(win[,1],type='b',main=main, xlab='j', pch=19, ylab='Winsorized Mean(j/n)', ylim=c(min(lb),max(ub))) else plot(win[,1],type='l',main=main, xlab='j', pch=19, ylab='Winsorized Mean(j/n)', ylim=c(ylimmin,ylimmax))
lines(ub,lty=3)
lines(lb,lty=3)
grid()
dev.off()
bitmap(file='test2.png')
lb <- tri[,1] - 2*tri[,2]
ub <- tri[,1] + 2*tri[,2]
if ((ylimmin == '') | (ylimmax == '')) plot(tri[,1],type='b',main=main, xlab='j', pch=19, ylab='Trimmed Mean(j/n)', ylim=c(min(lb),max(ub))) else plot(tri[,1],type='l',main=main, xlab='j', pch=19, ylab='Trimmed Mean(j/n)', ylim=c(ylimmin,ylimmax))
lines(ub,lty=3)
lines(lb,lty=3)
grid()
dev.off()
load(file='createtable')
a<-table.start()
a<-table.row.start(a)
a<-table.element(a,'Central Tendency - Ungrouped Data',4,TRUE)
a<-table.row.end(a)
a<-table.row.start(a)
a<-table.element(a,'Measure',header=TRUE)
a<-table.element(a,'Value',header=TRUE)
a<-table.element(a,'S.E.',header=TRUE)
a<-table.element(a,'Value/S.E.',header=TRUE)
a<-table.row.end(a)
a<-table.row.start(a)
a<-table.element(a,hyperlink('arithmetic_mean.htm', 'Arithmetic Mean', 'click to view the definition of the Arithmetic Mean'),header=TRUE)
a<-table.element(a,arm)
a<-table.element(a,hyperlink('arithmetic_mean_standard_error.htm', armse, 'click to view the definition of the Standard Error of the Arithmetic Mean'))
a<-table.element(a,armose)
a<-table.row.end(a)
a<-table.row.start(a)
a<-table.element(a,hyperlink('geometric_mean.htm', 'Geometric Mean', 'click to view the definition of the Geometric Mean'),header=TRUE)
a<-table.element(a,geo)
a<-table.element(a,'')
a<-table.row.end(a)
a<-table.row.start(a)
a<-table.element(a,hyperlink('harmonic_mean.htm', 'Harmonic Mean', 'click to view the definition of the Harmonic Mean'),header=TRUE)
a<-table.element(a,har)
a<-table.element(a,'')
a<-table.row.end(a)
a<-table.row.start(a)
a<-table.element(a,hyperlink('quadratic_mean.htm', 'Quadratic Mean', 'click to view the definition of the Quadratic Mean'),header=TRUE)
a<-table.element(a,qua)
a<-table.element(a,'')
a<-table.row.end(a)
for (j in 1:length(win[,1])) {
a<-table.row.start(a)
mylabel <- paste('Winsorized Mean (',j)
mylabel <- paste(mylabel,'/')
mylabel <- paste(mylabel,length(win[,1]))
mylabel <- paste(mylabel,')')
a<-table.element(a,hyperlink('winsorized_mean.htm', mylabel, 'click to view the definition of the Winsorized Mean'),header=TRUE)
a<-table.element(a,win[j,1])
a<-table.element(a,win[j,2])
a<-table.element(a,win[j,1]/win[j,2])
a<-table.row.end(a)
}
for (j in 1:length(tri[,1])) {
a<-table.row.start(a)
mylabel <- paste('Trimmed Mean (',j)
mylabel <- paste(mylabel,'/')
mylabel <- paste(mylabel,length(tri[,1]))
mylabel <- paste(mylabel,')')
a<-table.element(a,hyperlink('arithmetic_mean.htm', mylabel, 'click to view the definition of the Trimmed Mean'),header=TRUE)
a<-table.element(a,tri[j,1])
a<-table.element(a,tri[j,2])
a<-table.element(a,tri[j,1]/tri[j,2])
a<-table.row.end(a)
}
a<-table.row.start(a)
a<-table.element(a,hyperlink('median_1.htm', 'Median', 'click to view the definition of the Median'),header=TRUE)
a<-table.element(a,median(x))
a<-table.element(a,'')
a<-table.row.end(a)
a<-table.row.start(a)
a<-table.element(a,hyperlink('midrange.htm', 'Midrange', 'click to view the definition of the Midrange'),header=TRUE)
a<-table.element(a,midr)
a<-table.element(a,'')
a<-table.row.end(a)
a<-table.row.start(a)
mymid <- hyperlink('midmean.htm', 'Midmean', 'click to view the definition of the Midmean')
mylabel <- paste(mymid,hyperlink('method_1.htm','Weighted Average at Xnp',''),sep=' - ')
a<-table.element(a,mylabel,header=TRUE)
a<-table.element(a,midm[1])
a<-table.element(a,'')
a<-table.row.end(a)
a<-table.row.start(a)
mymid <- hyperlink('midmean.htm', 'Midmean', 'click to view the definition of the Midmean')
mylabel <- paste(mymid,hyperlink('method_2.htm','Weighted Average at X(n+1)p',''),sep=' - ')
a<-table.element(a,mylabel,header=TRUE)
a<-table.element(a,midm[2])
a<-table.element(a,'')
a<-table.row.end(a)
a<-table.row.start(a)
mymid <- hyperlink('midmean.htm', 'Midmean', 'click to view the definition of the Midmean')
mylabel <- paste(mymid,hyperlink('method_3.htm','Empirical Distribution Function',''),sep=' - ')
a<-table.element(a,mylabel,header=TRUE)
a<-table.element(a,midm[3])
a<-table.element(a,'')
a<-table.row.end(a)
a<-table.row.start(a)
mymid <- hyperlink('midmean.htm', 'Midmean', 'click to view the definition of the Midmean')
mylabel <- paste(mymid,hyperlink('method_4.htm','Empirical Distribution Function - Averaging',''),sep=' - ')
a<-table.element(a,mylabel,header=TRUE)
a<-table.element(a,midm[4])
a<-table.element(a,'')
a<-table.row.end(a)
a<-table.row.start(a)
mymid <- hyperlink('midmean.htm', 'Midmean', 'click to view the definition of the Midmean')
mylabel <- paste(mymid,hyperlink('method_5.htm','Empirical Distribution Function - Interpolation',''),sep=' - ')
a<-table.element(a,mylabel,header=TRUE)
a<-table.element(a,midm[5])
a<-table.element(a,'')
a<-table.row.end(a)
a<-table.row.start(a)
mymid <- hyperlink('midmean.htm', 'Midmean', 'click to view the definition of the Midmean')
mylabel <- paste(mymid,hyperlink('method_6.htm','Closest Observation',''),sep=' - ')
a<-table.element(a,mylabel,header=TRUE)
a<-table.element(a,midm[6])
a<-table.element(a,'')
a<-table.row.end(a)
a<-table.row.start(a)
mymid <- hyperlink('midmean.htm', 'Midmean', 'click to view the definition of the Midmean')
mylabel <- paste(mymid,hyperlink('method_7.htm','True Basic - Statistics Graphics Toolkit',''),sep=' - ')
a<-table.element(a,mylabel,header=TRUE)
a<-table.element(a,midm[7])
a<-table.element(a,'')
a<-table.row.end(a)
a<-table.row.start(a)
mymid <- hyperlink('midmean.htm', 'Midmean', 'click to view the definition of the Midmean')
mylabel <- paste(mymid,hyperlink('method_8.htm','MS Excel (old versions)',''),sep=' - ')
a<-table.element(a,mylabel,header=TRUE)
a<-table.element(a,midm[8])
a<-table.element(a,'')
a<-table.row.end(a)
a<-table.row.start(a)
a<-table.element(a,'Number of observations',header=TRUE)
a<-table.element(a,length(x))
a<-table.element(a,'')
a<-table.row.end(a)
a<-table.end(a)
table.save(a,file='mytable.tab')