par2 <- as.numeric(par2)
library(igraph)
ps.options(family='serif')
genderage <- as.data.frame(read.csv('https://automated.biganalytics.eu/download/genderandage.csv',header=F,sep=','))
colnames(genderage) <- c('uid', 'gender', 'age', 'pop', 'first', 'last')
wscompstats <- as.data.frame(read.csv('https://automated.biganalytics.eu/download/wscompstats.csv',header=T,sep=';'))
wscompstats$pad_guid <- as.character(wscompstats$pad_guid)
privatestats <- as.data.frame(read.csv('https://automated.biganalytics.eu/download/privatestats.csv',header=T,sep=';'))
privatestats$uid <- tolower(as.character(privatestats$uid))
x <- as.data.frame(read.csv('https://automated.biganalytics.eu/download/group_author.csv',header=T,sep=';'))
x$sharedtitle <- as.character(x$sharedtitle)
x$author_uid <- as.character(x$author_uid)
x$author_compendium_id <- as.character(x$author_compendium_id)
n <- length(x[,1])
wsarr <- array(NA,dim=c(n,5))
colnames(wsarr) <- c('size', 'seconds', 'revisions', 'hyperlinks', 'blogs')
receiver <- x[x$is_owner==0,]
owner <- x[x$is_owner==1,]
no <- length(owner[,1])
for (i in 1:n){
print(i)
if (x[i,'is_owner'] == 1) {
x[i,'sharedtitle'] = as.character(x[i,'author_uid'])
dum <- wscompstats[wscompstats$pad_guid == x[i,'author_compendium_id'],]
dum <- dum[dum$is_owner==1,]
wsarr[i,'size'] = dum[1,'size']
wsarr[i,'seconds'] = dum[1,'seconds']
wsarr[i,'revisions'] = dum[1,'revisions']
wsarr[i,'hyperlinks'] = dum[1,'hyperlinks']
wsarr[i,'blogs'] = dum[1,'blogs']
} else {
if (x[i,'workshop_compendium_id'] != '') {
owner1 <- owner[owner$workshop_compendium_id == x[i,'workshop_compendium_id'], ]
no1 <- length(owner1[,1])
for (j in 1:no1) {
if (owner1[j,'author_compendium_id'] == x[i,'author_compendium_id']) {
x[i,'sharedtitle'] <- as.character(owner1[j,'author_uid'])
print(paste('Owner = ', x[i,'sharedtitle'],sep=''))
dum <- wscompstats[wscompstats$pad_guid == x[i,'author_compendium_id'],]
dum <- dum[dum$is_owner==0,]
wsarr[i,'size'] = dum[1,'size']
wsarr[i,'seconds'] = dum[1,'seconds']
wsarr[i,'revisions'] = dum[1,'revisions']
wsarr[i,'hyperlinks'] = dum[1,'hyperlinks']
wsarr[i,'blogs'] = dum[1,'blogs']
break
}
}
}
}
}
x0 <- cbind(x,wsarr)
x1 <- x0[x$author_uid != x$sharedtitle,]
x2 <- x1
x2 <- x1[((tolower(substr(x1$sharedtitle,1,3)) == 'b-r') | (tolower(substr(x1$sharedtitle,1,2)) == 'a-')),]
x2 <- x2[((tolower(substr(x2$author_uid,1,3)) == 'b-r') | (tolower(substr(x2$author_uid,1,2)) == 'a-')),]
x2 <- x2[x2$sharedtitle != 'a-123456789',]
x2 <- x2[x2$author_uid != 'a-123456789',]
x2 <- x2[x2$sharedtitle != '',]
x2 <- x2[x2$author_uid != '',]
if (par1=='A') x2 <- x2[substr(x2$author_uid,1,2) == 'a-',]
if (par1=='BC') x2 <- x2[substr(x2$author_uid,1,2) == 'b-',]
x2[is.na(x2$size), 'size'] = 0
myigraphobject <- cbind(x2$sharedtitle, x2$author_uid)#, x2$size)
igraphobject <- graph.data.frame(myigraphobject, directed=T)
myv <- tolower(V(igraphobject)$name)
myvn <- length(myv)
genderage$uid <- as.character(genderage$uid)
genderage$age <- as.character(genderage$age)
mxtotsize = max(privatestats$totsize)
mxtottime = max(privatestats$totseconds)
mxpr120 = max(privatestats$feedback_messages_p120)
mxrc = max(privatestats$blogged_computations)
mxrfc = max(privatestats$time_in_rfc)
mymaxvertexsize = par2
for (i in 1:myvn) {
mygender <- ''
myage <- ''
mysize <- ''
mytime <- ''
mypr120 <- ''
myrc <- ''
myrfc <- ''
if (length((genderage[genderage$uid == myv[i], 'gender'])) > 0) {
mygender <- as.character(genderage[genderage$uid == myv[i], 'gender'])
mypop <- as.character(genderage[genderage$uid == myv[i], 'pop'])
}
mysize <- privatestats[privatestats$uid == myv[i], 'totsize'] / mxtotsize * mymaxvertexsize
mytime <- privatestats[privatestats$uid == myv[i], 'totseconds'] / mxtottime * mymaxvertexsize
mypr120 <- privatestats[privatestats$uid == myv[i], 'feedback_messages_p120'] / mxpr120 * mymaxvertexsize
myrc <- privatestats[privatestats$uid == myv[i], 'blogged_computations'] / mxrc * mymaxvertexsize
myrfc <- privatestats[privatestats$uid == myv[i], 'time_in_rfc'] / mxrfc * mymaxvertexsize
if (length((genderage[genderage$uid == myv[i], 'age'])) > 0) {
myage <- as.character(genderage[genderage$uid == myv[i], 'age'])
}
V(igraphobject)$color[i] <- 'white'
if (mygender == 'Male') {
if (mypop == 'SHW') {
V(igraphobject)$color[i] <- 'blue'
}
if (mypop == 'Ba2') {
V(igraphobject)$color[i] <- 'cyan'
}
if (mypop == 'Birmingham') {
V(igraphobject)$color[i] <- 'green'
}
}
if (mygender == 'Female') {
if (mypop == 'SHW') {
V(igraphobject)$color[i] <- 'red'
}
if (mypop == 'Ba2') {
V(igraphobject)$color[i] <- 'pink'
}
if (mypop == 'Birmingham') {
V(igraphobject)$color[i] <- 'orange'
}
}
V(igraphobject)$age[i] <- myage
V(igraphobject)$size[i] <- mysize
V(igraphobject)$time[i] <- mytime
V(igraphobject)$pr120[i] <- mypr120
V(igraphobject)$rc[i] <- myrc
V(igraphobject)$rfc[i] <- myrfc
}
myvcount = vcount(igraphobject)
myarea = myvcount^3
myradius = myvcount * myarea
l <- layout.fruchterman.reingold(igraphobject,dim=2,params=list(niter=5000, area=myarea, repulserad=myradius))
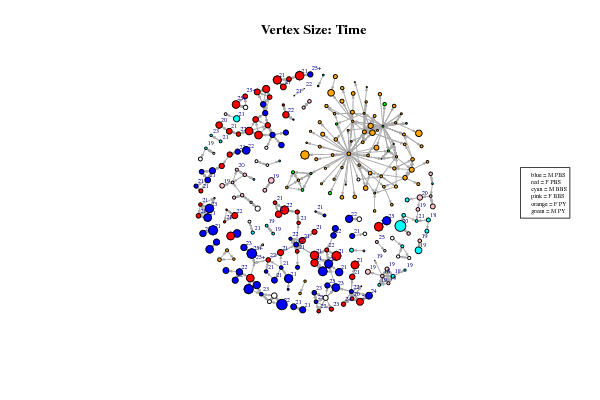
mymain = 'Vertex Size: Time'
bitmap(file='pic1.png')
plot(igraphobject, axes=F, xlab='', ylab='', layout=l, vertex.size=V(igraphobject)$rfc, vertex.label.cex=0.5, vertex.label.dist=0.5, edge.arrow.size=0.2, vertex.label=V(igraphobject)$age, main = mymain)
legend('right',c('blue = M PBS','red = F PBS', 'cyan = M BBS', 'pink = F BBS', 'orange = F PY', 'green = M PY'), cex=0.5)
dev.off()
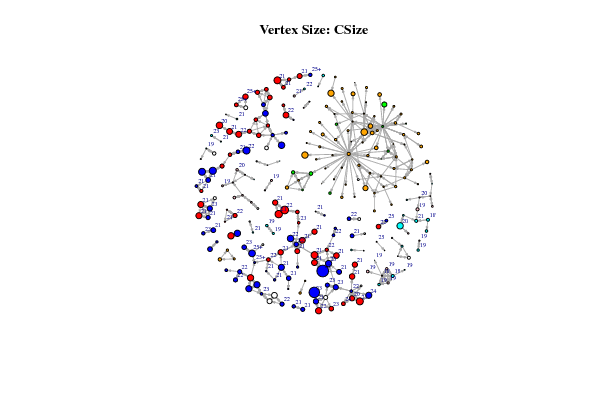
bitmap(file='pic2.png')
plot(igraphobject, layout=l, vertex.size=V(igraphobject)$size, vertex.label.cex=0.5, vertex.label.dist=0.5, edge.arrow.size=0.2, vertex.label=V(igraphobject)$age, main = 'Vertex Size: CSize')
dev.off()
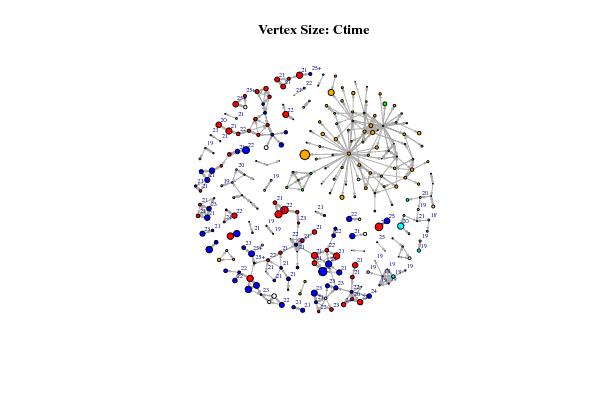
bitmap(file='pic3.png')
plot(igraphobject, layout=l, vertex.size=V(igraphobject)$time, vertex.label.cex=0.5, vertex.label.dist=0.5, edge.arrow.size=0.2, vertex.label=V(igraphobject)$age, main = 'Vertex Size: Ctime')
dev.off()
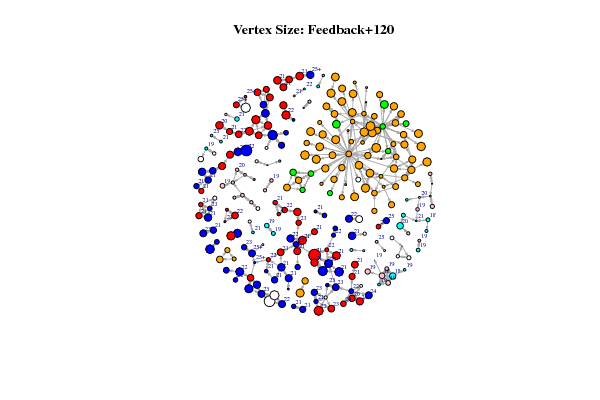
bitmap(file='pic4.png')
plot(igraphobject, layout=l, vertex.size=V(igraphobject)$pr120, vertex.label.cex=0.5, vertex.label.dist=0.5, edge.arrow.size=0.2, vertex.label=V(igraphobject)$age, main = 'Vertex Size: Feedback+120')
dev.off()
bitmap(file='pic5.png')
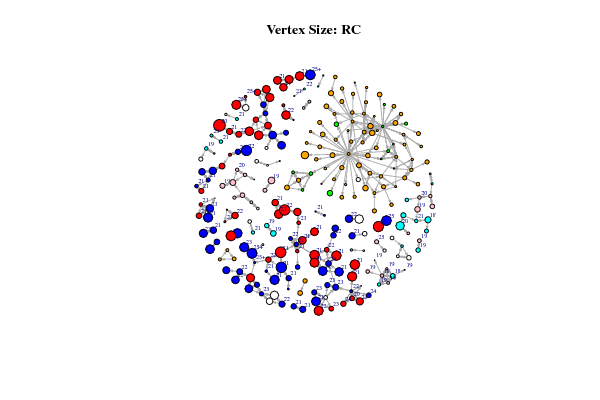
plot(igraphobject, layout=l, vertex.size=V(igraphobject)$rc, vertex.label.cex=0.5, vertex.label.dist=0.5, edge.arrow.size=0.2, vertex.label=V(igraphobject)$age, main = 'Vertex Size: RC')
dev.off()
|
