Free Statistics

of Irreproducible Research!

Author's title

Author*The author of this computation has been verified*
R Software Modulerwasp_autocorrelation.wasp
Title produced by software(Partial) Autocorrelation Function
Date of computationSun, 02 Dec 2012 05:34:31 -0500
Cite this page as followsStatistical Computations at FreeStatistics.org, Office for Research Development and Education, URL https://freestatistics.org/blog/index.php?v=date/2012/Dec/02/t1354444521hkx8fa1xxhajqfp.htm/, Retrieved Fri, 01 Nov 2024 00:29:45 +0000
Statistical Computations at FreeStatistics.org, Office for Research Development and Education, URL https://freestatistics.org/blog/index.php?pk=195408, Retrieved Fri, 01 Nov 2024 00:29:45 +0000
QR Codes:

Original text written by user:
IsPrivate?No (this computation is public)
User-defined keywords
Estimated Impact180
Family? (F = Feedback message, R = changed R code, M = changed R Module, P = changed Parameters, D = changed Data)
-     [Univariate Data Series] [data set] [2008-12-01 19:54:57] [b98453cac15ba1066b407e146608df68]
- RMP   [(Partial) Autocorrelation Function] [Unemployment] [2010-11-29 09:05:21] [b98453cac15ba1066b407e146608df68]
- R  D    [(Partial) Autocorrelation Function] [ws9] [2012-12-02 10:24:05] [7722d8427d2b2c713c1f0d5525f2f86c]
-   PD        [(Partial) Autocorrelation Function] [ws9] [2012-12-02 10:34:31] [2bcb0f1dab9cffb75c9fd882cacbd29a] [Current]
Feedback Forum

Post a new message
Dataseries X:
88.1
101.7
114.8
103.4
96.4
110
71.1
79.4
119.2
99.1
113.2
103.6
97.5
102.4
120.8
89.5
101.7
112.5
72.4
84.7
117.2
112.8
111.3
102.3
95.2
103
116.4
95.1
100.7
112.4
75.3
93.3
118.6
118.7
110.7
113.3
89.5
106.3
115.1
105.7
95.8
114.7
79.6
80.6
125
127.5
99.5
104.3
90
96
108.9
95.8
87.2
108.4
74.9
80.8
119.1
107.9
106.9
96.8
93.7
95.2
112.7
98.5
91.5
112
76.7
84.7
114.9
108.4
104.6
111.3
90.8
109.1
121
95.2
110.5
102.4
86.7
99.1
126
110.3
104.6
103.1
102


Summary of computational transaction
Raw Inputview raw input (R code)
Raw Outputview raw output of R engine
Computing time4 seconds
R Server'Gwilym Jenkins' @ jenkins.wessa.net

\begin{tabular}{lllllllll}
\hline
Summary of computational transaction \tabularnewline
Raw Input & view raw input (R code)  \tabularnewline
Raw Output & view raw output of R engine  \tabularnewline
Computing time & 4 seconds \tabularnewline
R Server & 'Gwilym Jenkins' @ jenkins.wessa.net \tabularnewline
\hline
\end{tabular}
%Source: https://freestatistics.org/blog/index.php?pk=195408&T=0

[TABLE]
[ROW][C]Summary of computational transaction[/C][/ROW]
[ROW][C]Raw Input[/C][C]view raw input (R code) [/C][/ROW]
[ROW][C]Raw Output[/C][C]view raw output of R engine [/C][/ROW]
[ROW][C]Computing time[/C][C]4 seconds[/C][/ROW]
[ROW][C]R Server[/C][C]'Gwilym Jenkins' @ jenkins.wessa.net[/C][/ROW]
[/TABLE]
Source: https://freestatistics.org/blog/index.php?pk=195408&T=0

Globally Unique Identifier (entire table): ba.freestatistics.org/blog/index.php?pk=195408&T=0

As an alternative you can also use a QR Code:  

The GUIDs for individual cells are displayed in the table below:

Summary of computational transaction
Raw Inputview raw input (R code)
Raw Outputview raw output of R engine
Computing time4 seconds
R Server'Gwilym Jenkins' @ jenkins.wessa.net


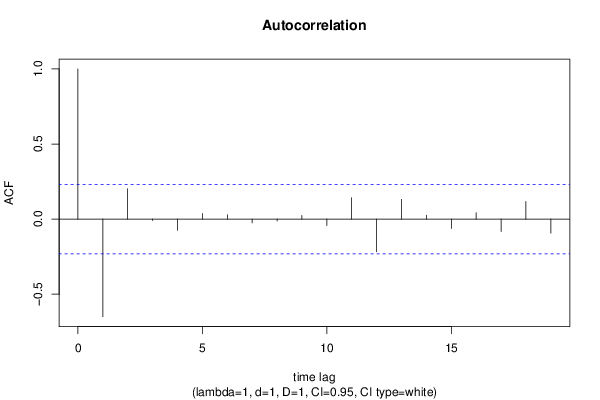
Autocorrelation Function
Time lag kACF(k)T-STATP-value
1-0.649612-5.51210
20.2020611.71450.045365
3-0.009466-0.08030.468104
4-0.073787-0.62610.266614
50.0369710.31370.377325
60.029040.24640.403031
7-0.025003-0.21220.416291
8-0.012847-0.1090.456749
90.0235280.19960.421163
10-0.042527-0.36090.359634
110.1420191.20510.116061
12-0.217793-1.8480.034352
130.1314641.11550.13417
140.02540.21550.414982
15-0.062882-0.53360.297642
160.0429090.36410.358426
17-0.082671-0.70150.242631
180.1167770.99090.16253
19-0.09338-0.79240.215379

\begin{tabular}{lllllllll}
\hline
Autocorrelation Function \tabularnewline
Time lag k & ACF(k) & T-STAT & P-value \tabularnewline
1 & -0.649612 & -5.5121 & 0 \tabularnewline
2 & 0.202061 & 1.7145 & 0.045365 \tabularnewline
3 & -0.009466 & -0.0803 & 0.468104 \tabularnewline
4 & -0.073787 & -0.6261 & 0.266614 \tabularnewline
5 & 0.036971 & 0.3137 & 0.377325 \tabularnewline
6 & 0.02904 & 0.2464 & 0.403031 \tabularnewline
7 & -0.025003 & -0.2122 & 0.416291 \tabularnewline
8 & -0.012847 & -0.109 & 0.456749 \tabularnewline
9 & 0.023528 & 0.1996 & 0.421163 \tabularnewline
10 & -0.042527 & -0.3609 & 0.359634 \tabularnewline
11 & 0.142019 & 1.2051 & 0.116061 \tabularnewline
12 & -0.217793 & -1.848 & 0.034352 \tabularnewline
13 & 0.131464 & 1.1155 & 0.13417 \tabularnewline
14 & 0.0254 & 0.2155 & 0.414982 \tabularnewline
15 & -0.062882 & -0.5336 & 0.297642 \tabularnewline
16 & 0.042909 & 0.3641 & 0.358426 \tabularnewline
17 & -0.082671 & -0.7015 & 0.242631 \tabularnewline
18 & 0.116777 & 0.9909 & 0.16253 \tabularnewline
19 & -0.09338 & -0.7924 & 0.215379 \tabularnewline
\hline
\end{tabular}
%Source: https://freestatistics.org/blog/index.php?pk=195408&T=1

[TABLE]
[ROW][C]Autocorrelation Function[/C][/ROW]
[ROW][C]Time lag k[/C][C]ACF(k)[/C][C]T-STAT[/C][C]P-value[/C][/ROW]
[ROW][C]1[/C][C]-0.649612[/C][C]-5.5121[/C][C]0[/C][/ROW]
[ROW][C]2[/C][C]0.202061[/C][C]1.7145[/C][C]0.045365[/C][/ROW]
[ROW][C]3[/C][C]-0.009466[/C][C]-0.0803[/C][C]0.468104[/C][/ROW]
[ROW][C]4[/C][C]-0.073787[/C][C]-0.6261[/C][C]0.266614[/C][/ROW]
[ROW][C]5[/C][C]0.036971[/C][C]0.3137[/C][C]0.377325[/C][/ROW]
[ROW][C]6[/C][C]0.02904[/C][C]0.2464[/C][C]0.403031[/C][/ROW]
[ROW][C]7[/C][C]-0.025003[/C][C]-0.2122[/C][C]0.416291[/C][/ROW]
[ROW][C]8[/C][C]-0.012847[/C][C]-0.109[/C][C]0.456749[/C][/ROW]
[ROW][C]9[/C][C]0.023528[/C][C]0.1996[/C][C]0.421163[/C][/ROW]
[ROW][C]10[/C][C]-0.042527[/C][C]-0.3609[/C][C]0.359634[/C][/ROW]
[ROW][C]11[/C][C]0.142019[/C][C]1.2051[/C][C]0.116061[/C][/ROW]
[ROW][C]12[/C][C]-0.217793[/C][C]-1.848[/C][C]0.034352[/C][/ROW]
[ROW][C]13[/C][C]0.131464[/C][C]1.1155[/C][C]0.13417[/C][/ROW]
[ROW][C]14[/C][C]0.0254[/C][C]0.2155[/C][C]0.414982[/C][/ROW]
[ROW][C]15[/C][C]-0.062882[/C][C]-0.5336[/C][C]0.297642[/C][/ROW]
[ROW][C]16[/C][C]0.042909[/C][C]0.3641[/C][C]0.358426[/C][/ROW]
[ROW][C]17[/C][C]-0.082671[/C][C]-0.7015[/C][C]0.242631[/C][/ROW]
[ROW][C]18[/C][C]0.116777[/C][C]0.9909[/C][C]0.16253[/C][/ROW]
[ROW][C]19[/C][C]-0.09338[/C][C]-0.7924[/C][C]0.215379[/C][/ROW]
[/TABLE]
Source: https://freestatistics.org/blog/index.php?pk=195408&T=1

Globally Unique Identifier (entire table): ba.freestatistics.org/blog/index.php?pk=195408&T=1

As an alternative you can also use a QR Code:  

The GUIDs for individual cells are displayed in the table below:

Autocorrelation Function
Time lag kACF(k)T-STATP-value
1-0.649612-5.51210
20.2020611.71450.045365
3-0.009466-0.08030.468104
4-0.073787-0.62610.266614
50.0369710.31370.377325
60.029040.24640.403031
7-0.025003-0.21220.416291
8-0.012847-0.1090.456749
90.0235280.19960.421163
10-0.042527-0.36090.359634
110.1420191.20510.116061
12-0.217793-1.8480.034352
130.1314641.11550.13417
140.02540.21550.414982
15-0.062882-0.53360.297642
160.0429090.36410.358426
17-0.082671-0.70150.242631
180.1167770.99090.16253
19-0.09338-0.79240.215379


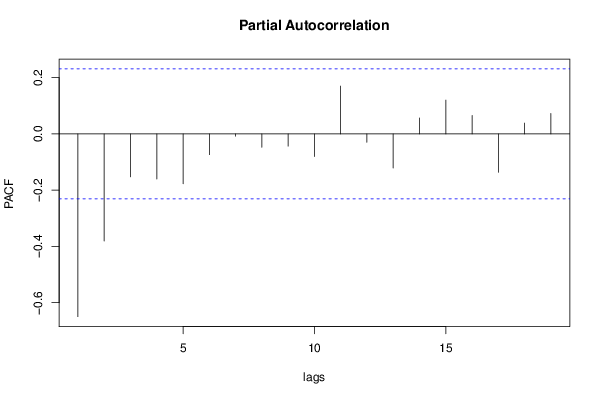
Partial Autocorrelation Function
Time lag kPACF(k)T-STATP-value
1-0.649612-5.51210
2-0.380507-3.22870.000937
3-0.152616-1.2950.09973
4-0.160367-1.36080.088917
5-0.17724-1.50390.068486
6-0.073658-0.6250.266972
7-0.007847-0.06660.473549
8-0.047705-0.40480.343416
9-0.043469-0.36880.356664
10-0.080135-0.680.249353
110.1700491.44290.07669
12-0.029884-0.25360.400274
13-0.121272-1.0290.153457
140.0564220.47880.316782
150.1202011.01990.155586
160.0654520.55540.290179
17-0.136052-1.15440.126069
180.0384460.32620.3726
190.0727830.61760.269398

\begin{tabular}{lllllllll}
\hline
Partial Autocorrelation Function \tabularnewline
Time lag k & PACF(k) & T-STAT & P-value \tabularnewline
1 & -0.649612 & -5.5121 & 0 \tabularnewline
2 & -0.380507 & -3.2287 & 0.000937 \tabularnewline
3 & -0.152616 & -1.295 & 0.09973 \tabularnewline
4 & -0.160367 & -1.3608 & 0.088917 \tabularnewline
5 & -0.17724 & -1.5039 & 0.068486 \tabularnewline
6 & -0.073658 & -0.625 & 0.266972 \tabularnewline
7 & -0.007847 & -0.0666 & 0.473549 \tabularnewline
8 & -0.047705 & -0.4048 & 0.343416 \tabularnewline
9 & -0.043469 & -0.3688 & 0.356664 \tabularnewline
10 & -0.080135 & -0.68 & 0.249353 \tabularnewline
11 & 0.170049 & 1.4429 & 0.07669 \tabularnewline
12 & -0.029884 & -0.2536 & 0.400274 \tabularnewline
13 & -0.121272 & -1.029 & 0.153457 \tabularnewline
14 & 0.056422 & 0.4788 & 0.316782 \tabularnewline
15 & 0.120201 & 1.0199 & 0.155586 \tabularnewline
16 & 0.065452 & 0.5554 & 0.290179 \tabularnewline
17 & -0.136052 & -1.1544 & 0.126069 \tabularnewline
18 & 0.038446 & 0.3262 & 0.3726 \tabularnewline
19 & 0.072783 & 0.6176 & 0.269398 \tabularnewline
\hline
\end{tabular}
%Source: https://freestatistics.org/blog/index.php?pk=195408&T=2

[TABLE]
[ROW][C]Partial Autocorrelation Function[/C][/ROW]
[ROW][C]Time lag k[/C][C]PACF(k)[/C][C]T-STAT[/C][C]P-value[/C][/ROW]
[ROW][C]1[/C][C]-0.649612[/C][C]-5.5121[/C][C]0[/C][/ROW]
[ROW][C]2[/C][C]-0.380507[/C][C]-3.2287[/C][C]0.000937[/C][/ROW]
[ROW][C]3[/C][C]-0.152616[/C][C]-1.295[/C][C]0.09973[/C][/ROW]
[ROW][C]4[/C][C]-0.160367[/C][C]-1.3608[/C][C]0.088917[/C][/ROW]
[ROW][C]5[/C][C]-0.17724[/C][C]-1.5039[/C][C]0.068486[/C][/ROW]
[ROW][C]6[/C][C]-0.073658[/C][C]-0.625[/C][C]0.266972[/C][/ROW]
[ROW][C]7[/C][C]-0.007847[/C][C]-0.0666[/C][C]0.473549[/C][/ROW]
[ROW][C]8[/C][C]-0.047705[/C][C]-0.4048[/C][C]0.343416[/C][/ROW]
[ROW][C]9[/C][C]-0.043469[/C][C]-0.3688[/C][C]0.356664[/C][/ROW]
[ROW][C]10[/C][C]-0.080135[/C][C]-0.68[/C][C]0.249353[/C][/ROW]
[ROW][C]11[/C][C]0.170049[/C][C]1.4429[/C][C]0.07669[/C][/ROW]
[ROW][C]12[/C][C]-0.029884[/C][C]-0.2536[/C][C]0.400274[/C][/ROW]
[ROW][C]13[/C][C]-0.121272[/C][C]-1.029[/C][C]0.153457[/C][/ROW]
[ROW][C]14[/C][C]0.056422[/C][C]0.4788[/C][C]0.316782[/C][/ROW]
[ROW][C]15[/C][C]0.120201[/C][C]1.0199[/C][C]0.155586[/C][/ROW]
[ROW][C]16[/C][C]0.065452[/C][C]0.5554[/C][C]0.290179[/C][/ROW]
[ROW][C]17[/C][C]-0.136052[/C][C]-1.1544[/C][C]0.126069[/C][/ROW]
[ROW][C]18[/C][C]0.038446[/C][C]0.3262[/C][C]0.3726[/C][/ROW]
[ROW][C]19[/C][C]0.072783[/C][C]0.6176[/C][C]0.269398[/C][/ROW]
[/TABLE]
Source: https://freestatistics.org/blog/index.php?pk=195408&T=2

Globally Unique Identifier (entire table): ba.freestatistics.org/blog/index.php?pk=195408&T=2

As an alternative you can also use a QR Code:  

The GUIDs for individual cells are displayed in the table below:

Partial Autocorrelation Function
Time lag kPACF(k)T-STATP-value
1-0.649612-5.51210
2-0.380507-3.22870.000937
3-0.152616-1.2950.09973
4-0.160367-1.36080.088917
5-0.17724-1.50390.068486
6-0.073658-0.6250.266972
7-0.007847-0.06660.473549
8-0.047705-0.40480.343416
9-0.043469-0.36880.356664
10-0.080135-0.680.249353
110.1700491.44290.07669
12-0.029884-0.25360.400274
13-0.121272-1.0290.153457
140.0564220.47880.316782
150.1202011.01990.155586
160.0654520.55540.290179
17-0.136052-1.15440.126069
180.0384460.32620.3726
190.0727830.61760.269398


Parameters (Session):
par1 = Default ; par2 = 1 ; par3 = 1 ; par4 = 1 ; par5 = 12 ; par6 = White Noise ; par7 = 0.95 ;
Parameters (R input):
par1 = Default ; par2 = 1 ; par3 = 1 ; par4 = 1 ; par5 = 12 ; par6 = White Noise ; par7 = 0.95 ; par8 = ;
R code (references can be found in the software module):
if (par1 == 'Default') {
par1 = 10*log10(length(x))
} else {
par1 <- as.numeric(par1)
}
par2 <- as.numeric(par2)
par3 <- as.numeric(par3)
par4 <- as.numeric(par4)
par5 <- as.numeric(par5)
if (par6 == 'White Noise') par6 <- 'white' else par6 <- 'ma'
par7 <- as.numeric(par7)
if (par2 == 0) {
x <- log(x)
} else {
x <- (x ^ par2 - 1) / par2
}
if (par3 > 0) x <- diff(x,lag=1,difference=par3)
if (par4 > 0) x <- diff(x,lag=par5,difference=par4)
bitmap(file='pic1.png')
racf <- acf(x, par1, main='Autocorrelation', xlab='time lag', ylab='ACF', ci.type=par6, ci=par7, sub=paste('(lambda=',par2,', d=',par3,', D=',par4,', CI=', par7, ', CI type=',par6,')',sep=''))
dev.off()
bitmap(file='pic2.png')
rpacf <- pacf(x,par1,main='Partial Autocorrelation',xlab='lags',ylab='PACF')
dev.off()
(myacf <- c(racf$acf))
(mypacf <- c(rpacf$acf))
lengthx <- length(x)
sqrtn <- sqrt(lengthx)
load(file='createtable')
a<-table.start()
a<-table.row.start(a)
a<-table.element(a,'Autocorrelation Function',4,TRUE)
a<-table.row.end(a)
a<-table.row.start(a)
a<-table.element(a,'Time lag k',header=TRUE)
a<-table.element(a,hyperlink('basics.htm','ACF(k)','click here for more information about the Autocorrelation Function'),header=TRUE)
a<-table.element(a,'T-STAT',header=TRUE)
a<-table.element(a,'P-value',header=TRUE)
a<-table.row.end(a)
for (i in 2:(par1+1)) {
a<-table.row.start(a)
a<-table.element(a,i-1,header=TRUE)
a<-table.element(a,round(myacf[i],6))
mytstat <- myacf[i]*sqrtn
a<-table.element(a,round(mytstat,4))
a<-table.element(a,round(1-pt(abs(mytstat),lengthx),6))
a<-table.row.end(a)
}
a<-table.end(a)
table.save(a,file='mytable.tab')
a<-table.start()
a<-table.row.start(a)
a<-table.element(a,'Partial Autocorrelation Function',4,TRUE)
a<-table.row.end(a)
a<-table.row.start(a)
a<-table.element(a,'Time lag k',header=TRUE)
a<-table.element(a,hyperlink('basics.htm','PACF(k)','click here for more information about the Partial Autocorrelation Function'),header=TRUE)
a<-table.element(a,'T-STAT',header=TRUE)
a<-table.element(a,'P-value',header=TRUE)
a<-table.row.end(a)
for (i in 1:par1) {
a<-table.row.start(a)
a<-table.element(a,i,header=TRUE)
a<-table.element(a,round(mypacf[i],6))
mytstat <- mypacf[i]*sqrtn
a<-table.element(a,round(mytstat,4))
a<-table.element(a,round(1-pt(abs(mytstat),lengthx),6))
a<-table.row.end(a)
}
a<-table.end(a)
table.save(a,file='mytable1.tab')