frequentietabel 4 klassen | ||||||||||||||||||||||||||||||||||||||||||||||
| *Unverified author* | ||||||||||||||||||||||||||||||||||||||||||||||
| R Software Module: /rwasp_histogram.wasp (opens new window with default values) | ||||||||||||||||||||||||||||||||||||||||||||||
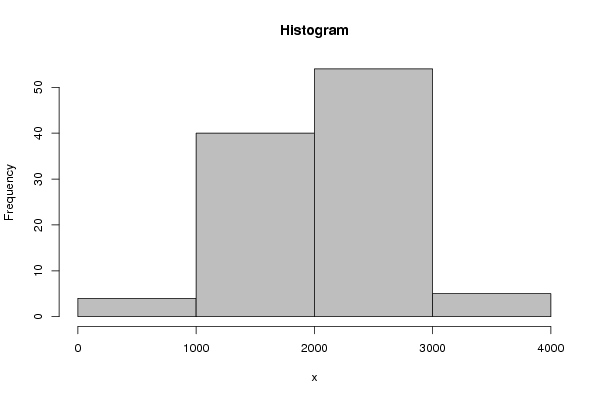
| Title produced by software: Histogram | ||||||||||||||||||||||||||||||||||||||||||||||
| Date of computation: Tue, 22 Feb 2011 14:36:10 +0000 | ||||||||||||||||||||||||||||||||||||||||||||||
| Cite this page as follows: | ||||||||||||||||||||||||||||||||||||||||||||||
| Statistical Computations at FreeStatistics.org, Office for Research Development and Education, URL http://www.freestatistics.org/blog/date/2011/Feb/22/t1298385270yk8qggmwjr9rrzy.htm/, Retrieved Tue, 22 Feb 2011 15:34:31 +0100 | ||||||||||||||||||||||||||||||||||||||||||||||
| Original text written by user: | ||||||||||||||||||||||||||||||||||||||||||||||
| IsPrivate? | ||||||||||||||||||||||||||||||||||||||||||||||
| No (this computation is public) | ||||||||||||||||||||||||||||||||||||||||||||||
| User-defined keywords: | ||||||||||||||||||||||||||||||||||||||||||||||
| KDGP1W22 | ||||||||||||||||||||||||||||||||||||||||||||||
| Dataseries X: | ||||||||||||||||||||||||||||||||||||||||||||||
| » Textbox « » Textfile « » CSV « | ||||||||||||||||||||||||||||||||||||||||||||||
| 814 1150 1225 1691 1759 1754 2100 2062 2012 1897 1964 2186 966 1549 1538 1612 2078 2137 2907 2249 1883 1739 1828 1868 1138 1430 1809 1763 2200 2067 2503 2141 2103 1972 2181 2344 970 1199 1718 1683 2025 2051 2439 2353 2230 1852 2147 2286 1007 1665 1642 1518 1831 2207 2822 2393 2306 1785 2047 2171 1212 1335 2011 1860 1954 2152 2835 2224 2182 1992 2389 2724 891 1247 2017 2257 2255 2255 3057 3330 1896 2096 2374 2535 1041 1728 2201 2455 2204 2660 3670 2665 2639 2226 2586 2684 1185 1749 2459 2618 2585 3310 3923 | ||||||||||||||||||||||||||||||||||||||||||||||
| Output produced by software: | ||||||||||||||||||||||||||||||||||||||||||||||
| ||||||||||||||||||||||||||||||||||||||||||||||
| Charts produced by software: | ||||||||||||||||||||||||||||||||||||||||||||||
| ||||||||||||||||||||||||||||||||||||||||||||||
| Parameters (Session): | ||||||||||||||||||||||||||||||||||||||||||||||
| par1 = 4 ; par2 = grey ; par3 = FALSE ; par4 = Unknown ; | ||||||||||||||||||||||||||||||||||||||||||||||
| Parameters (R input): | ||||||||||||||||||||||||||||||||||||||||||||||
| par1 = 4 ; par2 = grey ; par3 = FALSE ; par4 = Unknown ; | ||||||||||||||||||||||||||||||||||||||||||||||
| R code (references can be found in the software module): | ||||||||||||||||||||||||||||||||||||||||||||||
| par1 <- as.numeric(par1)
if (par3 == 'TRUE') par3 <- TRUE if (par3 == 'FALSE') par3 <- FALSE if (par4 == 'Unknown') par1 <- as.numeric(par1) if (par4 == 'Interval/Ratio') par1 <- as.numeric(par1) if (par4 == '3-point Likert') par1 <- c(1:3 - 0.5, 3.5) if (par4 == '4-point Likert') par1 <- c(1:4 - 0.5, 4.5) if (par4 == '5-point Likert') par1 <- c(1:5 - 0.5, 5.5) if (par4 == '6-point Likert') par1 <- c(1:6 - 0.5, 6.5) if (par4 == '7-point Likert') par1 <- c(1:7 - 0.5, 7.5) if (par4 == '8-point Likert') par1 <- c(1:8 - 0.5, 8.5) if (par4 == '9-point Likert') par1 <- c(1:9 - 0.5, 9.5) if (par4 == '10-point Likert') par1 <- c(1:10 - 0.5, 10.5) bitmap(file='test1.png') if(is.numeric(x[1])) { if (is.na(par1)) { myhist<-hist(x,col=par2,main=main,xlab=xlab,right=par3) } else { if (par1 < 0) par1 <- 3 if (par1 > 50) par1 <- 50 myhist<-hist(x,breaks=par1,col=par2,main=main,xlab=xlab,right=par3) } } else { plot(mytab <- table(x),col=par2,main='Frequency Plot',xlab=xlab,ylab='Absolute Frequency') } dev.off() if(is.numeric(x[1])) { myhist n <- length(x) load(file='createtable') a<-table.start() a<-table.row.start(a) a<-table.element(a,hyperlink('http://www.xycoon.com/histogram.htm','Frequency Table (Histogram)',''),6,TRUE) a<-table.row.end(a) a<-table.row.start(a) a<-table.element(a,'Bins',header=TRUE) a<-table.element(a,'Midpoint',header=TRUE) a<-table.element(a,'Abs. Frequency',header=TRUE) a<-table.element(a,'Rel. Frequency',header=TRUE) a<-table.element(a,'Cumul. Rel. Freq.',header=TRUE) a<-table.element(a,'Density',header=TRUE) a<-table.row.end(a) crf <- 0 if (par3 == FALSE) mybracket <- '[' else mybracket <- ']' mynumrows <- (length(myhist$breaks)-1) for (i in 1:mynumrows) { a<-table.row.start(a) if (i == 1) dum <- paste('[',myhist$breaks[i],sep='') else dum <- paste(mybracket,myhist$breaks[i],sep='') dum <- paste(dum,myhist$breaks[i+1],sep=',') if (i==mynumrows) dum <- paste(dum,']',sep='') else dum <- paste(dum,mybracket,sep='') a<-table.element(a,dum,header=TRUE) a<-table.element(a,myhist$mids[i]) a<-table.element(a,myhist$counts[i]) rf <- myhist$counts[i]/n crf <- crf + rf a<-table.element(a,round(rf,6)) a<-table.element(a,round(crf,6)) a<-table.element(a,round(myhist$density[i],6)) a<-table.row.end(a) } a<-table.end(a) table.save(a,file='mytable.tab') } else { mytab reltab <- mytab / sum(mytab) n <- length(mytab) load(file='createtable') a<-table.start() a<-table.row.start(a) a<-table.element(a,'Frequency Table (Categorical Data)',3,TRUE) a<-table.row.end(a) a<-table.row.start(a) a<-table.element(a,'Category',header=TRUE) a<-table.element(a,'Abs. Frequency',header=TRUE) a<-table.element(a,'Rel. Frequency',header=TRUE) a<-table.row.end(a) for (i in 1:n) { a<-table.row.start(a) a<-table.element(a,labels(mytab)$x[i],header=TRUE) a<-table.element(a,mytab[i]) a<-table.element(a,round(reltab[i],4)) a<-table.row.end(a) } a<-table.end(a) table.save(a,file='mytable1.tab') } | ||||||||||||||||||||||||||||||||||||||||||||||
Copyright

This work is licensed under a
Creative Commons Attribution-Noncommercial-Share Alike 3.0 License.
Software written by Ed van Stee & Patrick Wessa
Disclaimer
Information provided on this web site is provided "AS IS" without warranty of any kind, either express or implied, including, without limitation, warranties of merchantability, fitness for a particular purpose, and noninfringement. We use reasonable efforts to include accurate and timely information and periodically update the information, and software without notice. However, we make no warranties or representations as to the accuracy or completeness of such information (or software), and we assume no liability or responsibility for errors or omissions in the content of this web site, or any software bugs in online applications. Your use of this web site is AT YOUR OWN RISK. Under no circumstances and under no legal theory shall we be liable to you or any other person for any direct, indirect, special, incidental, exemplary, or consequential damages arising from your access to, or use of, this web site.
Privacy Policy
We may request personal information to be submitted to our servers in order to be able to:
- personalize online software applications according to your needs
- enforce strict security rules with respect to the data that you upload (e.g. statistical data)
- manage user sessions of online applications
- alert you about important changes or upgrades in resources or applications
We NEVER allow other companies to directly offer registered users information about their products and services. Banner references and hyperlinks of third parties NEVER contain any personal data of the visitor.
We do NOT sell, nor transmit by any means, personal information, nor statistical data series uploaded by you to third parties.
We carefully protect your data from loss, misuse, alteration,
and destruction. However, at any time, and under any circumstance you
are solely responsible for managing your passwords, and keeping them
secret.
We store a unique ANONYMOUS USER ID in the form of a small 'Cookie' on your computer. This allows us to track your progress when using this website which is necessary to create state-dependent features. The cookie is used for NO OTHER PURPOSE. At any time you may opt to disallow cookies from this website - this will not affect other features of this website.
We examine cookies that are used by third-parties (banner and online ads) very closely: abuse from third-parties automatically results in termination of the advertising contract without refund. We have very good reason to believe that the cookies that are produced by third parties (banner ads) do NOT cause any privacy or security risk.
FreeStatistics.org is safe. There is no need to download any software to use the applications and services contained in this website. Hence, your system's security is not compromised by their use, and your personal data - other than data you submit in the account application form, and the user-agent information that is transmitted by your browser - is never transmitted to our servers.
As a general rule, we do not log on-line behavior of individuals (other than normal logging of webserver 'hits'). However, in cases of abuse, hacking, unauthorized access, Denial of Service attacks, illegal copying, hotlinking, non-compliance with international webstandards (such as robots.txt), or any other harmful behavior, our system engineers are empowered to log, track, identify, publish, and ban misbehaving individuals - even if this leads to ban entire blocks of IP addresses, or disclosing user's identity.