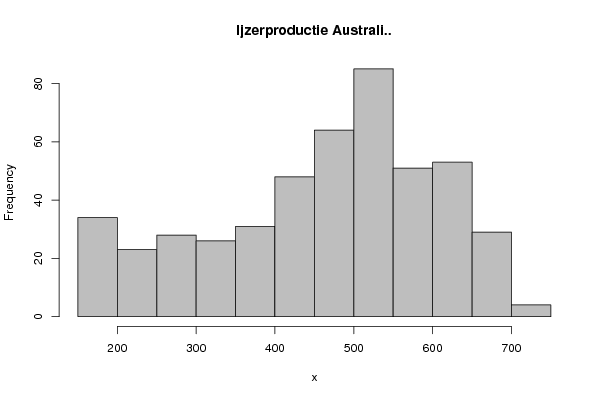
Datareekst Ijzerproductie Australië | ||||||||||||||||||||||||||||||||||||||||||||||||||||||||||||||||||||||||||||||||||||||||||||||
| *Unverified author* | ||||||||||||||||||||||||||||||||||||||||||||||||||||||||||||||||||||||||||||||||||||||||||||||
| R Software Module: /rwasp_histogram.wasp (opens new window with default values) | ||||||||||||||||||||||||||||||||||||||||||||||||||||||||||||||||||||||||||||||||||||||||||||||
| Title produced by software: Histogram | ||||||||||||||||||||||||||||||||||||||||||||||||||||||||||||||||||||||||||||||||||||||||||||||
| Date of computation: Wed, 09 Feb 2011 14:10:01 +0000 | ||||||||||||||||||||||||||||||||||||||||||||||||||||||||||||||||||||||||||||||||||||||||||||||
| Cite this page as follows: | ||||||||||||||||||||||||||||||||||||||||||||||||||||||||||||||||||||||||||||||||||||||||||||||
| Statistical Computations at FreeStatistics.org, Office for Research Development and Education, URL http://www.freestatistics.org/blog/date/2011/Feb/09/t12972605694uwd4vy5km6j8sl.htm/, Retrieved Wed, 09 Feb 2011 15:09:30 +0100 | ||||||||||||||||||||||||||||||||||||||||||||||||||||||||||||||||||||||||||||||||||||||||||||||
| BibTeX entries for LaTeX users: | ||||||||||||||||||||||||||||||||||||||||||||||||||||||||||||||||||||||||||||||||||||||||||||||
@Manual{KEY,
    author = {{YOUR NAME}},
    publisher = {Office for Research Development and Education},
    title = {Statistical Computations at FreeStatistics.org, URL http://www.freestatistics.org/blog/date/2011/Feb/09/t12972605694uwd4vy5km6j8sl.htm/},
    year = {2011},
}
@Manual{R,
    title = {R: A Language and Environment for Statistical Computing},
    author = {{R Development Core Team}},
    organization = {R Foundation for Statistical Computing},
    address = {Vienna, Austria},
    year = {2011},
    note = {{ISBN} 3-900051-07-0},
    url = {http://www.R-project.org},
}
| ||||||||||||||||||||||||||||||||||||||||||||||||||||||||||||||||||||||||||||||||||||||||||||||
| Original text written by user: | ||||||||||||||||||||||||||||||||||||||||||||||||||||||||||||||||||||||||||||||||||||||||||||||
| IsPrivate? | ||||||||||||||||||||||||||||||||||||||||||||||||||||||||||||||||||||||||||||||||||||||||||||||
| No (this computation is public) | ||||||||||||||||||||||||||||||||||||||||||||||||||||||||||||||||||||||||||||||||||||||||||||||
| User-defined keywords: | ||||||||||||||||||||||||||||||||||||||||||||||||||||||||||||||||||||||||||||||||||||||||||||||
| Dataseries X: | ||||||||||||||||||||||||||||||||||||||||||||||||||||||||||||||||||||||||||||||||||||||||||||||
| » Textbox « » Textfile « » CSV « | ||||||||||||||||||||||||||||||||||||||||||||||||||||||||||||||||||||||||||||||||||||||||||||||
| 172 166 175 171 184 175 183 154 182 161 191 197 193 174 178 171 176 184 202 199 185 191 185 205 201 176 200 190 203 182 193 198 193 185 192 204 202 184 191 196 210 235 214 215 211 261 210 216 216 198 223 243 252 252 243 255 246 259 252 282 239 237 267 245 275 283 299 297 276 256 237 299 304 273 308 303 301 279 298 291 267 286 279 305 302 274 306 277 296 252 304 350 328 328 337 334 340 332 344 288 295 322 357 359 337 330 337 353 339 316 323 306 322 335 382 392 376 373 385 402 380 328 356 352 389 401 429 402 420 440 427 420 426 361 406 388 453 434 445 456 434 423 388 442 452 427 467 449 473 443 419 457 462 505 495 522 518 456 540 495 502 505 497 516 501 523 521 533 524 458 427 440 539 515 526 536 537 564 531 550 536 450 533 521 438 509 535 544 536 549 509 466 472 444 498 478 532 497 542 553 576 626 629 646 611 etc... | ||||||||||||||||||||||||||||||||||||||||||||||||||||||||||||||||||||||||||||||||||||||||||||||
| Output produced by software: | ||||||||||||||||||||||||||||||||||||||||||||||||||||||||||||||||||||||||||||||||||||||||||||||
| ||||||||||||||||||||||||||||||||||||||||||||||||||||||||||||||||||||||||||||||||||||||||||||||
| Charts produced by software: | ||||||||||||||||||||||||||||||||||||||||||||||||||||||||||||||||||||||||||||||||||||||||||||||
| ||||||||||||||||||||||||||||||||||||||||||||||||||||||||||||||||||||||||||||||||||||||||||||||
| Parameters (Session): | ||||||||||||||||||||||||||||||||||||||||||||||||||||||||||||||||||||||||||||||||||||||||||||||
| par2 = grey ; par3 = FALSE ; par4 = Unknown ; | ||||||||||||||||||||||||||||||||||||||||||||||||||||||||||||||||||||||||||||||||||||||||||||||
| Parameters (R input): | ||||||||||||||||||||||||||||||||||||||||||||||||||||||||||||||||||||||||||||||||||||||||||||||
| par2 = grey ; par3 = FALSE ; par4 = Unknown ; | ||||||||||||||||||||||||||||||||||||||||||||||||||||||||||||||||||||||||||||||||||||||||||||||
| R code (references can be found in the software module): | ||||||||||||||||||||||||||||||||||||||||||||||||||||||||||||||||||||||||||||||||||||||||||||||
| par1 <- as.numeric(par1)
if (par3 == 'TRUE') par3 <- TRUE if (par3 == 'FALSE') par3 <- FALSE if (par4 == 'Unknown') par1 <- as.numeric(par1) if (par4 == 'Interval/Ratio') par1 <- as.numeric(par1) if (par4 == '3-point Likert') par1 <- c(1:3 - 0.5, 3.5) if (par4 == '4-point Likert') par1 <- c(1:4 - 0.5, 4.5) if (par4 == '5-point Likert') par1 <- c(1:5 - 0.5, 5.5) if (par4 == '6-point Likert') par1 <- c(1:6 - 0.5, 6.5) if (par4 == '7-point Likert') par1 <- c(1:7 - 0.5, 7.5) if (par4 == '8-point Likert') par1 <- c(1:8 - 0.5, 8.5) if (par4 == '9-point Likert') par1 <- c(1:9 - 0.5, 9.5) if (par4 == '10-point Likert') par1 <- c(1:10 - 0.5, 10.5) bitmap(file='test1.png') if(is.numeric(x[1])) { if (is.na(par1)) { myhist<-hist(x,col=par2,main=main,xlab=xlab,right=par3) } else { if (par1 < 0) par1 <- 3 if (par1 > 50) par1 <- 50 myhist<-hist(x,breaks=par1,col=par2,main=main,xlab=xlab,right=par3) } } else { plot(mytab <- table(x),col=par2,main='Frequency Plot',xlab=xlab,ylab='Absolute Frequency') } dev.off() if(is.numeric(x[1])) { myhist n <- length(x) load(file='createtable') a<-table.start() a<-table.row.start(a) a<-table.element(a,hyperlink('http://www.xycoon.com/histogram.htm','Frequency Table (Histogram)',''),6,TRUE) a<-table.row.end(a) a<-table.row.start(a) a<-table.element(a,'Bins',header=TRUE) a<-table.element(a,'Midpoint',header=TRUE) a<-table.element(a,'Abs. Frequency',header=TRUE) a<-table.element(a,'Rel. Frequency',header=TRUE) a<-table.element(a,'Cumul. Rel. Freq.',header=TRUE) a<-table.element(a,'Density',header=TRUE) a<-table.row.end(a) crf <- 0 if (par3 == FALSE) mybracket <- '[' else mybracket <- ']' mynumrows <- (length(myhist$breaks)-1) for (i in 1:mynumrows) { a<-table.row.start(a) if (i == 1) dum <- paste('[',myhist$breaks[i],sep='') else dum <- paste(mybracket,myhist$breaks[i],sep='') dum <- paste(dum,myhist$breaks[i+1],sep=',') if (i==mynumrows) dum <- paste(dum,']',sep='') else dum <- paste(dum,mybracket,sep='') a<-table.element(a,dum,header=TRUE) a<-table.element(a,myhist$mids[i]) a<-table.element(a,myhist$counts[i]) rf <- myhist$counts[i]/n crf <- crf + rf a<-table.element(a,round(rf,6)) a<-table.element(a,round(crf,6)) a<-table.element(a,round(myhist$density[i],6)) a<-table.row.end(a) } a<-table.end(a) table.save(a,file='mytable.tab') } else { mytab reltab <- mytab / sum(mytab) n <- length(mytab) load(file='createtable') a<-table.start() a<-table.row.start(a) a<-table.element(a,'Frequency Table (Categorical Data)',3,TRUE) a<-table.row.end(a) a<-table.row.start(a) a<-table.element(a,'Category',header=TRUE) a<-table.element(a,'Abs. Frequency',header=TRUE) a<-table.element(a,'Rel. Frequency',header=TRUE) a<-table.row.end(a) for (i in 1:n) { a<-table.row.start(a) a<-table.element(a,labels(mytab)$x[i],header=TRUE) a<-table.element(a,mytab[i]) a<-table.element(a,round(reltab[i],4)) a<-table.row.end(a) } a<-table.end(a) table.save(a,file='mytable1.tab') } | ||||||||||||||||||||||||||||||||||||||||||||||||||||||||||||||||||||||||||||||||||||||||||||||
Copyright

This work is licensed under a
Creative Commons Attribution-Noncommercial-Share Alike 3.0 License.
Software written by Ed van Stee & Patrick Wessa
Disclaimer
Information provided on this web site is provided "AS IS" without warranty of any kind, either express or implied, including, without limitation, warranties of merchantability, fitness for a particular purpose, and noninfringement. We use reasonable efforts to include accurate and timely information and periodically update the information, and software without notice. However, we make no warranties or representations as to the accuracy or completeness of such information (or software), and we assume no liability or responsibility for errors or omissions in the content of this web site, or any software bugs in online applications. Your use of this web site is AT YOUR OWN RISK. Under no circumstances and under no legal theory shall we be liable to you or any other person for any direct, indirect, special, incidental, exemplary, or consequential damages arising from your access to, or use of, this web site.
Privacy Policy
We may request personal information to be submitted to our servers in order to be able to:
- personalize online software applications according to your needs
- enforce strict security rules with respect to the data that you upload (e.g. statistical data)
- manage user sessions of online applications
- alert you about important changes or upgrades in resources or applications
We NEVER allow other companies to directly offer registered users information about their products and services. Banner references and hyperlinks of third parties NEVER contain any personal data of the visitor.
We do NOT sell, nor transmit by any means, personal information, nor statistical data series uploaded by you to third parties.
We carefully protect your data from loss, misuse, alteration,
and destruction. However, at any time, and under any circumstance you
are solely responsible for managing your passwords, and keeping them
secret.
We store a unique ANONYMOUS USER ID in the form of a small 'Cookie' on your computer. This allows us to track your progress when using this website which is necessary to create state-dependent features. The cookie is used for NO OTHER PURPOSE. At any time you may opt to disallow cookies from this website - this will not affect other features of this website.
We examine cookies that are used by third-parties (banner and online ads) very closely: abuse from third-parties automatically results in termination of the advertising contract without refund. We have very good reason to believe that the cookies that are produced by third parties (banner ads) do NOT cause any privacy or security risk.
FreeStatistics.org is safe. There is no need to download any software to use the applications and services contained in this website. Hence, your system's security is not compromised by their use, and your personal data - other than data you submit in the account application form, and the user-agent information that is transmitted by your browser - is never transmitted to our servers.
As a general rule, we do not log on-line behavior of individuals (other than normal logging of webserver 'hits'). However, in cases of abuse, hacking, unauthorized access, Denial of Service attacks, illegal copying, hotlinking, non-compliance with international webstandards (such as robots.txt), or any other harmful behavior, our system engineers are empowered to log, track, identify, publish, and ban misbehaving individuals - even if this leads to ban entire blocks of IP addresses, or disclosing user's identity.