Free Statistics

of Irreproducible Research!

Author's title

Author*Unverified author*
R Software Modulerwasp_sdplot.wasp
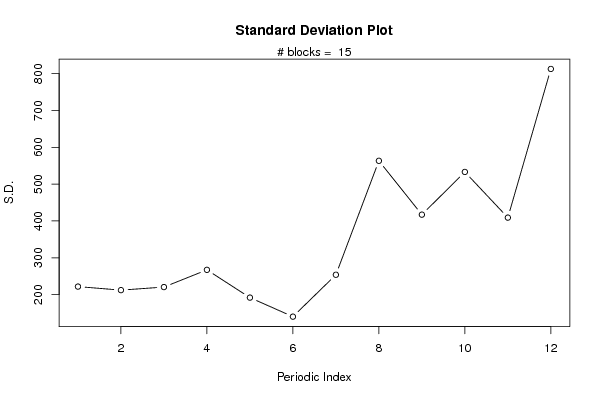
Title produced by softwareStandard Deviation Plot
Date of computationFri, 22 May 2009 02:11:32 -0600
Cite this page as followsStatistical Computations at FreeStatistics.org, Office for Research Development and Education, URL https://freestatistics.org/blog/index.php?v=date/2009/May/22/t12429799397fr3ukh43p4hi96.htm/, Retrieved Fri, 01 Nov 2024 00:38:04 +0000
Statistical Computations at FreeStatistics.org, Office for Research Development and Education, URL https://freestatistics.org/blog/index.php?pk=40285, Retrieved Fri, 01 Nov 2024 00:38:04 +0000
QR Codes:

Original text written by user:
IsPrivate?No (this computation is public)
User-defined keywords
Estimated Impact205
Family? (F = Feedback message, R = changed R code, M = changed R Module, P = changed Parameters, D = changed Data)
-       [Standard Deviation Plot] [Cijferreeks - Con...] [2009-05-22 08:11:32] [b527803d8be4913968ad45e628c1cc71] [Current]
Feedback Forum

Post a new message
Dataseries X:
1686
1591
2304
1712
1471
1377
1966
2453
1984
2596
4087
5179
1530
1523
1633
1976
1170
1480
1781
2472
1981
2273
3857
4551
1510
1329
1518
1790
1537
1449
1954
1897
1706
2514
3593
4524
1609
1638
2030
1375
1320
1245
1600
2298
2191
2511
3440
4923
1609
1435
2061
1789
1567
1404
1597
3159
1759
2504
4273
5274
1771
1682
1846
1589
1896
1379
1645
2512
1771
3727
4388
5434
1606
1523
1577
1605
1765
1403
2584
3318
1562
2349
3987
5891
1389
1442
1548
1935
1518
1250
1847
1930
2638
3114
4405
7242
1853
1779
2108
2336
1728
1661
2230
1645
2421
3740
4988
6757
1757
1394
1982
1650
1654
1406
1971
1968
2608
3845
4514
6694
1720
1321
1859
1628
1615
1457
1899
1605
2424
3116
4286
6047
1902
2049
1874
1279
1432
1540
2214
1857
2408
3252
3627
6153
1577
1667
1993
1997
1783
1625
2076
1773
2377
3088
4096
6119
1494
1564
1898
2121
1831
1515
2048
2795
1749
3339
4227
6410
1197
1968
1720
1725
1674
1693
2031
1495
2968
3385
3729
5999
1070
1402
1897
1862
1670
1688
2031


Summary of computational transaction
Raw Inputview raw input (R code)
Raw Outputview raw output of R engine
Computing time2 seconds
R Server'Gwilym Jenkins' @ 72.249.127.135

\begin{tabular}{lllllllll}
\hline
Summary of computational transaction \tabularnewline
Raw Input & view raw input (R code)  \tabularnewline
Raw Output & view raw output of R engine  \tabularnewline
Computing time & 2 seconds \tabularnewline
R Server & 'Gwilym Jenkins' @ 72.249.127.135 \tabularnewline
\hline
\end{tabular}
%Source: https://freestatistics.org/blog/index.php?pk=40285&T=0

[TABLE]
[ROW][C]Summary of computational transaction[/C][/ROW]
[ROW][C]Raw Input[/C][C]view raw input (R code) [/C][/ROW]
[ROW][C]Raw Output[/C][C]view raw output of R engine [/C][/ROW]
[ROW][C]Computing time[/C][C]2 seconds[/C][/ROW]
[ROW][C]R Server[/C][C]'Gwilym Jenkins' @ 72.249.127.135[/C][/ROW]
[/TABLE]
Source: https://freestatistics.org/blog/index.php?pk=40285&T=0

Globally Unique Identifier (entire table): ba.freestatistics.org/blog/index.php?pk=40285&T=0

As an alternative you can also use a QR Code:  

The GUIDs for individual cells are displayed in the table below:

Summary of computational transaction
Raw Inputview raw input (R code)
Raw Outputview raw output of R engine
Computing time2 seconds
R Server'Gwilym Jenkins' @ 72.249.127.135


Parameters (Session):
par1 = 12 ;
Parameters (R input):
par1 = 12 ;
R code (references can be found in the software module):
par1 <- as.numeric(par1)
(n <- length(x))
(np <- floor(n / par1))
arr <- array(NA,dim=c(par1,np+1))
ari <- array(0,dim=par1)
j <- 0
for (i in 1:n)
{
j = j + 1
ari[j] = ari[j] + 1
arr[j,ari[j]] <- x[i]
if (j == par1) j = 0
}
ari
arr
arr.sd <- array(NA,dim=par1)
arr.range <- array(NA,dim=par1)
arr.iqr <- array(NA,dim=par1)
for (j in 1:par1)
{
arr.sd[j] <- sqrt(var(arr[j,],na.rm=TRUE))
arr.range[j] <- max(arr[j,],na.rm=TRUE) - min(arr[j,],na.rm=TRUE)
arr.iqr[j] <- quantile(arr[j,],0.75,na.rm=TRUE) - quantile(arr[j,],0.25,na.rm=TRUE)
}
overall.sd <- sqrt(var(x))
overall.range <- max(x) - min(x)
overall.iqr <- quantile(x,0.75) - quantile(x,0.25)
bitmap(file='plot1.png')
plot(arr.sd,type='b',ylab='S.D.',main='Standard Deviation Plot',xlab='Periodic Index')
mtext(paste('# blocks = ',np))
abline(overall.sd,0)
dev.off()
bitmap(file='plot2.png')
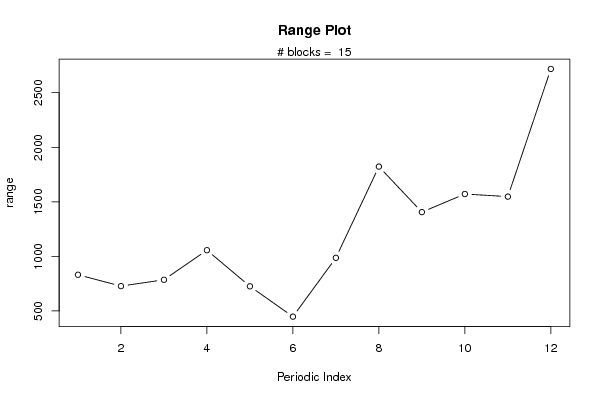
plot(arr.range,type='b',ylab='range',main='Range Plot',xlab='Periodic Index')
mtext(paste('# blocks = ',np))
abline(overall.range,0)
dev.off()
bitmap(file='plot3.png')
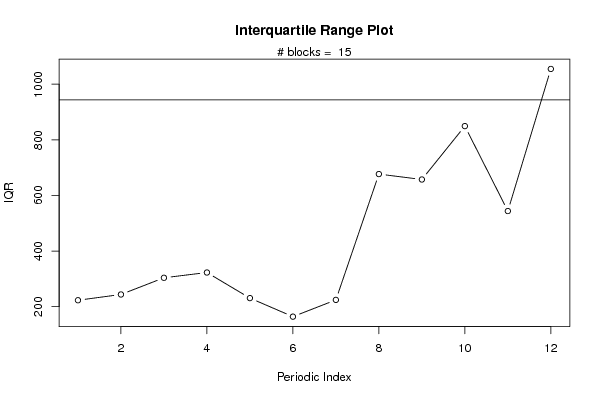
plot(arr.iqr,type='b',ylab='IQR',main='Interquartile Range Plot',xlab='Periodic Index')
mtext(paste('# blocks = ',np))
abline(overall.iqr,0)
dev.off()
bitmap(file='plot4.png')
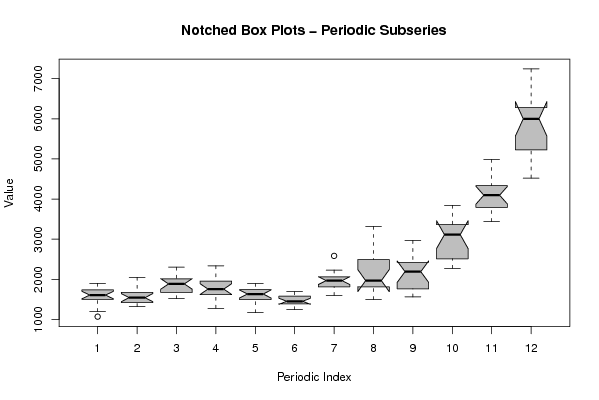
z <- data.frame(t(arr))
names(z) <- c(1:par1)
(boxplot(z,notch=TRUE,col='grey',xlab='Periodic Index',ylab='Value',main='Notched Box Plots - Periodic Subseries'))
dev.off()
bitmap(file='plot5.png')
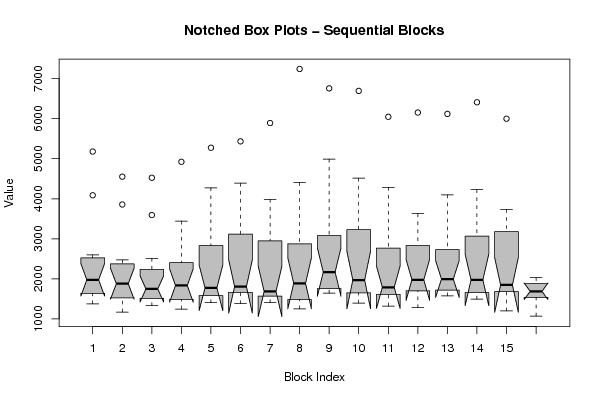
z <- data.frame(arr)
names(z) <- c(1:np)
(boxplot(z,notch=TRUE,col='grey',xlab='Block Index',ylab='Value',main='Notched Box Plots - Sequential Blocks'))
dev.off()
bitmap(file='plot6.png')
z <- data.frame(cbind(arr.sd,arr.range,arr.iqr))
names(z) <- list('S.D.','Range','IQR')
(boxplot(z,notch=TRUE,col='grey',ylab='Overall Variability',main='Notched Box Plots'))
dev.off()