Free Statistics

of Irreproducible Research!

Author's title

Author*Unverified author*
R Software Modulerwasp_correlation.wasp
Title produced by softwarePearson Correlation
Date of computationFri, 17 Oct 2008 09:30:13 -0600
Cite this page as followsStatistical Computations at FreeStatistics.org, Office for Research Development and Education, URL https://freestatistics.org/blog/index.php?v=date/2008/Oct/17/t1224257483m6frg20zqdrdvga.htm/, Retrieved Sun, 19 May 2024 19:56:34 +0000
Statistical Computations at FreeStatistics.org, Office for Research Development and Education, URL https://freestatistics.org/blog/index.php?pk=16499, Retrieved Sun, 19 May 2024 19:56:34 +0000
QR Codes:

Original text written by user:
IsPrivate?No (this computation is public)
User-defined keywordsPC Belgie - Wallonie
Estimated Impact150
Family? (F = Feedback message, R = changed R code, M = changed R Module, P = changed Parameters, D = changed Data)
-     [Pearson Correlation] [Investigating ass...] [2007-10-22 22:08:56] [8cd6641b921d30ebe00b648d1481bba0]
-    D    [Pearson Correlation] [Pearson Correlati...] [2008-10-17 15:30:13] [54e3d3004a715f41ac868f539d95466f] [Current]
Feedback Forum

Post a new message
Dataseries X:
3353
3480
3098
2944
3389
3497
4404
3849
3734
3060
3507
3287
3215
3764
2734
2837
2766
3851
3289
3848
3348
3682
4058
3655
3811
3341
3032
3475
3353
3186
3902
4164
3499
4145
3796
3711
3949
3740
3243
4407
4814
3908
5250
3937
4004
5560
3922
3759
4138
4634
3996
4308
4142
4429
5219
4929
5754
5592
4163
4962
5208
4755
4491
5732
5730
5024
6056
4901
5353
5578
4618
4724
5011
5298
4143
4617
4727
4207
5112
4190
4098
5071
4177
4598
3757
5591
4218
3780
4336
4870
4422
4727
4459
Dataseries Y:
820
829
677
720
846
842
1137
961
1008
872
1094
905
622
1068
760
809
838
1008
838
1057
904
803
810
992
667
803
611
712
785
599
1008
1136
931
1051
956
1006
1077
772
679
787
1011
701
1269
1007
1013
1209
1036
1084
926
1083
912
910
886
948
1134
1226
1515
1491
1086
1274
1164
1205
966
1462
1134
1141
1676
1166
1492
1413
1287
1206
1054
1236
1069
1264
1318
1093
1495
1121
1342
1335
1261
1317
867
1428
1199
961
1195
1225
1282
1629
1187


Summary of computational transaction
Raw Inputview raw input (R code)
Raw Outputview raw output of R engine
Computing time2 seconds
R Server'George Udny Yule' @ 72.249.76.132

\begin{tabular}{lllllllll}
\hline
Summary of computational transaction \tabularnewline
Raw Input & view raw input (R code)  \tabularnewline
Raw Output & view raw output of R engine  \tabularnewline
Computing time & 2 seconds \tabularnewline
R Server & 'George Udny Yule' @ 72.249.76.132 \tabularnewline
\hline
\end{tabular}
%Source: https://freestatistics.org/blog/index.php?pk=16499&T=0

[TABLE]
[ROW][C]Summary of computational transaction[/C][/ROW]
[ROW][C]Raw Input[/C][C]view raw input (R code) [/C][/ROW]
[ROW][C]Raw Output[/C][C]view raw output of R engine [/C][/ROW]
[ROW][C]Computing time[/C][C]2 seconds[/C][/ROW]
[ROW][C]R Server[/C][C]'George Udny Yule' @ 72.249.76.132[/C][/ROW]
[/TABLE]
Source: https://freestatistics.org/blog/index.php?pk=16499&T=0

Globally Unique Identifier (entire table): ba.freestatistics.org/blog/index.php?pk=16499&T=0

As an alternative you can also use a QR Code:  

The GUIDs for individual cells are displayed in the table below:

Summary of computational transaction
Raw Inputview raw input (R code)
Raw Outputview raw output of R engine
Computing time2 seconds
R Server'George Udny Yule' @ 72.249.76.132


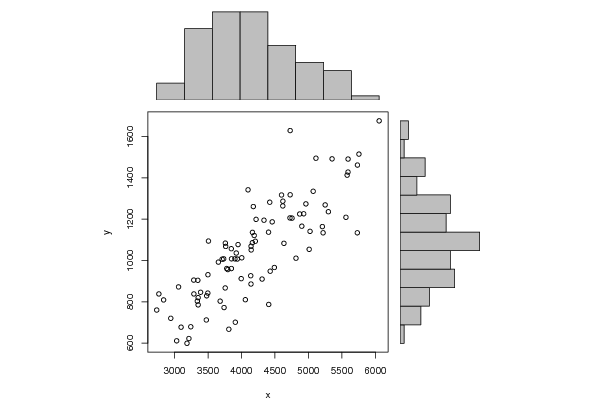
Pearson Product Moment Correlation - Ungrouped Data
StatisticVariable XVariable Y
Mean4197.870967741941050.65591397849
Biased Variance610390.41345820357161.9461209388
Biased Standard Deviation781.274864217583239.085645995193
Covariance155323.737727910
Correlation0.822593657287654
Determination0.676660325009878
T-Test13.7999195296696
p-value (2 sided)0
p-value (1 sided)0
Degrees of Freedom91
Number of Observations93

\begin{tabular}{lllllllll}
\hline
Pearson Product Moment Correlation - Ungrouped Data \tabularnewline
Statistic & Variable X & Variable Y \tabularnewline
Mean & 4197.87096774194 & 1050.65591397849 \tabularnewline
Biased Variance & 610390.413458203 & 57161.9461209388 \tabularnewline
Biased Standard Deviation & 781.274864217583 & 239.085645995193 \tabularnewline
Covariance & 155323.737727910 \tabularnewline
Correlation & 0.822593657287654 \tabularnewline
Determination & 0.676660325009878 \tabularnewline
T-Test & 13.7999195296696 \tabularnewline
p-value (2 sided) & 0 \tabularnewline
p-value (1 sided) & 0 \tabularnewline
Degrees of Freedom & 91 \tabularnewline
Number of Observations & 93 \tabularnewline
\hline
\end{tabular}
%Source: https://freestatistics.org/blog/index.php?pk=16499&T=1

[TABLE]
[ROW][C]Pearson Product Moment Correlation - Ungrouped Data[/C][/ROW]
[ROW][C]Statistic[/C][C]Variable X[/C][C]Variable Y[/C][/ROW]
[ROW][C]Mean[/C][C]4197.87096774194[/C][C]1050.65591397849[/C][/ROW]
[ROW][C]Biased Variance[/C][C]610390.413458203[/C][C]57161.9461209388[/C][/ROW]
[ROW][C]Biased Standard Deviation[/C][C]781.274864217583[/C][C]239.085645995193[/C][/ROW]
[ROW][C]Covariance[/C][C]155323.737727910[/C][/ROW]
[ROW][C]Correlation[/C][C]0.822593657287654[/C][/ROW]
[ROW][C]Determination[/C][C]0.676660325009878[/C][/ROW]
[ROW][C]T-Test[/C][C]13.7999195296696[/C][/ROW]
[ROW][C]p-value (2 sided)[/C][C]0[/C][/ROW]
[ROW][C]p-value (1 sided)[/C][C]0[/C][/ROW]
[ROW][C]Degrees of Freedom[/C][C]91[/C][/ROW]
[ROW][C]Number of Observations[/C][C]93[/C][/ROW]
[/TABLE]
Source: https://freestatistics.org/blog/index.php?pk=16499&T=1

Globally Unique Identifier (entire table): ba.freestatistics.org/blog/index.php?pk=16499&T=1

As an alternative you can also use a QR Code:  

The GUIDs for individual cells are displayed in the table below:

Pearson Product Moment Correlation - Ungrouped Data
StatisticVariable XVariable Y
Mean4197.870967741941050.65591397849
Biased Variance610390.41345820357161.9461209388
Biased Standard Deviation781.274864217583239.085645995193
Covariance155323.737727910
Correlation0.822593657287654
Determination0.676660325009878
T-Test13.7999195296696
p-value (2 sided)0
p-value (1 sided)0
Degrees of Freedom91
Number of Observations93


Parameters (Session):
Parameters (R input):
R code (references can be found in the software module):
bitmap(file='test1.png')
histx <- hist(x, plot=FALSE)
histy <- hist(y, plot=FALSE)
maxcounts <- max(c(histx$counts, histx$counts))
xrange <- c(min(x),max(x))
yrange <- c(min(y),max(y))
nf <- layout(matrix(c(2,0,1,3),2,2,byrow=TRUE), c(3,1), c(1,3), TRUE)
par(mar=c(4,4,1,1))
plot(x, y, xlim=xrange, ylim=yrange, xlab=xlab, ylab=ylab)
par(mar=c(0,4,1,1))
barplot(histx$counts, axes=FALSE, ylim=c(0, maxcounts), space=0)
par(mar=c(4,0,1,1))
barplot(histy$counts, axes=FALSE, xlim=c(0, maxcounts), space=0, horiz=TRUE)
dev.off()
lx = length(x)
makebiased = (lx-1)/lx
varx = var(x)*makebiased
vary = var(y)*makebiased
corxy <- cor.test(x,y,method='pearson')
cxy <- as.matrix(corxy$estimate)[1,1]
load(file='createtable')
a<-table.start()
a<-table.row.start(a)
a<-table.element(a,'Pearson Product Moment Correlation - Ungrouped Data',3,TRUE)
a<-table.row.end(a)
a<-table.row.start(a)
a<-table.element(a,'Statistic',1,TRUE)
a<-table.element(a,'Variable X',1,TRUE)
a<-table.element(a,'Variable Y',1,TRUE)
a<-table.row.end(a)
a<-table.row.start(a)
a<-table.element(a,hyperlink('arithmetic_mean.htm','Mean',''),header=TRUE)
a<-table.element(a,mean(x))
a<-table.element(a,mean(y))
a<-table.row.end(a)
a<-table.row.start(a)
a<-table.element(a,hyperlink('biased.htm','Biased Variance',''),header=TRUE)
a<-table.element(a,varx)
a<-table.element(a,vary)
a<-table.row.end(a)
a<-table.row.start(a)
a<-table.element(a,hyperlink('biased1.htm','Biased Standard Deviation',''),header=TRUE)
a<-table.element(a,sqrt(varx))
a<-table.element(a,sqrt(vary))
a<-table.row.end(a)
a<-table.row.start(a)
a<-table.element(a,hyperlink('covariance.htm','Covariance',''),header=TRUE)
a<-table.element(a,cov(x,y),2)
a<-table.row.end(a)
a<-table.row.start(a)
a<-table.element(a,hyperlink('pearson_correlation.htm','Correlation',''),header=TRUE)
a<-table.element(a,cxy,2)
a<-table.row.end(a)
a<-table.row.start(a)
a<-table.element(a,hyperlink('coeff_of_determination.htm','Determination',''),header=TRUE)
a<-table.element(a,cxy*cxy,2)
a<-table.row.end(a)
a<-table.row.start(a)
a<-table.element(a,hyperlink('ttest_statistic.htm','T-Test',''),header=TRUE)
a<-table.element(a,as.matrix(corxy$statistic)[1,1],2)
a<-table.row.end(a)
a<-table.row.start(a)
a<-table.element(a,'p-value (2 sided)',header=TRUE)
a<-table.element(a,(p2 <- as.matrix(corxy$p.value)[1,1]),2)
a<-table.row.end(a)
a<-table.row.start(a)
a<-table.element(a,'p-value (1 sided)',header=TRUE)
a<-table.element(a,p2/2,2)
a<-table.row.end(a)
a<-table.row.start(a)
a<-table.element(a,'Degrees of Freedom',header=TRUE)
a<-table.element(a,lx-2,2)
a<-table.row.end(a)
a<-table.row.start(a)
a<-table.element(a,'Number of Observations',header=TRUE)
a<-table.element(a,lx,2)
a<-table.row.end(a)
a<-table.end(a)
table.save(a,file='mytable.tab')