Chic and sleek functions for beautiful statisticians.
snazzieR formats regression output for R Markdown reports. Its tables come out as LaTeX for PDF documents or as plain text for the console, and its plots share one ggplot2 theme and a palette of 35 named colors.
# Released version, from CRAN
install.packages("snazzieR")

# Development version, from GitHub
# install.packages("remotes")
remotes::install_github("DetectiveFierce/snazzieR")| Task | Functions |
|---|---|
| Summarize a linear model | model.summary.table(),
ANOVA.summary.table(), model.equation() |
| Check a fitted model | diagnostics.plots(),
marginal.model.plots(),
unusual.points.table(), VIF.table() |
| Partial least squares | pls.regression(), SVD.pls(),
NIPALS.pls(), pls.summary() |
| Ridge regression | ridge.regression(), ridge.summary() |
| Eigenvalues of a correlation or covariance matrix | eigen.summary() |
| Plot styling | snazzieR.theme(), color.ref(), and colors
such as Red and Dark.Blue |
library(snazzieR)

model <- lm(mpg ~ wt + hp, data = mtcars)

# Coefficients, fit statistics and the fitted equation in one table.
# Returns LaTeX by default; latex = FALSE prints to the console.
model.summary.table(model, title = "Fuel Economy", latex = FALSE)

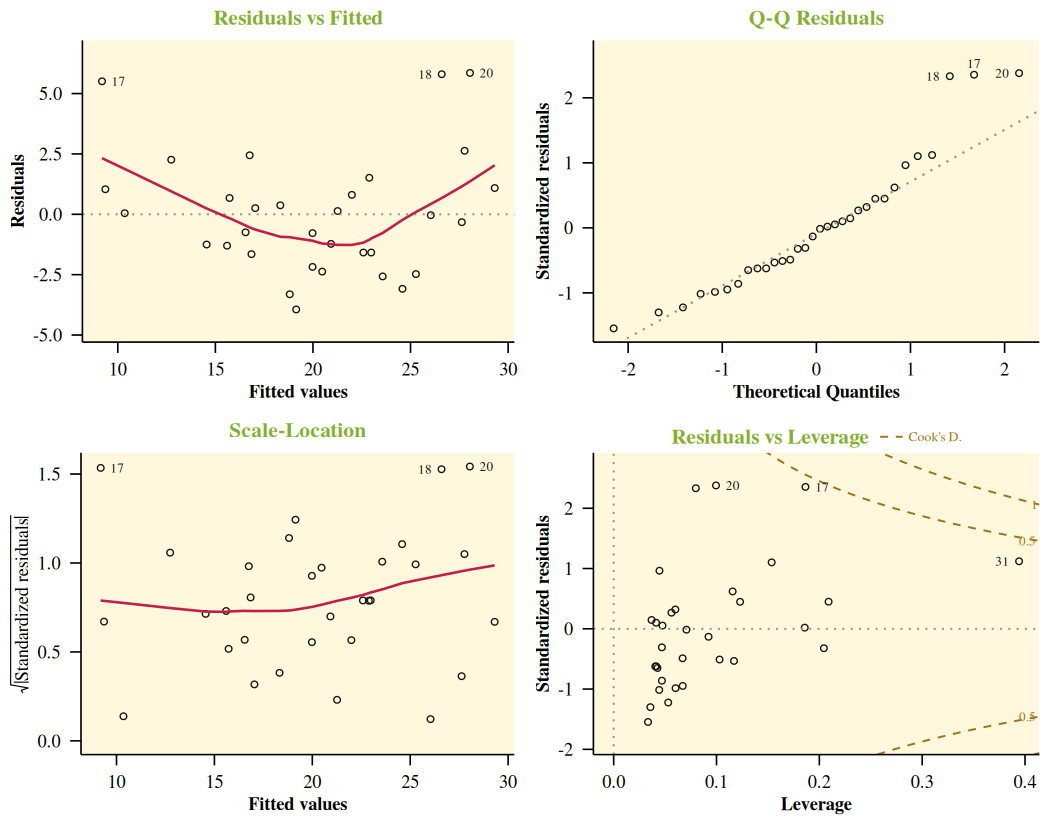
# The four plot(lm) panels as ggplots
diagnostics.plots(model)

# Observations worth a second look, labelled by car name
unusual.points.table(model, latex = FALSE, id = rownames(mtcars))

# Variance inflation factors
VIF.table(model, latex = FALSE)
A LaTeX table has nothing to show when you run a chunk with the “Run”
button, so snazzieR tables print an HTML preview in RStudio and Positron
and a plain-text preview in other interactive sessions. Knitting
produces the LaTeX. Set options(snazzieR.preview = "html"),
"text" or "latex" to pick one;
?snazzieR_table has the details.
Report bugs at https://github.com/DetectiveFierce/snazzieR/issues.
MIT