Free Statistics
of Irreproducible Research!
Description of Statistical Computation | ||||||||||||||||||||||||||||||||||||||||||||||||||||||
|---|---|---|---|---|---|---|---|---|---|---|---|---|---|---|---|---|---|---|---|---|---|---|---|---|---|---|---|---|---|---|---|---|---|---|---|---|---|---|---|---|---|---|---|---|---|---|---|---|---|---|---|---|---|---|
| Author's title | ||||||||||||||||||||||||||||||||||||||||||||||||||||||
| Author | *The author of this computation has been verified* | |||||||||||||||||||||||||||||||||||||||||||||||||||||
| R Software Module | rwasp_univariatedataseries.wasp | |||||||||||||||||||||||||||||||||||||||||||||||||||||
| Title produced by software | Univariate Data Series | |||||||||||||||||||||||||||||||||||||||||||||||||||||
| Date of computation | Mon, 16 Oct 2017 15:00:41 +0200 | |||||||||||||||||||||||||||||||||||||||||||||||||||||
| Cite this page as follows | Statistical Computations at FreeStatistics.org, Office for Research Development and Education, URL https://freestatistics.org/blog/index.php?v=date/2017/Oct/16/t1508158999d1d89i18itjj1u7.htm/, Retrieved Sat, 11 May 2024 06:18:25 +0200 | |||||||||||||||||||||||||||||||||||||||||||||||||||||
| Statistical Computations at FreeStatistics.org, Office for Research Development and Education, URL https://freestatistics.org/blog/index.php?pk=, Retrieved Sat, 11 May 2024 06:18:25 +0200 | ||||||||||||||||||||||||||||||||||||||||||||||||||||||
| QR Codes: | ||||||||||||||||||||||||||||||||||||||||||||||||||||||
|
| ||||||||||||||||||||||||||||||||||||||||||||||||||||||
| Original text written by user: | ||||||||||||||||||||||||||||||||||||||||||||||||||||||
| IsPrivate? | This computation is private | |||||||||||||||||||||||||||||||||||||||||||||||||||||
| User-defined keywords | prévisions | |||||||||||||||||||||||||||||||||||||||||||||||||||||
| Estimated Impact | 0 | |||||||||||||||||||||||||||||||||||||||||||||||||||||
Tree of Dependent Computations | ||||||||||||||||||||||||||||||||||||||||||||||||||||||
Dataset | ||||||||||||||||||||||||||||||||||||||||||||||||||||||
| Dataseries X: | ||||||||||||||||||||||||||||||||||||||||||||||||||||||
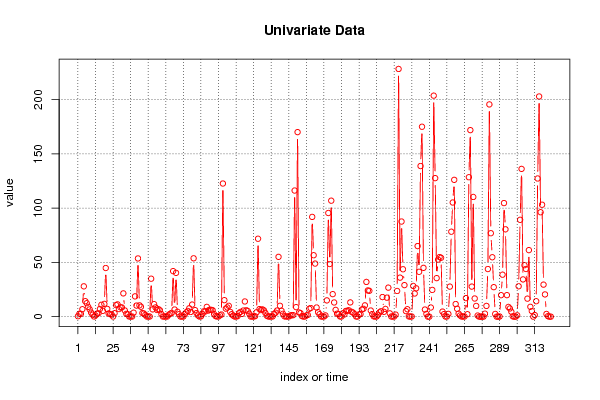
0.402777778 2.615740741 2.541666667 6.856481481 27.96296296 14.23611111 12.38425926 9.027777778 6.675925926 3.75 1.763888889 0.125 1.046296296 2.759259259 3.111111111 7.074074074 10.94444444 5.37962963 11.79166667 44.83333333 7.138888889 2.898148148 2.333333333 1.902777778 0.12037037 3.185185185 10.66666667 11.34722222 6.99537037 8.601851852 8.50462963 21.45833333 5.675925926 2.611111111 2.333333333 0.125 0.12037037 0.125 3.648148148 18.71296296 10.20833333 53.65740741 10.43055556 9.101851852 3.296296296 2.898148148 1.62037037 0.125 0.12037037 0.125 34.97222222 6.717592593 11.50925926 8.486111111 6.111111111 6.87962963 5.824074074 2.328703704 0.125 0.125 0.12037037 0.125 1.759259259 2.615740741 3.402777778 41.97685185 6.569444444 40.34259259 4.537037037 2.25462963 0.125 0.125 0.12037037 2.402777778 4.037037037 5.25 7.708333333 4.314814815 11.13425926 53.7962963 6.032407407 3.291666667 1.12037037 0.125 0.263888889 2.472222222 4.893518519 4.828703704 9.00462963 5.634259259 6.328703704 6.287037037 5.87962963 2.328703704 0.481481481 0.125 0.12037037 1.263888889 1.972222222 122.7314815 15.19907407 7.388888889 8.49537037 9.990740741 4.398148148 2.25462963 0.976851852 0.125 0.12037037 0.407407407 3.185185185 4.398148148 2.472222222 5.638888889 13.99074074 5.888888889 5.180555556 2.75462963 0.125 0.125 0.12037037 0.407407407 4.041666667 71.80555556 6.967592593 6.092592593 6.680555556 5.814814815 3.472222222 0.833333333 0.125 0.125 0.12037037 0.236111111 2.62037037 3.601851852 5.634259259 55.13888889 9.981481481 5.476851852 2.652777778 0.361111111 0.180555556 0.125 0.12037037 1.069444444 1.319444444 1.388888889 116.25 8.791666667 170.0925926 3.87962963 3.25 0.513888889 0.125 0.125 1.115740741 1.546296296 7.25462963 7.958333333 91.94444444 56.62037037 48.93518519 8.435185185 4.111111111 2.25462963 0.125 0.125 0.12037037 1.171296296 14.99537037 95.55555556 48.51851852 106.8981481 20.75462963 13.08333333 6.24537037 2.685185185 2.333333333 0.194444444 0.12037037 3.185185185 2.115740741 5.25 5.430555556 5.888888889 13.12962963 4.393518519 3.611111111 2.25462963 0.125 0.125 2.046296296 2.333333333 6.652777778 7.24537037 10.41666667 32.02777778 24.15740741 23.85185185 5.643518519 2.398148148 0.268518519 0.125 0.12037037 1.763888889 4.027777778 4.967592593 18.0787037 4.453703704 7.134259259 17.49537037 26.73148148 3.037037037 0.125 0.125 0.12037037 1.87037037 23.6712963 228.3333333 35.94907407 87.68518519 43.70833333 29.06018519 5.106481481 6.847222222 0.194444444 0.125 0.12037037 28.2962963 21.35185185 26.14351852 65.0462963 41.33333333 138.8425926 175.0462963 44.99074074 6.564814815 2.546296296 0 0 8.439814815 24.62962963 203.7037037 127.6851852 35.50925926 52.59259259 54.90740741 54.25925926 4.675925926 2.333333333 0.125 0.12037037 2.546296296 27.69444444 78.28703704 105.2314815 126.1111111 11.62962963 7.263888889 2.759259259 1.115740741 0.125 0.125 0.12037037 17.09722222 2.25462963 128.5185185 171.9444444 27.70833333 110.3240741 16.74074074 9.851851852 1.027777778 0 0 0 0 2.722222222 9.898148148 43.89351852 195.6481481 76.89814815 54.76851852 27.18981481 2.509259259 0 0 0.12037037 19.81018519 38.66666667 104.7222222 80.50925926 19.8287037 8.953703704 7.523148148 4.537037037 0.300925926 0 0 1.24537037 28 89.25925926 136.2037037 34.3287037 47.40740741 43.93055556 16.58796296 61.34259259 9.060185185 5.180555556 0 1.476851852 14.25 127.3611111 202.962963 96.25 103.1481481 29.48611111 20.49074074 2.472222222 0.449074074 0 0 | ||||||||||||||||||||||||||||||||||||||||||||||||||||||
Tables (Output of Computation) | ||||||||||||||||||||||||||||||||||||||||||||||||||||||
| ||||||||||||||||||||||||||||||||||||||||||||||||||||||
Figures (Output of Computation) | ||||||||||||||||||||||||||||||||||||||||||||||||||||||
Input Parameters & R Code | ||||||||||||||||||||||||||||||||||||||||||||||||||||||
| Parameters (Session): | ||||||||||||||||||||||||||||||||||||||||||||||||||||||
| par1 = el mkaceb ; par4 = 12 ; | ||||||||||||||||||||||||||||||||||||||||||||||||||||||
| Parameters (R input): | ||||||||||||||||||||||||||||||||||||||||||||||||||||||
| par1 = el mkaceb ; par2 = ; par3 = ; par4 = 12 ; | ||||||||||||||||||||||||||||||||||||||||||||||||||||||
| R code (references can be found in the software module): | ||||||||||||||||||||||||||||||||||||||||||||||||||||||
if (par4 != 'No season') { | ||||||||||||||||||||||||||||||||||||||||||||||||||||||