Free Statistics

of Irreproducible Research!

Author's title

Author*Unverified author*
R Software Modulerwasp_concentration.wasp
Title produced by softwareConcentration and Inequality
Date of computationSun, 01 Oct 2017 21:31:15 +0200
Cite this page as followsStatistical Computations at FreeStatistics.org, Office for Research Development and Education, URL https://freestatistics.org/blog/index.php?v=date/2017/Oct/01/t15068863807kfj9o9beki4xut.htm/, Retrieved Sat, 11 May 2024 23:10:49 +0000
Statistical Computations at FreeStatistics.org, Office for Research Development and Education, URL https://freestatistics.org/blog/index.php?pk=307885, Retrieved Sat, 11 May 2024 23:10:49 +0000
QR Codes:

Original text written by user:
IsPrivate?No (this computation is public)
User-defined keywords
Estimated Impact174
Family? (F = Feedback message, R = changed R code, M = changed R Module, P = changed Parameters, D = changed Data)
-       [Concentration and Inequality] [Ulster County_CFR] [2017-10-01 19:31:15] [d41d8cd98f00b204e9800998ecf8427e] [Current]
Feedback Forum

Post a new message
Dataseries X:
4163
3617
3457
3723
3183
3761
2847
2711
2694
5113
7357
8906
6701
3917
4114
3210


Summary of computational transaction
Raw Input view raw input (R code)
Raw Outputview raw output of R engine
Computing time1 seconds
R ServerBig Analytics Cloud Computing Center

\begin{tabular}{lllllllll}
\hline
Summary of computational transaction \tabularnewline
Raw Input view raw input (R code)  \tabularnewline
Raw Outputview raw output of R engine  \tabularnewline
Computing time1 seconds \tabularnewline
R ServerBig Analytics Cloud Computing Center \tabularnewline
\hline
\end{tabular}
%Source: https://freestatistics.org/blog/index.php?pk=307885&T=0

[TABLE]
[ROW]
Summary of computational transaction[/C][/ROW] [ROW]Raw Input[/C] view raw input (R code) [/C][/ROW] [ROW]Raw Output[/C]view raw output of R engine [/C][/ROW] [ROW]Computing time[/C]1 seconds[/C][/ROW] [ROW]R Server[/C]Big Analytics Cloud Computing Center[/C][/ROW] [/TABLE] Source: https://freestatistics.org/blog/index.php?pk=307885&T=0

Globally Unique Identifier (entire table): ba.freestatistics.org/blog/index.php?pk=307885&T=0

As an alternative you can also use a QR Code:  

The GUIDs for individual cells are displayed in the table below:

Summary of computational transaction
Raw Input view raw input (R code)
Raw Outputview raw output of R engine
Computing time1 seconds
R ServerBig Analytics Cloud Computing Center


Concentration - Ungrouped Data
MeasureValue
Number of Categories16
Maximum Entropy2.77258872223978
Entropy2.70156666012963
Normalised Entropy0.974384205799995
Max. Entropy - Entropy0.0710220621101501
Theil Entropy Index0.0710220621101502
Exponential Index0.067100306974806
Herfindahl0.0725711246801954
Normalised Herfindahl0.0107425329922085
Rosenbluth0.0782939726015047
Gini0.20172654518237
Concentration0.215174981527862
Ricci-Schutz (Pietra)0.154136799378185
Atkinson0.0336212902289399
KolmInf
Coefficient of Variation0.401419973199051
Squared Coefficient of Variation0.161137994883127

\begin{tabular}{lllllllll}
\hline
Concentration - Ungrouped Data \tabularnewline
Measure & Value \tabularnewline
Number of Categories & 16 \tabularnewline
Maximum Entropy & 2.77258872223978 \tabularnewline
Entropy & 2.70156666012963 \tabularnewline
Normalised Entropy & 0.974384205799995 \tabularnewline
Max. Entropy - Entropy & 0.0710220621101501 \tabularnewline
Theil Entropy Index & 0.0710220621101502 \tabularnewline
Exponential Index & 0.067100306974806 \tabularnewline
Herfindahl & 0.0725711246801954 \tabularnewline
Normalised Herfindahl & 0.0107425329922085 \tabularnewline
Rosenbluth & 0.0782939726015047 \tabularnewline
Gini & 0.20172654518237 \tabularnewline
Concentration & 0.215174981527862 \tabularnewline
Ricci-Schutz (Pietra) & 0.154136799378185 \tabularnewline
Atkinson & 0.0336212902289399 \tabularnewline
Kolm & Inf \tabularnewline
Coefficient of Variation & 0.401419973199051 \tabularnewline
Squared Coefficient of Variation & 0.161137994883127 \tabularnewline
\hline
\end{tabular}
%Source: https://freestatistics.org/blog/index.php?pk=307885&T=1

[TABLE]
[ROW][C]Concentration - Ungrouped Data[/C][/ROW]
[ROW][C]Measure[/C][C]Value[/C][/ROW]
[ROW][C]Number of Categories[/C][C]16[/C][/ROW]
[ROW][C]Maximum Entropy[/C][C]2.77258872223978[/C][/ROW]
[ROW][C]Entropy[/C][C]2.70156666012963[/C][/ROW]
[ROW][C]Normalised Entropy[/C][C]0.974384205799995[/C][/ROW]
[ROW][C]Max. Entropy - Entropy[/C][C]0.0710220621101501[/C][/ROW]
[ROW][C]Theil Entropy Index[/C][C]0.0710220621101502[/C][/ROW]
[ROW][C]Exponential Index[/C][C]0.067100306974806[/C][/ROW]
[ROW][C]Herfindahl[/C][C]0.0725711246801954[/C][/ROW]
[ROW][C]Normalised Herfindahl[/C][C]0.0107425329922085[/C][/ROW]
[ROW][C]Rosenbluth[/C][C]0.0782939726015047[/C][/ROW]
[ROW][C]Gini[/C][C]0.20172654518237[/C][/ROW]
[ROW][C]Concentration[/C][C]0.215174981527862[/C][/ROW]
[ROW][C]Ricci-Schutz (Pietra)[/C][C]0.154136799378185[/C][/ROW]
[ROW][C]Atkinson[/C][C]0.0336212902289399[/C][/ROW]
[ROW][C]Kolm[/C][C]Inf[/C][/ROW]
[ROW][C]Coefficient of Variation[/C][C]0.401419973199051[/C][/ROW]
[ROW][C]Squared Coefficient of Variation[/C][C]0.161137994883127[/C][/ROW]
[/TABLE]
Source: https://freestatistics.org/blog/index.php?pk=307885&T=1

Globally Unique Identifier (entire table): ba.freestatistics.org/blog/index.php?pk=307885&T=1

As an alternative you can also use a QR Code:  

The GUIDs for individual cells are displayed in the table below:

Concentration - Ungrouped Data
MeasureValue
Number of Categories16
Maximum Entropy2.77258872223978
Entropy2.70156666012963
Normalised Entropy0.974384205799995
Max. Entropy - Entropy0.0710220621101501
Theil Entropy Index0.0710220621101502
Exponential Index0.067100306974806
Herfindahl0.0725711246801954
Normalised Herfindahl0.0107425329922085
Rosenbluth0.0782939726015047
Gini0.20172654518237
Concentration0.215174981527862
Ricci-Schutz (Pietra)0.154136799378185
Atkinson0.0336212902289399
KolmInf
Coefficient of Variation0.401419973199051
Squared Coefficient of Variation0.161137994883127


Parameters (Session):
Parameters (R input):
R code (references can be found in the software module):
library(ineq)
my_minimum <- min(x)
if(my_minimum < 0) {
stop('Negative values are not allowed.')
}
myLength <- length(x)
myMaximumEntropy <- log(myLength)
mySum <- sum(x)
myProportion <- x/mySum
myEntropy <- -sum(myProportion * log(myProportion))
myNormalizedEntropy <- myEntropy / myMaximumEntropy
myDifference <- myMaximumEntropy - myEntropy
myTheilEntropyIndex <- entropy(x,parameter=1,na.rm=T)
myExponentialIndex <- exp(-myEntropy)
myHerfindahlMeasure <- sum(myProportion^2)
myHerfindahl <- conc(x,type='Herfindahl',na.rm=T)
myRosenbluth <- conc(x,type='Rosenbluth',na.rm=T)
myNormalizedHerfindahlMeasure <- (myHerfindahlMeasure - 1/myLength) / (1 - 1/myLength)
myGini <- Gini(x,na.rm=T)
myConcentrationCoefficient <- myLength/(myLength -1)*myGini
myRS <- RS(x,na.rm=T)
myAtkinson <- Atkinson(x,na.rm=T)
myKolm <- Kolm(x,na.rm=T)
myCoefficientOfVariation <- var.coeff(x,square=F,na.rm=T)
mySquaredCoefficientOfVariation <- var.coeff(x,square=T,na.rm=T)
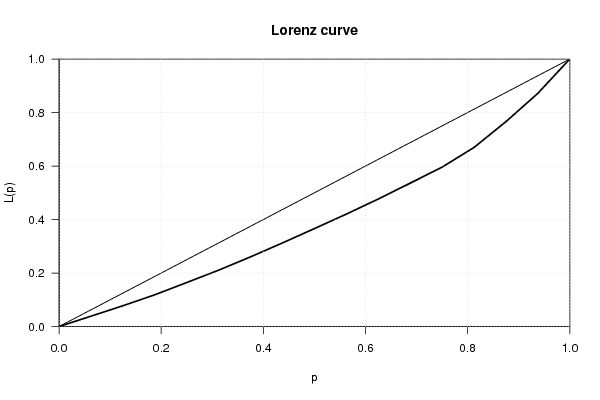
bitmap(file='plot1.png')
plot(Lc(x))
grid()
dev.off()
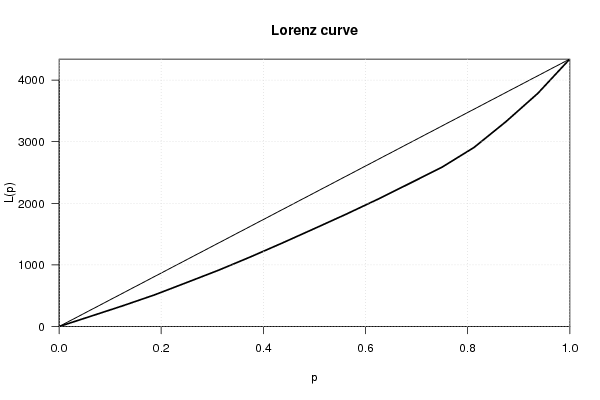
bitmap(file='plot2.png')
plot(Lc(x),general=T)
grid()
dev.off()
load(file='createtable')
a<-table.start()
a<-table.row.start(a)
a<-table.element(a,'Concentration - Ungrouped Data',2,TRUE)
a<-table.row.end(a)
a<-table.row.start(a)
a<-table.element(a,'Measure',header=TRUE)
a<-table.element(a,'Value',header=TRUE)
a<-table.row.end(a)
a<-table.row.start(a)
a<-table.element(a,'Number of Categories',header=F)
a<-table.element(a,myLength,header=F)
a<-table.row.end(a)
a<-table.row.start(a)
a<-table.element(a,'Maximum Entropy',header=F)
a<-table.element(a,myMaximumEntropy,header=F)
a<-table.row.end(a)
a<-table.row.start(a)
a<-table.element(a,'Entropy',header=F)
a<-table.element(a,myEntropy,header=F)
a<-table.row.end(a)
a<-table.row.start(a)
a<-table.element(a,'Normalised Entropy',header=F)
a<-table.element(a,myNormalizedEntropy,header=F)
a<-table.row.end(a)
a<-table.row.start(a)
a<-table.element(a,'Max. Entropy - Entropy',header=F)
a<-table.element(a,myDifference,header=F)
a<-table.row.end(a)
a<-table.row.start(a)
a<-table.element(a,'Theil Entropy Index',header=F)
a<-table.element(a,myTheilEntropyIndex,header=F)
a<-table.row.end(a)
a<-table.row.start(a)
a<-table.element(a,'Exponential Index',header=F)
a<-table.element(a,myExponentialIndex,header=F)
a<-table.row.end(a)
a<-table.row.start(a)
a<-table.element(a,'Herfindahl',header=F)
a<-table.element(a,myHerfindahl,header=F)
a<-table.row.end(a)
a<-table.row.start(a)
a<-table.element(a,'Normalised Herfindahl',header=F)
a<-table.element(a,myNormalizedHerfindahlMeasure,header=F)
a<-table.row.end(a)
a<-table.row.start(a)
a<-table.element(a,'Rosenbluth',header=F)
a<-table.element(a,myRosenbluth,header=F)
a<-table.row.end(a)
a<-table.row.start(a)
a<-table.element(a,'Gini',header=F)
a<-table.element(a,myGini,header=F)
a<-table.row.end(a)
a<-table.row.start(a)
a<-table.element(a,'Concentration',header=F)
a<-table.element(a,myConcentrationCoefficient,header=F)
a<-table.row.end(a)
a<-table.row.start(a)
a<-table.element(a,'Ricci-Schutz (Pietra)',header=F)
a<-table.element(a,myRS,header=F)
a<-table.row.end(a)
a<-table.row.start(a)
a<-table.element(a,'Atkinson',header=F)
a<-table.element(a,myAtkinson,header=F)
a<-table.row.end(a)
a<-table.row.start(a)
a<-table.element(a,'Kolm',header=F)
a<-table.element(a,myKolm,header=F)
a<-table.row.end(a)
a<-table.row.start(a)
a<-table.element(a,'Coefficient of Variation',header=F)
a<-table.element(a,myCoefficientOfVariation,header=F)
a<-table.row.end(a)
a<-table.row.start(a)
a<-table.element(a,'Squared Coefficient of Variation',header=F)
a<-table.element(a,mySquaredCoefficientOfVariation,header=F)
a<-table.row.end(a)
a<-table.end(a)
table.save(a,file='mytable.tab')