Free Statistics

of Irreproducible Research!

Author's title

Author*Unverified author*
R Software Modulerwasp_smp.wasp
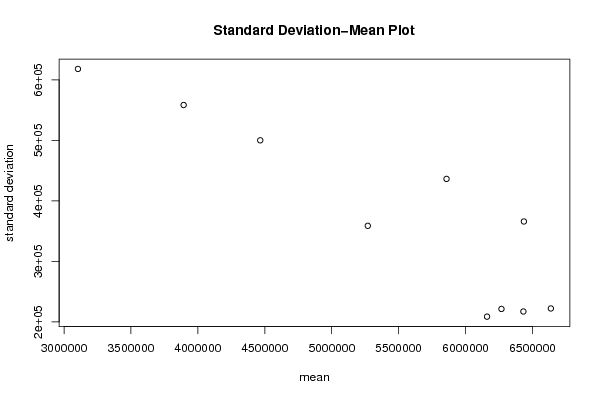
Title produced by softwareStandard Deviation-Mean Plot
Date of computationSun, 30 Jul 2017 19:34:26 +0200
Cite this page as followsStatistical Computations at FreeStatistics.org, Office for Research Development and Education, URL https://freestatistics.org/blog/index.php?v=date/2017/Jul/30/t1501436084ffi9a65ycx99yip.htm/, Retrieved Wed, 15 May 2024 06:12:23 +0000
Statistical Computations at FreeStatistics.org, Office for Research Development and Education, URL https://freestatistics.org/blog/index.php?pk=306820, Retrieved Wed, 15 May 2024 06:12:23 +0000
QR Codes:

Original text written by user:
IsPrivate?No (this computation is public)
User-defined keywords
Estimated Impact127
Family? (F = Feedback message, R = changed R code, M = changed R Module, P = changed Parameters, D = changed Data)
-       [Standard Deviation-Mean Plot] [] [2017-07-30 17:34:26] [bb1ebaef39f3ee233240b5c77a617fca] [Current]
Feedback Forum

Post a new message
Dataseries X:
6195800.00
6172725.00
6149325.00
6100900.00
6579950.00
6554600.00
6195800.00
5957250.00
5980325.00
5980325.00
6006000.00
6052150.00
6123975.00
6123975.00
6077825.00
5957250.00
6579950.00
6674850.00
6531525.00
6195800.00
6339450.00
6123975.00
6221150.00
6267625.00
6316050.00
6195800.00
6221150.00
6052150.00
6579950.00
6746675.00
6603350.00
6339450.00
6626425.00
6316050.00
6603350.00
6579950.00
6651775.00
6387875.00
6674850.00
6651775.00
7082400.00
6985225.00
6603350.00
6410950.00
6674850.00
6316050.00
6579950.00
6626425.00
6723600.00
6508450.00
6626425.00
6698250.00
6962150.00
6746675.00
6459700.00
6149325.00
6436625.00
5646875.00
6029075.00
6244225.00
6459700.00
6149325.00
6149325.00
6149325.00
6316050.00
6077825.00
5765175.00
5503550.00
5693350.00
4952350.00
5406375.00
5670275.00
5718700.00
5454800.00
5477875.00
5406375.00
5646875.00
5477875.00
5144750.00
4903925.00
5311150.00
4426825.00
5001100.00
5262725.00
5262725.00
4952350.00
4665375.00
4642300.00
4903925.00
4665375.00
4211675.00
3899025.00
4234750.00
3445325.00
4162925.00
4544800.00
4665375.00
4401475.00
4068025.00
4306575.00
4401475.00
4329650.00
3611725.00
3278600.00
3516825.00
2799225.00
3540225.00
3804125.00
4019275.00
3660475.00
3324750.00
3516825.00
3611725.00
3421925.00
2704325.00
2391675.00
2678650.00
1889225.00
2750475.00
3278600.00


Summary of computational transaction
Raw Input view raw input (R code)
Raw Outputview raw output of R engine
Computing time1 seconds
R ServerBig Analytics Cloud Computing Center

\begin{tabular}{lllllllll}
\hline
Summary of computational transaction \tabularnewline
Raw Input view raw input (R code)  \tabularnewline
Raw Outputview raw output of R engine  \tabularnewline
Computing time1 seconds \tabularnewline
R ServerBig Analytics Cloud Computing Center \tabularnewline
\hline
\end{tabular}
%Source: https://freestatistics.org/blog/index.php?pk=306820&T=0

[TABLE]
[ROW]
Summary of computational transaction[/C][/ROW] [ROW]Raw Input[/C] view raw input (R code) [/C][/ROW] [ROW]Raw Output[/C]view raw output of R engine [/C][/ROW] [ROW]Computing time[/C]1 seconds[/C][/ROW] [ROW]R Server[/C]Big Analytics Cloud Computing Center[/C][/ROW] [/TABLE] Source: https://freestatistics.org/blog/index.php?pk=306820&T=0

Globally Unique Identifier (entire table): ba.freestatistics.org/blog/index.php?pk=306820&T=0

As an alternative you can also use a QR Code:  

The GUIDs for individual cells are displayed in the table below:

Summary of computational transaction
Raw Input view raw input (R code)
Raw Outputview raw output of R engine
Computing time1 seconds
R ServerBig Analytics Cloud Computing Center


Standard Deviation-Mean Plot
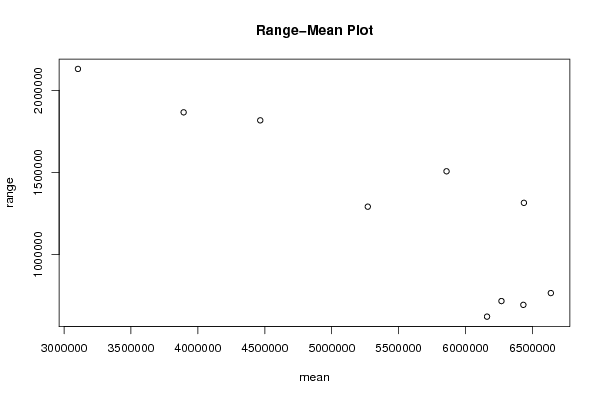
SectionMeanStandard DeviationRange
16160429.16666667208766.576868579622700
26268112.5221515.380006774717600
36431695.83333333217278.386270129694525
46637122.91666667222304.684820164766350
56435947.91666667366082.5489773031315275
65857718.75436468.6998208411507350
75269414.58333333358941.823828031291875
84465879.16666667500284.23010341817400
93893608.33333333558634.4501563751866150
103103993.75618254.272135832130050

\begin{tabular}{lllllllll}
\hline
Standard Deviation-Mean Plot \tabularnewline
Section & Mean & Standard Deviation & Range \tabularnewline
1 & 6160429.16666667 & 208766.576868579 & 622700 \tabularnewline
2 & 6268112.5 & 221515.380006774 & 717600 \tabularnewline
3 & 6431695.83333333 & 217278.386270129 & 694525 \tabularnewline
4 & 6637122.91666667 & 222304.684820164 & 766350 \tabularnewline
5 & 6435947.91666667 & 366082.548977303 & 1315275 \tabularnewline
6 & 5857718.75 & 436468.699820841 & 1507350 \tabularnewline
7 & 5269414.58333333 & 358941.82382803 & 1291875 \tabularnewline
8 & 4465879.16666667 & 500284.2301034 & 1817400 \tabularnewline
9 & 3893608.33333333 & 558634.450156375 & 1866150 \tabularnewline
10 & 3103993.75 & 618254.27213583 & 2130050 \tabularnewline
\hline
\end{tabular}
%Source: https://freestatistics.org/blog/index.php?pk=306820&T=1

[TABLE]
[ROW][C]Standard Deviation-Mean Plot[/C][/ROW]
[ROW][C]Section[/C][C]Mean[/C][C]Standard Deviation[/C][C]Range[/C][/ROW]
[ROW][C]1[/C][C]6160429.16666667[/C][C]208766.576868579[/C][C]622700[/C][/ROW]
[ROW][C]2[/C][C]6268112.5[/C][C]221515.380006774[/C][C]717600[/C][/ROW]
[ROW][C]3[/C][C]6431695.83333333[/C][C]217278.386270129[/C][C]694525[/C][/ROW]
[ROW][C]4[/C][C]6637122.91666667[/C][C]222304.684820164[/C][C]766350[/C][/ROW]
[ROW][C]5[/C][C]6435947.91666667[/C][C]366082.548977303[/C][C]1315275[/C][/ROW]
[ROW][C]6[/C][C]5857718.75[/C][C]436468.699820841[/C][C]1507350[/C][/ROW]
[ROW][C]7[/C][C]5269414.58333333[/C][C]358941.82382803[/C][C]1291875[/C][/ROW]
[ROW][C]8[/C][C]4465879.16666667[/C][C]500284.2301034[/C][C]1817400[/C][/ROW]
[ROW][C]9[/C][C]3893608.33333333[/C][C]558634.450156375[/C][C]1866150[/C][/ROW]
[ROW][C]10[/C][C]3103993.75[/C][C]618254.27213583[/C][C]2130050[/C][/ROW]
[/TABLE]
Source: https://freestatistics.org/blog/index.php?pk=306820&T=1

Globally Unique Identifier (entire table): ba.freestatistics.org/blog/index.php?pk=306820&T=1

As an alternative you can also use a QR Code:  

The GUIDs for individual cells are displayed in the table below:

Standard Deviation-Mean Plot
SectionMeanStandard DeviationRange
16160429.16666667208766.576868579622700
26268112.5221515.380006774717600
36431695.83333333217278.386270129694525
46637122.91666667222304.684820164766350
56435947.91666667366082.5489773031315275
65857718.75436468.6998208411507350
75269414.58333333358941.823828031291875
84465879.16666667500284.23010341817400
93893608.33333333558634.4501563751866150
103103993.75618254.272135832130050


Regression: S.E.(k) = alpha + beta * Mean(k)
alpha987801.064982911
beta-0.113151792219188
S.D.0.0185894327362386
T-STAT-6.08688784777213
p-value0.000293686871073617

\begin{tabular}{lllllllll}
\hline
Regression: S.E.(k) = alpha + beta * Mean(k) \tabularnewline
alpha & 987801.064982911 \tabularnewline
beta & -0.113151792219188 \tabularnewline
S.D. & 0.0185894327362386 \tabularnewline
T-STAT & -6.08688784777213 \tabularnewline
p-value & 0.000293686871073617 \tabularnewline
\hline
\end{tabular}
%Source: https://freestatistics.org/blog/index.php?pk=306820&T=2

[TABLE]
[ROW][C]Regression: S.E.(k) = alpha + beta * Mean(k)[/C][/ROW]
[ROW][C]alpha[/C][C]987801.064982911[/C][/ROW]
[ROW][C]beta[/C][C]-0.113151792219188[/C][/ROW]
[ROW][C]S.D.[/C][C]0.0185894327362386[/C][/ROW]
[ROW][C]T-STAT[/C][C]-6.08688784777213[/C][/ROW]
[ROW][C]p-value[/C][C]0.000293686871073617[/C][/ROW]
[/TABLE]
Source: https://freestatistics.org/blog/index.php?pk=306820&T=2

Globally Unique Identifier (entire table): ba.freestatistics.org/blog/index.php?pk=306820&T=2

As an alternative you can also use a QR Code:  

The GUIDs for individual cells are displayed in the table below:

Regression: S.E.(k) = alpha + beta * Mean(k)
alpha987801.064982911
beta-0.113151792219188
S.D.0.0185894327362386
T-STAT-6.08688784777213
p-value0.000293686871073617


Regression: ln S.E.(k) = alpha + beta * ln Mean(k)
alpha34.2031869415862
beta-1.38589065989076
S.D.0.316605261909549
T-STAT-4.37734563074538
p-value0.00235715681397521
Lambda2.38589065989076

\begin{tabular}{lllllllll}
\hline
Regression: ln S.E.(k) = alpha + beta * ln Mean(k) \tabularnewline
alpha & 34.2031869415862 \tabularnewline
beta & -1.38589065989076 \tabularnewline
S.D. & 0.316605261909549 \tabularnewline
T-STAT & -4.37734563074538 \tabularnewline
p-value & 0.00235715681397521 \tabularnewline
Lambda & 2.38589065989076 \tabularnewline
\hline
\end{tabular}
%Source: https://freestatistics.org/blog/index.php?pk=306820&T=3

[TABLE]
[ROW][C]Regression: ln S.E.(k) = alpha + beta * ln Mean(k)[/C][/ROW]
[ROW][C]alpha[/C][C]34.2031869415862[/C][/ROW]
[ROW][C]beta[/C][C]-1.38589065989076[/C][/ROW]
[ROW][C]S.D.[/C][C]0.316605261909549[/C][/ROW]
[ROW][C]T-STAT[/C][C]-4.37734563074538[/C][/ROW]
[ROW][C]p-value[/C][C]0.00235715681397521[/C][/ROW]
[ROW][C]Lambda[/C][C]2.38589065989076[/C][/ROW]
[/TABLE]
Source: https://freestatistics.org/blog/index.php?pk=306820&T=3

Globally Unique Identifier (entire table): ba.freestatistics.org/blog/index.php?pk=306820&T=3

As an alternative you can also use a QR Code:  

The GUIDs for individual cells are displayed in the table below:

Regression: ln S.E.(k) = alpha + beta * ln Mean(k)
alpha34.2031869415862
beta-1.38589065989076
S.D.0.316605261909549
T-STAT-4.37734563074538
p-value0.00235715681397521
Lambda2.38589065989076


Parameters (Session):
Parameters (R input):
par1 = 12 ;
R code (references can be found in the software module):
par1 <- as.numeric(par1)
(n <- length(x))
(np <- floor(n / par1))
arr <- array(NA,dim=c(par1,np))
j <- 0
k <- 1
for (i in 1:(np*par1))
{
j = j + 1
arr[j,k] <- x[i]
if (j == par1) {
j = 0
k=k+1
}
}
arr
arr.mean <- array(NA,dim=np)
arr.sd <- array(NA,dim=np)
arr.range <- array(NA,dim=np)
for (j in 1:np)
{
arr.mean[j] <- mean(arr[,j],na.rm=TRUE)
arr.sd[j] <- sd(arr[,j],na.rm=TRUE)
arr.range[j] <- max(arr[,j],na.rm=TRUE) - min(arr[,j],na.rm=TRUE)
}
arr.mean
arr.sd
arr.range
(lm1 <- lm(arr.sd~arr.mean))
(lnlm1 <- lm(log(arr.sd)~log(arr.mean)))
(lm2 <- lm(arr.range~arr.mean))
bitmap(file='test1.png')
plot(arr.mean,arr.sd,main='Standard Deviation-Mean Plot',xlab='mean',ylab='standard deviation')
dev.off()
bitmap(file='test2.png')
plot(arr.mean,arr.range,main='Range-Mean Plot',xlab='mean',ylab='range')
dev.off()
load(file='createtable')
a<-table.start()
a<-table.row.start(a)
a<-table.element(a,'Standard Deviation-Mean Plot',4,TRUE)
a<-table.row.end(a)
a<-table.row.start(a)
a<-table.element(a,'Section',header=TRUE)
a<-table.element(a,'Mean',header=TRUE)
a<-table.element(a,'Standard Deviation',header=TRUE)
a<-table.element(a,'Range',header=TRUE)
a<-table.row.end(a)
for (j in 1:np) {
a<-table.row.start(a)
a<-table.element(a,j,header=TRUE)
a<-table.element(a,arr.mean[j])
a<-table.element(a,arr.sd[j] )
a<-table.element(a,arr.range[j] )
a<-table.row.end(a)
}
a<-table.end(a)
table.save(a,file='mytable.tab')
a<-table.start()
a<-table.row.start(a)
a<-table.element(a,'Regression: S.E.(k) = alpha + beta * Mean(k)',2,TRUE)
a<-table.row.end(a)
a<-table.row.start(a)
a<-table.element(a,'alpha',header=TRUE)
a<-table.element(a,lm1$coefficients[[1]])
a<-table.row.end(a)
a<-table.row.start(a)
a<-table.element(a,'beta',header=TRUE)
a<-table.element(a,lm1$coefficients[[2]])
a<-table.row.end(a)
a<-table.row.start(a)
a<-table.element(a,'S.D.',header=TRUE)
a<-table.element(a,summary(lm1)$coefficients[2,2])
a<-table.row.end(a)
a<-table.row.start(a)
a<-table.element(a,'T-STAT',header=TRUE)
a<-table.element(a,summary(lm1)$coefficients[2,3])
a<-table.row.end(a)
a<-table.row.start(a)
a<-table.element(a,'p-value',header=TRUE)
a<-table.element(a,summary(lm1)$coefficients[2,4])
a<-table.row.end(a)
a<-table.end(a)
table.save(a,file='mytable1.tab')
a<-table.start()
a<-table.row.start(a)
a<-table.element(a,'Regression: ln S.E.(k) = alpha + beta * ln Mean(k)',2,TRUE)
a<-table.row.end(a)
a<-table.row.start(a)
a<-table.element(a,'alpha',header=TRUE)
a<-table.element(a,lnlm1$coefficients[[1]])
a<-table.row.end(a)
a<-table.row.start(a)
a<-table.element(a,'beta',header=TRUE)
a<-table.element(a,lnlm1$coefficients[[2]])
a<-table.row.end(a)
a<-table.row.start(a)
a<-table.element(a,'S.D.',header=TRUE)
a<-table.element(a,summary(lnlm1)$coefficients[2,2])
a<-table.row.end(a)
a<-table.row.start(a)
a<-table.element(a,'T-STAT',header=TRUE)
a<-table.element(a,summary(lnlm1)$coefficients[2,3])
a<-table.row.end(a)
a<-table.row.start(a)
a<-table.element(a,'p-value',header=TRUE)
a<-table.element(a,summary(lnlm1)$coefficients[2,4])
a<-table.row.end(a)
a<-table.row.start(a)
a<-table.element(a,'Lambda',header=TRUE)
a<-table.element(a,1-lnlm1$coefficients[[2]])
a<-table.row.end(a)
a<-table.end(a)
table.save(a,file='mytable2.tab')