Free Statistics
of Irreproducible Research!
Description of Statistical Computation | ||||||||||||||||||||||||||||||||||||||||||
|---|---|---|---|---|---|---|---|---|---|---|---|---|---|---|---|---|---|---|---|---|---|---|---|---|---|---|---|---|---|---|---|---|---|---|---|---|---|---|---|---|---|---|
| Author's title | ||||||||||||||||||||||||||||||||||||||||||
| Author | *Unverified author* | |||||||||||||||||||||||||||||||||||||||||
| R Software Module | rwasp_meanversusmedian.wasp | |||||||||||||||||||||||||||||||||||||||||
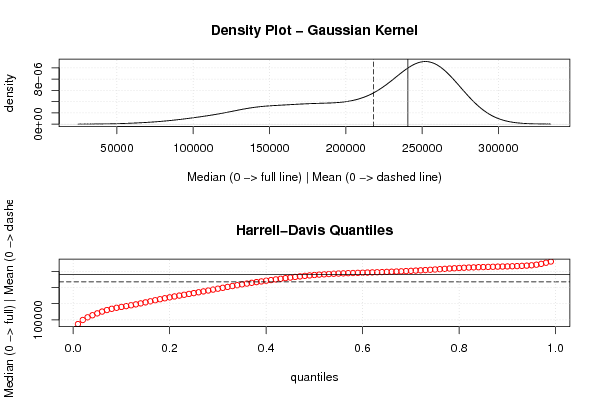
| Title produced by software | Mean versus Median | |||||||||||||||||||||||||||||||||||||||||
| Date of computation | Sat, 29 Jul 2017 20:59:23 +0200 | |||||||||||||||||||||||||||||||||||||||||
| Cite this page as follows | Statistical Computations at FreeStatistics.org, Office for Research Development and Education, URL https://freestatistics.org/blog/index.php?v=date/2017/Jul/29/t1501354776xpraybsyw5504ez.htm/, Retrieved Tue, 14 May 2024 21:59:25 +0000 | |||||||||||||||||||||||||||||||||||||||||
| Statistical Computations at FreeStatistics.org, Office for Research Development and Education, URL https://freestatistics.org/blog/index.php?pk=306806, Retrieved Tue, 14 May 2024 21:59:25 +0000 | ||||||||||||||||||||||||||||||||||||||||||
| QR Codes: | ||||||||||||||||||||||||||||||||||||||||||
|
| ||||||||||||||||||||||||||||||||||||||||||
| Original text written by user: | ||||||||||||||||||||||||||||||||||||||||||
| IsPrivate? | No (this computation is public) | |||||||||||||||||||||||||||||||||||||||||
| User-defined keywords | ||||||||||||||||||||||||||||||||||||||||||
| Estimated Impact | 158 | |||||||||||||||||||||||||||||||||||||||||
Tree of Dependent Computations | ||||||||||||||||||||||||||||||||||||||||||
| Family? (F = Feedback message, R = changed R code, M = changed R Module, P = changed Parameters, D = changed Data) | ||||||||||||||||||||||||||||||||||||||||||
| - [Mean versus Median] [] [2017-07-29 18:59:23] [1a8cec710a8245ea2c14b5d40c333c7c] [Current] | ||||||||||||||||||||||||||||||||||||||||||
| Feedback Forum | ||||||||||||||||||||||||||||||||||||||||||
Post a new message | ||||||||||||||||||||||||||||||||||||||||||
Dataset | ||||||||||||||||||||||||||||||||||||||||||
| Dataseries X: | ||||||||||||||||||||||||||||||||||||||||||
247832.00 246909.00 245973.00 244036.00 263198.00 262184.00 247832.00 238290.00 239213.00 239213.00 240240.00 242086.00 244959.00 244959.00 243113.00 238290.00 263198.00 266994.00 261261.00 247832.00 253578.00 244959.00 248846.00 250705.00 252642.00 247832.00 248846.00 242086.00 263198.00 269867.00 264134.00 253578.00 265057.00 252642.00 264134.00 263198.00 266071.00 255515.00 266994.00 266071.00 283296.00 279409.00 264134.00 256438.00 266994.00 252642.00 263198.00 265057.00 268944.00 260338.00 265057.00 267930.00 278486.00 269867.00 258388.00 245973.00 257465.00 225875.00 241163.00 249769.00 258388.00 245973.00 245973.00 245973.00 252642.00 243113.00 230607.00 220142.00 227734.00 198094.00 216255.00 226811.00 228748.00 218192.00 219115.00 216255.00 225875.00 219115.00 205790.00 196157.00 212446.00 177073.00 200044.00 210509.00 210509.00 198094.00 186615.00 185692.00 196157.00 186615.00 168467.00 155961.00 169390.00 137813.00 166517.00 181792.00 186615.00 176059.00 162721.00 172263.00 176059.00 173186.00 144469.00 131144.00 140673.00 111969.00 141609.00 152165.00 160771.00 146419.00 132990.00 140673.00 144469.00 136877.00 108173.00 95667.00 107146.00 75569.00 110019.00 131144.00 | ||||||||||||||||||||||||||||||||||||||||||
Tables (Output of Computation) | ||||||||||||||||||||||||||||||||||||||||||
| ||||||||||||||||||||||||||||||||||||||||||
Figures (Output of Computation) | ||||||||||||||||||||||||||||||||||||||||||
Input Parameters & R Code | ||||||||||||||||||||||||||||||||||||||||||
| Parameters (Session): | ||||||||||||||||||||||||||||||||||||||||||
| Parameters (R input): | ||||||||||||||||||||||||||||||||||||||||||
| R code (references can be found in the software module): | ||||||||||||||||||||||||||||||||||||||||||
library(Hmisc) | ||||||||||||||||||||||||||||||||||||||||||