Free Statistics

of Irreproducible Research!

Author's title

Author*Unverified author*
R Software Modulerwasp_univariatedataseries.wasp
Title produced by softwareUnivariate Data Series
Date of computationFri, 28 Jul 2017 13:42:46 +0200
Cite this page as followsStatistical Computations at FreeStatistics.org, Office for Research Development and Education, URL https://freestatistics.org/blog/index.php?v=date/2017/Jul/28/t1501242190mk5rv7vd5hoambo.htm/, Retrieved Wed, 15 May 2024 17:48:24 +0200
Statistical Computations at FreeStatistics.org, Office for Research Development and Education, URL https://freestatistics.org/blog/index.php?pk=, Retrieved Wed, 15 May 2024 17:48:24 +0200
QR Codes:

Original text written by user:
IsPrivate?No (this computation is public)
User-defined keywords
Estimated Impact0
Dataseries X:
4213144.00
4197453.00
4181541.00
4148612.00
4474366.00
4457128.00
4213144.00
4050930.00
4066621.00
4066621.00
4084080.00
4115462.00
4164303.00
4164303.00
4132921.00
4050930.00
4474366.00
4538898.00
4441437.00
4213144.00
4310826.00
4164303.00
4230382.00
4261985.00
4294914.00
4213144.00
4230382.00
4115462.00
4474366.00
4587739.00
4490278.00
4310826.00
4505969.00
4294914.00
4490278.00
4474366.00
4523207.00
4343755.00
4538898.00
4523207.00
4816032.00
4749953.00
4490278.00
4359446.00
4538898.00
4294914.00
4474366.00
4505969.00
4572048.00
4425746.00
4505969.00
4554810.00
4734262.00
4587739.00
4392596.00
4181541.00
4376905.00
3839875.00
4099771.00
4246073.00
4392596.00
4181541.00
4181541.00
4181541.00
4294914.00
4132921.00
3920319.00
3742414.00
3871478.00
3367598.00
3676335.00
3855787.00
3888716.00
3709264.00
3724955.00
3676335.00
3839875.00
3724955.00
3498430.00
3334669.00
3611582.00
3010241.00
3400748.00
3578653.00
3578653.00
3367598.00
3172455.00
3156764.00
3334669.00
3172455.00
2863939.00
2651337.00
2879630.00
2342821.00
2830789.00
3090464.00
3172455.00
2993003.00
2766257.00
2928471.00
2993003.00
2944162.00
2455973.00
2229448.00
2391441.00
1903473.00
2407353.00
2586805.00
2733107.00
2489123.00
2260830.00
2391441.00
2455973.00
2326909.00
1838941.00
1626339.00
1821482.00
1284673.00
1870323.00
2229448.00


Summary of computational transaction
Raw Input view raw input (R code)
Raw Outputview raw output of R engine
Computing time0 seconds
R ServerBig Analytics Cloud Computing Center

\begin{tabular}{lllllllll}
\hline
Summary of computational transaction \tabularnewline
Raw Input view raw input (R code)  \tabularnewline
Raw Outputview raw output of R engine  \tabularnewline
Computing time0 seconds \tabularnewline
R ServerBig Analytics Cloud Computing Center \tabularnewline
\hline
\end{tabular}
%Source: https://freestatistics.org/blog/index.php?pk=&T=0

[TABLE]
[ROW]
Summary of computational transaction[/C][/ROW] [ROW]Raw Input[/C] view raw input (R code) [/C][/ROW] [ROW]Raw Output[/C]view raw output of R engine [/C][/ROW] [ROW]Computing time[/C]0 seconds[/C][/ROW] [ROW]R Server[/C]Big Analytics Cloud Computing Center[/C][/ROW] [/TABLE] Source: https://freestatistics.org/blog/index.php?pk=&T=0

Globally Unique Identifier (entire table): ba.freestatistics.org/blog/index.php?pk=&T=0

As an alternative you can also use a QR Code:  

The GUIDs for individual cells are displayed in the table below:

Summary of computational transaction
Raw Input view raw input (R code)
Raw Outputview raw output of R engine
Computing time0 seconds
R ServerBig Analytics Cloud Computing Center


Univariate Dataseries
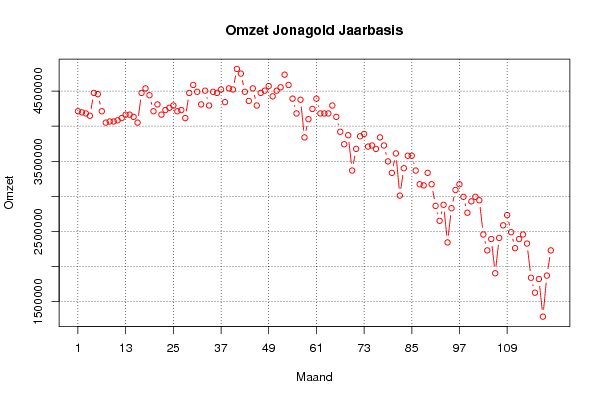
Name of dataseriesOmzet Jonagold
Sourceniet gekend
DescriptionOmzet Jonagold op jaarbasis van januari 2007 tot en met december 2016
Number of observations120

\begin{tabular}{lllllllll}
\hline
Univariate Dataseries \tabularnewline
Name of dataseries & Omzet Jonagold \tabularnewline
Source & niet gekend \tabularnewline
Description & Omzet Jonagold op jaarbasis van januari 2007 tot en met december 2016 \tabularnewline
Number of observations & 120 \tabularnewline
\hline
\end{tabular}
%Source: https://freestatistics.org/blog/index.php?pk=&T=1

[TABLE]
[ROW][C]Univariate Dataseries[/C][/ROW]
[ROW][C]Name of dataseries[/C][C]Omzet Jonagold[/C][/ROW]
[ROW][C]Source[/C][C]niet gekend[/C][/ROW]
[ROW][C]Description[/C][C]Omzet Jonagold op jaarbasis van januari 2007 tot en met december 2016[/C][/ROW]
[ROW][C]Number of observations[/C][C]120[/C][/ROW]
[/TABLE]
Source: https://freestatistics.org/blog/index.php?pk=&T=1

Globally Unique Identifier (entire table): ba.freestatistics.org/blog/index.php?pk=&T=1

As an alternative you can also use a QR Code:  

The GUIDs for individual cells are displayed in the table below:

Univariate Dataseries
Name of dataseriesOmzet Jonagold
Sourceniet gekend
DescriptionOmzet Jonagold op jaarbasis van januari 2007 tot en met december 2016
Number of observations120


Summary Statistics of dataseries x
> summary(x)
   Min. 1st Qu.  Median    Mean 3rd Qu.    Max. 
1284673 3140189 4091926 3707627 4347678 4816032 

\begin{tabular}{lllllllll}
\hline
Summary Statistics of dataseries x \tabularnewline
> summary(x)
   Min. 1st Qu.  Median    Mean 3rd Qu.    Max. 
1284673 3140189 4091926 3707627 4347678 4816032 
\tabularnewline \hline \end{tabular} %Source: https://freestatistics.org/blog/index.php?pk=&T=2

[TABLE]
[ROW][C]Summary Statistics of dataseries x[/C][/ROW]
[ROW][C]
> summary(x)
   Min. 1st Qu.  Median    Mean 3rd Qu.    Max. 
1284673 3140189 4091926 3707627 4347678 4816032 
[/C][/ROW] [/TABLE] Source: https://freestatistics.org/blog/index.php?pk=&T=2

Globally Unique Identifier (entire table): ba.freestatistics.org/blog/index.php?pk=&T=2

As an alternative you can also use a QR Code:  

The GUIDs for individual cells are displayed in the table below:

Summary Statistics of dataseries x
> summary(x)
   Min. 1st Qu.  Median    Mean 3rd Qu.    Max. 
1284673 3140189 4091926 3707627 4347678 4816032 


Parameters (Session):
par1 = Omzet Jonagold ; par2 = niet gekend ; par3 = Omzet Jonagold op jaarbasis van januari 2007 tot en met december 2016 ; par4 = 12 ;
Parameters (R input):
par1 = Omzet Jonagold ; par2 = niet gekend ; par3 = Omzet Jonagold op jaarbasis van januari 2007 tot en met december 2016 ; par4 = 12 ;
R code (references can be found in the software module):
par4 <- '12'
par3 <- 'Omzet Jonagold op jaarbasis van januari 2007 tot en met december 2016'
par2 <- 'niet gekend'
par1 <- 'Omzet Jonagold'
if (par4 != 'No season') {
par4 <- as.numeric(par4)
if (par4 < 4) par4 <- 12
}
summary(x)
n <- length(x)
bitmap(file='test1.png')
if (par4=='No season') {
plot(x,col=2,type='b',main=main,xlab=xlab,ylab=ylab,xaxt='n')
axis(1,at=seq(1,n,10))
}
if (par4!='No season') {
plot(x,col=2,type='b',main=main,xlab=xlab,ylab=ylab,xaxt='n')
axis(1,at=seq(1,n,par4))
grid(nx=0,ny=NULL,col='black')
abline(v=seq(1,n,par4),col='black',lty='dotted')
}
dev.off()
load(file='createtable')
a<-table.start()
a<-table.row.start(a)
a<-table.element(a,'Univariate Dataseries',2,TRUE)
a<-table.row.end(a)
a<-table.row.start(a)
a<-table.element(a,'Name of dataseries',header=TRUE)
a<-table.element(a,par1)
a<-table.row.end(a)
a<-table.row.start(a)
a<-table.element(a,'Source',header=TRUE)
a<-table.element(a,par2)
a<-table.row.end(a)
a<-table.row.start(a)
a<-table.element(a,'Description',header=TRUE)
a<-table.element(a,par3)
a<-table.row.end(a)
a<-table.row.start(a)
a<-table.element(a,'Number of observations',header=TRUE)
a<-table.element(a,length(x))
a<-table.row.end(a)
a<-table.end(a)
table.save(a,file='mytable.tab')
a<-table.start()
a<-table.row.start(a)
a<-table.element(a,'Summary Statistics of dataseries x',1,TRUE)
a<-table.row.end(a)
a<-table.row.start(a)
a<-table.element(a,paste('
',RC.texteval('summary(x)'),'
',sep=''))
a<-table.row.end(a)
a<-table.end(a)
table.save(a,file='mytable1.tab')