Free Statistics
of Irreproducible Research!
Description of Statistical Computation | |||||||||||||||||||||||||||||||||||||||||||||
|---|---|---|---|---|---|---|---|---|---|---|---|---|---|---|---|---|---|---|---|---|---|---|---|---|---|---|---|---|---|---|---|---|---|---|---|---|---|---|---|---|---|---|---|---|---|
| Author's title | |||||||||||||||||||||||||||||||||||||||||||||
| Author | *Unverified author* | ||||||||||||||||||||||||||||||||||||||||||||
| R Software Module | rwasp_kendall.wasp | ||||||||||||||||||||||||||||||||||||||||||||
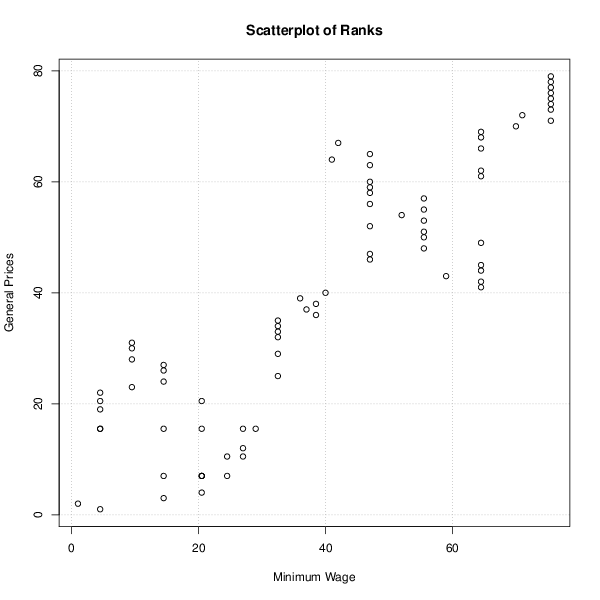
| Title produced by software | Kendall tau Rank Correlation | ||||||||||||||||||||||||||||||||||||||||||||
| Date of computation | Wed, 12 Jul 2017 15:00:25 +0100 | ||||||||||||||||||||||||||||||||||||||||||||
| Cite this page as follows | Statistical Computations at FreeStatistics.org, Office for Research Development and Education, URL https://freestatistics.org/blog/index.php?v=date/2017/Jul/12/t1499868102l70e8mad0ubxoc2.htm/, Retrieved Tue, 14 May 2024 20:05:07 +0200 | ||||||||||||||||||||||||||||||||||||||||||||
| Statistical Computations at FreeStatistics.org, Office for Research Development and Education, URL https://freestatistics.org/blog/index.php?pk=, Retrieved Tue, 14 May 2024 20:05:07 +0200 | |||||||||||||||||||||||||||||||||||||||||||||
| QR Codes: | |||||||||||||||||||||||||||||||||||||||||||||
|
| |||||||||||||||||||||||||||||||||||||||||||||
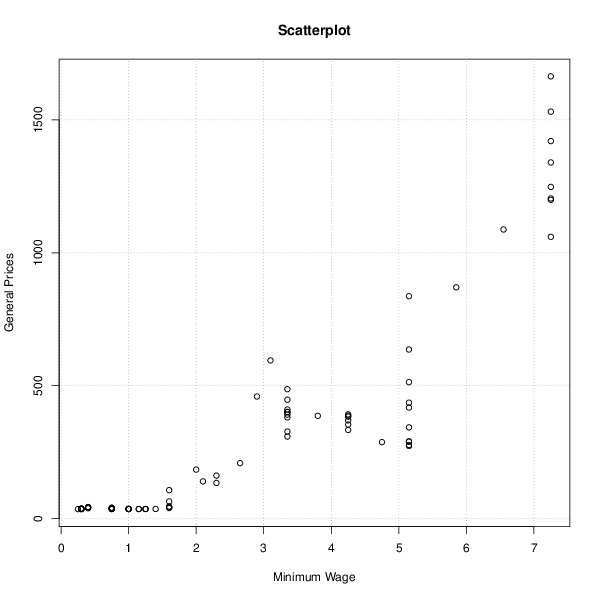
| Original text written by user: | Nominal Minimum Wage since its inception regressed against an index of general market prices. | ||||||||||||||||||||||||||||||||||||||||||||
| IsPrivate? | No (this computation is public) | ||||||||||||||||||||||||||||||||||||||||||||
| User-defined keywords | |||||||||||||||||||||||||||||||||||||||||||||
| Estimated Impact | 0 | ||||||||||||||||||||||||||||||||||||||||||||
Tree of Dependent Computations | |||||||||||||||||||||||||||||||||||||||||||||
Dataset | |||||||||||||||||||||||||||||||||||||||||||||
| Dataseries X: | |||||||||||||||||||||||||||||||||||||||||||||
0.25 0.3 0.3 0.3 0.3 0.3 0.3 0.4 0.4 0.4 0.4 0.75 0.75 0.75 0.75 0.75 0.75 1 1 1 1 1 1 1.15 1.15 1.25 1.25 1.25 1.4 1.6 1.6 1.6 1.6 1.6 1.6 2 2.1 2.3 2.3 2.65 2.9 3.1 3.35 3.35 3.35 3.35 3.35 3.35 3.35 3.35 3.35 3.8 4.25 4.25 4.25 4.25 4.25 4.25 4.75 5.15 5.15 5.15 5.15 5.15 5.15 5.15 5.15 5.15 5.15 5.85 6.55 7.25 7.25 7.25 7.25 7.25 7.25 7.25 7.25 | |||||||||||||||||||||||||||||||||||||||||||||
| Dataseries Y: | |||||||||||||||||||||||||||||||||||||||||||||
35 34.5 35.5 35.5 36.5 36.25 37.25 38.25 43 42 40.5 40.25 40 38.7 35.5 35.25 35.15 35.2 35.25 35.25 35.25 36.5 35.5 35.35 35.25 35.35 35.5 35.4 35.5 43.5 41 38.9 44.6 63.84 106.48 183.77 139.29 133.77 161.1 208.1 459 594.9 400 447 380 308 327 390.9 486.5 410.15 401 386.2 353.15 333 391.75 383.25 387 369 287.05 288.7 290.25 272.65 276.5 342.75 417.25 435.6 513 635.7 836.5 869.75 1087.5 1420.25 1531 1664 1204.5 1199.25 1060 1340 1248 | |||||||||||||||||||||||||||||||||||||||||||||
Tables (Output of Computation) | |||||||||||||||||||||||||||||||||||||||||||||
| |||||||||||||||||||||||||||||||||||||||||||||
Figures (Output of Computation) | |||||||||||||||||||||||||||||||||||||||||||||
Input Parameters & R Code | |||||||||||||||||||||||||||||||||||||||||||||
| Parameters (Session): | |||||||||||||||||||||||||||||||||||||||||||||
| Parameters (R input): | |||||||||||||||||||||||||||||||||||||||||||||
| R code (references can be found in the software module): | |||||||||||||||||||||||||||||||||||||||||||||
library('Kendall') | |||||||||||||||||||||||||||||||||||||||||||||