Free Statistics

of Irreproducible Research!

Author's title

Author*The author of this computation has been verified*
R Software Modulerwasp_multipleregression.wasp
Title produced by softwareMultiple Regression
Date of computationWed, 25 Jan 2017 11:00:25 +0100
Cite this page as followsStatistical Computations at FreeStatistics.org, Office for Research Development and Education, URL https://freestatistics.org/blog/index.php?v=date/2017/Jan/25/t14853384434q3ij7a9fc661kg.htm/, Retrieved Tue, 14 May 2024 01:02:36 +0200
Statistical Computations at FreeStatistics.org, Office for Research Development and Education, URL https://freestatistics.org/blog/index.php?pk=, Retrieved Tue, 14 May 2024 01:02:36 +0200
QR Codes:

Original text written by user:
IsPrivate?No (this computation is public)
User-defined keywords
Estimated Impact0
Dataseries X:
13 22 14
16 24 19
17 21 17
NA 21 17
NA 24 15
16 20 20
NA 22 15
NA 20 19
NA 19 15
17 23 15
17 21 19
15 19 NA
16 19 20
14 21 18
16 21 15
17 22 14
NA 22 20
NA 19 NA
NA 21 16
NA 21 16
16 21 16
NA 20 10
16 22 19
NA 22 19
NA 24 16
NA 21 15
16 19 18
15 19 17
16 23 19
16 21 17
13 21 NA
15 19 19
17 21 20
NA 19 5
13 21 19
17 21 16
NA 23 15
14 19 16
14 19 18
18 19 16
NA 18 15
17 22 17
13 18 NA
16 22 20
15 18 19
15 22 7
NA 22 13
15 19 16
13 22 16
NA 25 NA
17 19 18
NA 19 18
NA 19 16
11 19 17
14 21 19
13 21 16
NA 20 19
17 19 13
16 19 16
NA 22 13
17 26 12
16 19 17
16 21 17
16 21 17
15 20 16
12 23 16
17 22 14
14 22 16
14 22 13
16 21 16
NA 21 14
NA 22 20
NA 23 12
NA 18 13
NA 24 18
15 22 14
16 21 19
14 21 18
15 21 14
17 23 18
NA 21 19
10 23 15
NA 21 14
17 19 17
NA 21 19
20 21 13
17 21 19
18 23 18
NA 23 20
17 20 15
14 20 15
NA 19 15
17 23 20
NA 22 15
17 19 19
NA 23 18
16 22 18
18 22 15
18 21 20
16 21 17
NA 21 12
NA 21 18
15 22 19
13 25 20
NA 21 NA
NA 23 17
NA 19 15
NA 22 16
NA 20 18
16 21 18
NA 25 14
NA 21 15
NA 19 12
12 23 17
NA 22 14
16 21 18
16 24 17
NA 21 17
16 19 20
14 18 16
15 19 14
14 20 15
NA 19 18
15 22 20
NA 21 17
15 22 17
16 24 17
NA 28 17
NA 19 15
NA 18 17
11 23 18
NA 19 17
18 23 20
NA 19 15
11 22 16
NA 21 15
18 19 18
NA 22 11
15 21 15
19 23 18
17 22 20
NA 19 19
14 19 14
NA 21 16
13 22 15
17 21 17
14 20 18
19 23 20
14 22 17
NA 23 18
NA 22 15
16 21 16
16 20 11
15 18 15
12 18 18
NA 20 17
17 19 16
NA 21 12
NA 24 19
18 19 18
15 20 15
18 19 17
15 23 19
NA 22 18
NA 21 19
NA 24 16
16 21 16
NA 21 16
16 22 14


Summary of computational transaction
Raw Input view raw input (R code)
Raw Outputview raw output of R engine
Computing time9 seconds
R ServerBig Analytics Cloud Computing Center

\begin{tabular}{lllllllll}
\hline
Summary of computational transaction \tabularnewline
Raw Input view raw input (R code)  \tabularnewline
Raw Outputview raw output of R engine  \tabularnewline
Computing time9 seconds \tabularnewline
R ServerBig Analytics Cloud Computing Center \tabularnewline
\hline
\end{tabular}
%Source: https://freestatistics.org/blog/index.php?pk=&T=0

[TABLE]
[ROW]
Summary of computational transaction[/C][/ROW] [ROW]Raw Input[/C] view raw input (R code) [/C][/ROW] [ROW]Raw Output[/C]view raw output of R engine [/C][/ROW] [ROW]Computing time[/C]9 seconds[/C][/ROW] [ROW]R Server[/C]Big Analytics Cloud Computing Center[/C][/ROW] [/TABLE] Source: https://freestatistics.org/blog/index.php?pk=&T=0

Globally Unique Identifier (entire table): ba.freestatistics.org/blog/index.php?pk=&T=0

As an alternative you can also use a QR Code:  

The GUIDs for individual cells are displayed in the table below:

Summary of computational transaction
Raw Input view raw input (R code)
Raw Outputview raw output of R engine
Computing time9 seconds
R ServerBig Analytics Cloud Computing Center


Multiple Linear Regression - Estimated Regression Equation
TVDC[t] = + 14.429 -0.0186018Bevr_Leeftijd[t] + 0.0886917ITHSUM[t] + e[t]

\begin{tabular}{lllllllll}
\hline
Multiple Linear Regression - Estimated Regression Equation \tabularnewline
TVDC[t] =  +  14.429 -0.0186018Bevr_Leeftijd[t] +  0.0886917ITHSUM[t]  + e[t] \tabularnewline
 \tabularnewline
\hline
\end{tabular}
%Source: https://freestatistics.org/blog/index.php?pk=&T=1

[TABLE]
[ROW][C]Multiple Linear Regression - Estimated Regression Equation[/C][/ROW]
[ROW][C]TVDC[t] =  +  14.429 -0.0186018Bevr_Leeftijd[t] +  0.0886917ITHSUM[t]  + e[t][/C][/ROW]
[ROW][C][/C][/ROW]
[/TABLE]
Source: https://freestatistics.org/blog/index.php?pk=&T=1

Globally Unique Identifier (entire table): ba.freestatistics.org/blog/index.php?pk=&T=1

As an alternative you can also use a QR Code:  

The GUIDs for individual cells are displayed in the table below:

Multiple Linear Regression - Estimated Regression Equation
TVDC[t] = + 14.429 -0.0186018Bevr_Leeftijd[t] + 0.0886917ITHSUM[t] + e[t]


Multiple Linear Regression - Ordinary Least Squares
VariableParameterS.D.T-STATH0: parameter = 02-tail p-value1-tail p-value
(Intercept)+14.43 2.746+5.2550e+00 8.79e-07 4.395e-07
Bevr_Leeftijd-0.0186 0.1135-1.6400e-01 0.8701 0.4351
ITHSUM+0.08869 0.08263+1.0730e+00 0.2857 0.1429

\begin{tabular}{lllllllll}
\hline
Multiple Linear Regression - Ordinary Least Squares \tabularnewline
Variable & Parameter & S.D. & T-STATH0: parameter = 0 & 2-tail p-value & 1-tail p-value \tabularnewline
(Intercept) & +14.43 &  2.746 & +5.2550e+00 &  8.79e-07 &  4.395e-07 \tabularnewline
Bevr_Leeftijd & -0.0186 &  0.1135 & -1.6400e-01 &  0.8701 &  0.4351 \tabularnewline
ITHSUM & +0.08869 &  0.08263 & +1.0730e+00 &  0.2857 &  0.1429 \tabularnewline
\hline
\end{tabular}
%Source: https://freestatistics.org/blog/index.php?pk=&T=2

[TABLE]
[ROW][C]Multiple Linear Regression - Ordinary Least Squares[/C][/ROW]
[ROW][C]Variable[/C][C]Parameter[/C][C]S.D.[/C][C]T-STATH0: parameter = 0[/C][C]2-tail p-value[/C][C]1-tail p-value[/C][/ROW]
[ROW][C](Intercept)[/C][C]+14.43[/C][C] 2.746[/C][C]+5.2550e+00[/C][C] 8.79e-07[/C][C] 4.395e-07[/C][/ROW]
[ROW][C]Bevr_Leeftijd[/C][C]-0.0186[/C][C] 0.1135[/C][C]-1.6400e-01[/C][C] 0.8701[/C][C] 0.4351[/C][/ROW]
[ROW][C]ITHSUM[/C][C]+0.08869[/C][C] 0.08263[/C][C]+1.0730e+00[/C][C] 0.2857[/C][C] 0.1429[/C][/ROW]
[/TABLE]
Source: https://freestatistics.org/blog/index.php?pk=&T=2

Globally Unique Identifier (entire table): ba.freestatistics.org/blog/index.php?pk=&T=2

As an alternative you can also use a QR Code:  

The GUIDs for individual cells are displayed in the table below:

Multiple Linear Regression - Ordinary Least Squares
VariableParameterS.D.T-STATH0: parameter = 02-tail p-value1-tail p-value
(Intercept)+14.43 2.746+5.2550e+00 8.79e-07 4.395e-07
Bevr_Leeftijd-0.0186 0.1135-1.6400e-01 0.8701 0.4351
ITHSUM+0.08869 0.08263+1.0730e+00 0.2857 0.1429


Multiple Linear Regression - Regression Statistics
Multiple R 0.1093
R-squared 0.01195
Adjusted R-squared-0.008417
F-TEST (value) 0.5868
F-TEST (DF numerator)2
F-TEST (DF denominator)97
p-value 0.5581
Multiple Linear Regression - Residual Statistics
Residual Standard Deviation 1.874
Sum Squared Residuals 340.8

\begin{tabular}{lllllllll}
\hline
Multiple Linear Regression - Regression Statistics \tabularnewline
Multiple R &  0.1093 \tabularnewline
R-squared &  0.01195 \tabularnewline
Adjusted R-squared & -0.008417 \tabularnewline
F-TEST (value) &  0.5868 \tabularnewline
F-TEST (DF numerator) & 2 \tabularnewline
F-TEST (DF denominator) & 97 \tabularnewline
p-value &  0.5581 \tabularnewline
Multiple Linear Regression - Residual Statistics \tabularnewline
Residual Standard Deviation &  1.874 \tabularnewline
Sum Squared Residuals &  340.8 \tabularnewline
\hline
\end{tabular}
%Source: https://freestatistics.org/blog/index.php?pk=&T=3

[TABLE]
[ROW][C]Multiple Linear Regression - Regression Statistics[/C][/ROW]
[ROW][C]Multiple R[/C][C] 0.1093[/C][/ROW]
[ROW][C]R-squared[/C][C] 0.01195[/C][/ROW]
[ROW][C]Adjusted R-squared[/C][C]-0.008417[/C][/ROW]
[ROW][C]F-TEST (value)[/C][C] 0.5868[/C][/ROW]
[ROW][C]F-TEST (DF numerator)[/C][C]2[/C][/ROW]
[ROW][C]F-TEST (DF denominator)[/C][C]97[/C][/ROW]
[ROW][C]p-value[/C][C] 0.5581[/C][/ROW]
[ROW][C]Multiple Linear Regression - Residual Statistics[/C][/ROW]
[ROW][C]Residual Standard Deviation[/C][C] 1.874[/C][/ROW]
[ROW][C]Sum Squared Residuals[/C][C] 340.8[/C][/ROW]
[/TABLE]
Source: https://freestatistics.org/blog/index.php?pk=&T=3

Globally Unique Identifier (entire table): ba.freestatistics.org/blog/index.php?pk=&T=3

As an alternative you can also use a QR Code:  

The GUIDs for individual cells are displayed in the table below:

Multiple Linear Regression - Regression Statistics
Multiple R 0.1093
R-squared 0.01195
Adjusted R-squared-0.008417
F-TEST (value) 0.5868
F-TEST (DF numerator)2
F-TEST (DF denominator)97
p-value 0.5581
Multiple Linear Regression - Residual Statistics
Residual Standard Deviation 1.874
Sum Squared Residuals 340.8


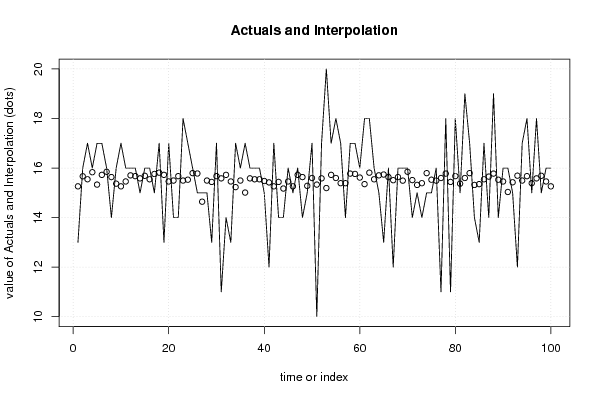
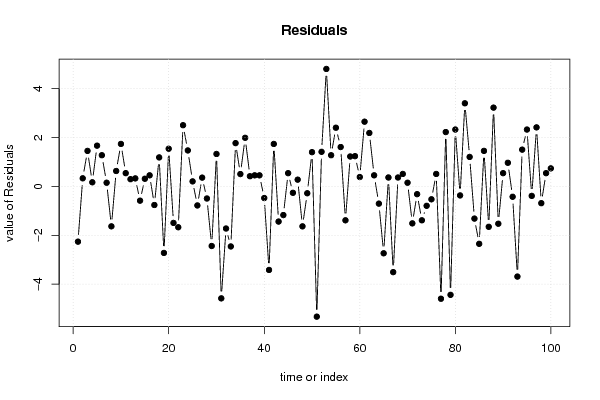
Multiple Linear Regression - Actuals, Interpolation, and Residuals
Time or IndexActualsInterpolationForecastResidualsPrediction Error
1 13 15.26-2.261
2 16 15.67 0.3323
3 17 15.55 1.454
4 16 15.83 0.1692
5 17 15.33 1.668
6 17 15.72 1.276
7 16 15.85 0.1506
8 14 15.63-1.635
9 16 15.37 0.6312
10 17 15.26 1.739
11 16 15.46 0.5425
12 16 15.7 0.2951
13 16 15.67 0.328
14 15 15.58-0.5834
15 16 15.69 0.3137
16 16 15.55 0.4538
17 15 15.76-0.7607
18 17 15.81 1.188
19 13 15.72-2.724
20 17 15.46 1.543
21 14 15.49-1.495
22 14 15.67-1.672
23 18 15.49 2.505
24 17 15.53 1.472
25 16 15.79 0.2064
26 15 15.78-0.7793
27 15 14.64 0.3594
28 15 15.49-0.4947
29 13 15.44-2.439
30 17 15.67 1.328
31 11 15.58-4.583
32 14 15.72-1.724
33 13 15.46-2.457
34 17 15.23 1.771
35 16 15.49 0.5053
36 17 15.01 1.99
37 16 15.58 0.4166
38 16 15.55 0.4538
39 16 15.55 0.4538
40 15 15.48-0.4761
41 12 15.42-3.42
42 17 15.26 1.739
43 14 15.44-1.439
44 14 15.17-1.173
45 16 15.46 0.5425
46 15 15.26-0.2615
47 16 15.72 0.2765
48 14 15.63-1.635
49 15 15.28-0.2801
50 17 15.6 1.402
51 10 15.33-5.332
52 17 15.58 1.417
53 20 15.19 4.809
54 17 15.72 1.276
55 18 15.6 2.402
56 17 15.39 1.613
57 14 15.39-1.387
58 17 15.78 1.225
59 17 15.76 1.239
60 16 15.62 0.3838
61 18 15.35 2.65
62 18 15.81 2.188
63 16 15.55 0.4538
64 15 15.7-0.7049
65 13 15.74-2.738
66 16 15.63 0.3652
67 12 15.51-3.509
68 16 15.63 0.3652
69 16 15.49 0.5097
70 16 15.85 0.1506
71 14 15.51-1.513
72 15 15.32-0.3173
73 14 15.39-1.387
74 15 15.79-0.7936
75 15 15.53-0.5275
76 16 15.49 0.5097
77 11 15.6-4.598
78 18 15.78 2.225
79 11 15.44-4.439
80 18 15.67 2.328
81 15 15.37-0.3688
82 19 15.6 3.402
83 17 15.79 1.206
84 14 15.32-1.317
85 13 15.35-2.35
86 17 15.55 1.454
87 14 15.65-1.653
88 19 15.78 3.225
89 14 15.53-1.528
90 16 15.46 0.5425
91 16 15.03 0.9674
92 15 15.42-0.4246
93 12 15.69-3.691
94 17 15.49 1.505
95 18 15.67 2.328
96 15 15.39-0.3874
97 18 15.58 2.417
98 15 15.69-0.6863
99 16 15.46 0.5425
100 16 15.26 0.7385

\begin{tabular}{lllllllll}
\hline
Multiple Linear Regression - Actuals, Interpolation, and Residuals \tabularnewline
Time or Index & Actuals & InterpolationForecast & ResidualsPrediction Error \tabularnewline
1 &  13 &  15.26 & -2.261 \tabularnewline
2 &  16 &  15.67 &  0.3323 \tabularnewline
3 &  17 &  15.55 &  1.454 \tabularnewline
4 &  16 &  15.83 &  0.1692 \tabularnewline
5 &  17 &  15.33 &  1.668 \tabularnewline
6 &  17 &  15.72 &  1.276 \tabularnewline
7 &  16 &  15.85 &  0.1506 \tabularnewline
8 &  14 &  15.63 & -1.635 \tabularnewline
9 &  16 &  15.37 &  0.6312 \tabularnewline
10 &  17 &  15.26 &  1.739 \tabularnewline
11 &  16 &  15.46 &  0.5425 \tabularnewline
12 &  16 &  15.7 &  0.2951 \tabularnewline
13 &  16 &  15.67 &  0.328 \tabularnewline
14 &  15 &  15.58 & -0.5834 \tabularnewline
15 &  16 &  15.69 &  0.3137 \tabularnewline
16 &  16 &  15.55 &  0.4538 \tabularnewline
17 &  15 &  15.76 & -0.7607 \tabularnewline
18 &  17 &  15.81 &  1.188 \tabularnewline
19 &  13 &  15.72 & -2.724 \tabularnewline
20 &  17 &  15.46 &  1.543 \tabularnewline
21 &  14 &  15.49 & -1.495 \tabularnewline
22 &  14 &  15.67 & -1.672 \tabularnewline
23 &  18 &  15.49 &  2.505 \tabularnewline
24 &  17 &  15.53 &  1.472 \tabularnewline
25 &  16 &  15.79 &  0.2064 \tabularnewline
26 &  15 &  15.78 & -0.7793 \tabularnewline
27 &  15 &  14.64 &  0.3594 \tabularnewline
28 &  15 &  15.49 & -0.4947 \tabularnewline
29 &  13 &  15.44 & -2.439 \tabularnewline
30 &  17 &  15.67 &  1.328 \tabularnewline
31 &  11 &  15.58 & -4.583 \tabularnewline
32 &  14 &  15.72 & -1.724 \tabularnewline
33 &  13 &  15.46 & -2.457 \tabularnewline
34 &  17 &  15.23 &  1.771 \tabularnewline
35 &  16 &  15.49 &  0.5053 \tabularnewline
36 &  17 &  15.01 &  1.99 \tabularnewline
37 &  16 &  15.58 &  0.4166 \tabularnewline
38 &  16 &  15.55 &  0.4538 \tabularnewline
39 &  16 &  15.55 &  0.4538 \tabularnewline
40 &  15 &  15.48 & -0.4761 \tabularnewline
41 &  12 &  15.42 & -3.42 \tabularnewline
42 &  17 &  15.26 &  1.739 \tabularnewline
43 &  14 &  15.44 & -1.439 \tabularnewline
44 &  14 &  15.17 & -1.173 \tabularnewline
45 &  16 &  15.46 &  0.5425 \tabularnewline
46 &  15 &  15.26 & -0.2615 \tabularnewline
47 &  16 &  15.72 &  0.2765 \tabularnewline
48 &  14 &  15.63 & -1.635 \tabularnewline
49 &  15 &  15.28 & -0.2801 \tabularnewline
50 &  17 &  15.6 &  1.402 \tabularnewline
51 &  10 &  15.33 & -5.332 \tabularnewline
52 &  17 &  15.58 &  1.417 \tabularnewline
53 &  20 &  15.19 &  4.809 \tabularnewline
54 &  17 &  15.72 &  1.276 \tabularnewline
55 &  18 &  15.6 &  2.402 \tabularnewline
56 &  17 &  15.39 &  1.613 \tabularnewline
57 &  14 &  15.39 & -1.387 \tabularnewline
58 &  17 &  15.78 &  1.225 \tabularnewline
59 &  17 &  15.76 &  1.239 \tabularnewline
60 &  16 &  15.62 &  0.3838 \tabularnewline
61 &  18 &  15.35 &  2.65 \tabularnewline
62 &  18 &  15.81 &  2.188 \tabularnewline
63 &  16 &  15.55 &  0.4538 \tabularnewline
64 &  15 &  15.7 & -0.7049 \tabularnewline
65 &  13 &  15.74 & -2.738 \tabularnewline
66 &  16 &  15.63 &  0.3652 \tabularnewline
67 &  12 &  15.51 & -3.509 \tabularnewline
68 &  16 &  15.63 &  0.3652 \tabularnewline
69 &  16 &  15.49 &  0.5097 \tabularnewline
70 &  16 &  15.85 &  0.1506 \tabularnewline
71 &  14 &  15.51 & -1.513 \tabularnewline
72 &  15 &  15.32 & -0.3173 \tabularnewline
73 &  14 &  15.39 & -1.387 \tabularnewline
74 &  15 &  15.79 & -0.7936 \tabularnewline
75 &  15 &  15.53 & -0.5275 \tabularnewline
76 &  16 &  15.49 &  0.5097 \tabularnewline
77 &  11 &  15.6 & -4.598 \tabularnewline
78 &  18 &  15.78 &  2.225 \tabularnewline
79 &  11 &  15.44 & -4.439 \tabularnewline
80 &  18 &  15.67 &  2.328 \tabularnewline
81 &  15 &  15.37 & -0.3688 \tabularnewline
82 &  19 &  15.6 &  3.402 \tabularnewline
83 &  17 &  15.79 &  1.206 \tabularnewline
84 &  14 &  15.32 & -1.317 \tabularnewline
85 &  13 &  15.35 & -2.35 \tabularnewline
86 &  17 &  15.55 &  1.454 \tabularnewline
87 &  14 &  15.65 & -1.653 \tabularnewline
88 &  19 &  15.78 &  3.225 \tabularnewline
89 &  14 &  15.53 & -1.528 \tabularnewline
90 &  16 &  15.46 &  0.5425 \tabularnewline
91 &  16 &  15.03 &  0.9674 \tabularnewline
92 &  15 &  15.42 & -0.4246 \tabularnewline
93 &  12 &  15.69 & -3.691 \tabularnewline
94 &  17 &  15.49 &  1.505 \tabularnewline
95 &  18 &  15.67 &  2.328 \tabularnewline
96 &  15 &  15.39 & -0.3874 \tabularnewline
97 &  18 &  15.58 &  2.417 \tabularnewline
98 &  15 &  15.69 & -0.6863 \tabularnewline
99 &  16 &  15.46 &  0.5425 \tabularnewline
100 &  16 &  15.26 &  0.7385 \tabularnewline
\hline
\end{tabular}
%Source: https://freestatistics.org/blog/index.php?pk=&T=4

[TABLE]
[ROW][C]Multiple Linear Regression - Actuals, Interpolation, and Residuals[/C][/ROW]
[ROW][C]Time or Index[/C][C]Actuals[/C][C]InterpolationForecast[/C][C]ResidualsPrediction Error[/C][/ROW]
[ROW][C]1[/C][C] 13[/C][C] 15.26[/C][C]-2.261[/C][/ROW]
[ROW][C]2[/C][C] 16[/C][C] 15.67[/C][C] 0.3323[/C][/ROW]
[ROW][C]3[/C][C] 17[/C][C] 15.55[/C][C] 1.454[/C][/ROW]
[ROW][C]4[/C][C] 16[/C][C] 15.83[/C][C] 0.1692[/C][/ROW]
[ROW][C]5[/C][C] 17[/C][C] 15.33[/C][C] 1.668[/C][/ROW]
[ROW][C]6[/C][C] 17[/C][C] 15.72[/C][C] 1.276[/C][/ROW]
[ROW][C]7[/C][C] 16[/C][C] 15.85[/C][C] 0.1506[/C][/ROW]
[ROW][C]8[/C][C] 14[/C][C] 15.63[/C][C]-1.635[/C][/ROW]
[ROW][C]9[/C][C] 16[/C][C] 15.37[/C][C] 0.6312[/C][/ROW]
[ROW][C]10[/C][C] 17[/C][C] 15.26[/C][C] 1.739[/C][/ROW]
[ROW][C]11[/C][C] 16[/C][C] 15.46[/C][C] 0.5425[/C][/ROW]
[ROW][C]12[/C][C] 16[/C][C] 15.7[/C][C] 0.2951[/C][/ROW]
[ROW][C]13[/C][C] 16[/C][C] 15.67[/C][C] 0.328[/C][/ROW]
[ROW][C]14[/C][C] 15[/C][C] 15.58[/C][C]-0.5834[/C][/ROW]
[ROW][C]15[/C][C] 16[/C][C] 15.69[/C][C] 0.3137[/C][/ROW]
[ROW][C]16[/C][C] 16[/C][C] 15.55[/C][C] 0.4538[/C][/ROW]
[ROW][C]17[/C][C] 15[/C][C] 15.76[/C][C]-0.7607[/C][/ROW]
[ROW][C]18[/C][C] 17[/C][C] 15.81[/C][C] 1.188[/C][/ROW]
[ROW][C]19[/C][C] 13[/C][C] 15.72[/C][C]-2.724[/C][/ROW]
[ROW][C]20[/C][C] 17[/C][C] 15.46[/C][C] 1.543[/C][/ROW]
[ROW][C]21[/C][C] 14[/C][C] 15.49[/C][C]-1.495[/C][/ROW]
[ROW][C]22[/C][C] 14[/C][C] 15.67[/C][C]-1.672[/C][/ROW]
[ROW][C]23[/C][C] 18[/C][C] 15.49[/C][C] 2.505[/C][/ROW]
[ROW][C]24[/C][C] 17[/C][C] 15.53[/C][C] 1.472[/C][/ROW]
[ROW][C]25[/C][C] 16[/C][C] 15.79[/C][C] 0.2064[/C][/ROW]
[ROW][C]26[/C][C] 15[/C][C] 15.78[/C][C]-0.7793[/C][/ROW]
[ROW][C]27[/C][C] 15[/C][C] 14.64[/C][C] 0.3594[/C][/ROW]
[ROW][C]28[/C][C] 15[/C][C] 15.49[/C][C]-0.4947[/C][/ROW]
[ROW][C]29[/C][C] 13[/C][C] 15.44[/C][C]-2.439[/C][/ROW]
[ROW][C]30[/C][C] 17[/C][C] 15.67[/C][C] 1.328[/C][/ROW]
[ROW][C]31[/C][C] 11[/C][C] 15.58[/C][C]-4.583[/C][/ROW]
[ROW][C]32[/C][C] 14[/C][C] 15.72[/C][C]-1.724[/C][/ROW]
[ROW][C]33[/C][C] 13[/C][C] 15.46[/C][C]-2.457[/C][/ROW]
[ROW][C]34[/C][C] 17[/C][C] 15.23[/C][C] 1.771[/C][/ROW]
[ROW][C]35[/C][C] 16[/C][C] 15.49[/C][C] 0.5053[/C][/ROW]
[ROW][C]36[/C][C] 17[/C][C] 15.01[/C][C] 1.99[/C][/ROW]
[ROW][C]37[/C][C] 16[/C][C] 15.58[/C][C] 0.4166[/C][/ROW]
[ROW][C]38[/C][C] 16[/C][C] 15.55[/C][C] 0.4538[/C][/ROW]
[ROW][C]39[/C][C] 16[/C][C] 15.55[/C][C] 0.4538[/C][/ROW]
[ROW][C]40[/C][C] 15[/C][C] 15.48[/C][C]-0.4761[/C][/ROW]
[ROW][C]41[/C][C] 12[/C][C] 15.42[/C][C]-3.42[/C][/ROW]
[ROW][C]42[/C][C] 17[/C][C] 15.26[/C][C] 1.739[/C][/ROW]
[ROW][C]43[/C][C] 14[/C][C] 15.44[/C][C]-1.439[/C][/ROW]
[ROW][C]44[/C][C] 14[/C][C] 15.17[/C][C]-1.173[/C][/ROW]
[ROW][C]45[/C][C] 16[/C][C] 15.46[/C][C] 0.5425[/C][/ROW]
[ROW][C]46[/C][C] 15[/C][C] 15.26[/C][C]-0.2615[/C][/ROW]
[ROW][C]47[/C][C] 16[/C][C] 15.72[/C][C] 0.2765[/C][/ROW]
[ROW][C]48[/C][C] 14[/C][C] 15.63[/C][C]-1.635[/C][/ROW]
[ROW][C]49[/C][C] 15[/C][C] 15.28[/C][C]-0.2801[/C][/ROW]
[ROW][C]50[/C][C] 17[/C][C] 15.6[/C][C] 1.402[/C][/ROW]
[ROW][C]51[/C][C] 10[/C][C] 15.33[/C][C]-5.332[/C][/ROW]
[ROW][C]52[/C][C] 17[/C][C] 15.58[/C][C] 1.417[/C][/ROW]
[ROW][C]53[/C][C] 20[/C][C] 15.19[/C][C] 4.809[/C][/ROW]
[ROW][C]54[/C][C] 17[/C][C] 15.72[/C][C] 1.276[/C][/ROW]
[ROW][C]55[/C][C] 18[/C][C] 15.6[/C][C] 2.402[/C][/ROW]
[ROW][C]56[/C][C] 17[/C][C] 15.39[/C][C] 1.613[/C][/ROW]
[ROW][C]57[/C][C] 14[/C][C] 15.39[/C][C]-1.387[/C][/ROW]
[ROW][C]58[/C][C] 17[/C][C] 15.78[/C][C] 1.225[/C][/ROW]
[ROW][C]59[/C][C] 17[/C][C] 15.76[/C][C] 1.239[/C][/ROW]
[ROW][C]60[/C][C] 16[/C][C] 15.62[/C][C] 0.3838[/C][/ROW]
[ROW][C]61[/C][C] 18[/C][C] 15.35[/C][C] 2.65[/C][/ROW]
[ROW][C]62[/C][C] 18[/C][C] 15.81[/C][C] 2.188[/C][/ROW]
[ROW][C]63[/C][C] 16[/C][C] 15.55[/C][C] 0.4538[/C][/ROW]
[ROW][C]64[/C][C] 15[/C][C] 15.7[/C][C]-0.7049[/C][/ROW]
[ROW][C]65[/C][C] 13[/C][C] 15.74[/C][C]-2.738[/C][/ROW]
[ROW][C]66[/C][C] 16[/C][C] 15.63[/C][C] 0.3652[/C][/ROW]
[ROW][C]67[/C][C] 12[/C][C] 15.51[/C][C]-3.509[/C][/ROW]
[ROW][C]68[/C][C] 16[/C][C] 15.63[/C][C] 0.3652[/C][/ROW]
[ROW][C]69[/C][C] 16[/C][C] 15.49[/C][C] 0.5097[/C][/ROW]
[ROW][C]70[/C][C] 16[/C][C] 15.85[/C][C] 0.1506[/C][/ROW]
[ROW][C]71[/C][C] 14[/C][C] 15.51[/C][C]-1.513[/C][/ROW]
[ROW][C]72[/C][C] 15[/C][C] 15.32[/C][C]-0.3173[/C][/ROW]
[ROW][C]73[/C][C] 14[/C][C] 15.39[/C][C]-1.387[/C][/ROW]
[ROW][C]74[/C][C] 15[/C][C] 15.79[/C][C]-0.7936[/C][/ROW]
[ROW][C]75[/C][C] 15[/C][C] 15.53[/C][C]-0.5275[/C][/ROW]
[ROW][C]76[/C][C] 16[/C][C] 15.49[/C][C] 0.5097[/C][/ROW]
[ROW][C]77[/C][C] 11[/C][C] 15.6[/C][C]-4.598[/C][/ROW]
[ROW][C]78[/C][C] 18[/C][C] 15.78[/C][C] 2.225[/C][/ROW]
[ROW][C]79[/C][C] 11[/C][C] 15.44[/C][C]-4.439[/C][/ROW]
[ROW][C]80[/C][C] 18[/C][C] 15.67[/C][C] 2.328[/C][/ROW]
[ROW][C]81[/C][C] 15[/C][C] 15.37[/C][C]-0.3688[/C][/ROW]
[ROW][C]82[/C][C] 19[/C][C] 15.6[/C][C] 3.402[/C][/ROW]
[ROW][C]83[/C][C] 17[/C][C] 15.79[/C][C] 1.206[/C][/ROW]
[ROW][C]84[/C][C] 14[/C][C] 15.32[/C][C]-1.317[/C][/ROW]
[ROW][C]85[/C][C] 13[/C][C] 15.35[/C][C]-2.35[/C][/ROW]
[ROW][C]86[/C][C] 17[/C][C] 15.55[/C][C] 1.454[/C][/ROW]
[ROW][C]87[/C][C] 14[/C][C] 15.65[/C][C]-1.653[/C][/ROW]
[ROW][C]88[/C][C] 19[/C][C] 15.78[/C][C] 3.225[/C][/ROW]
[ROW][C]89[/C][C] 14[/C][C] 15.53[/C][C]-1.528[/C][/ROW]
[ROW][C]90[/C][C] 16[/C][C] 15.46[/C][C] 0.5425[/C][/ROW]
[ROW][C]91[/C][C] 16[/C][C] 15.03[/C][C] 0.9674[/C][/ROW]
[ROW][C]92[/C][C] 15[/C][C] 15.42[/C][C]-0.4246[/C][/ROW]
[ROW][C]93[/C][C] 12[/C][C] 15.69[/C][C]-3.691[/C][/ROW]
[ROW][C]94[/C][C] 17[/C][C] 15.49[/C][C] 1.505[/C][/ROW]
[ROW][C]95[/C][C] 18[/C][C] 15.67[/C][C] 2.328[/C][/ROW]
[ROW][C]96[/C][C] 15[/C][C] 15.39[/C][C]-0.3874[/C][/ROW]
[ROW][C]97[/C][C] 18[/C][C] 15.58[/C][C] 2.417[/C][/ROW]
[ROW][C]98[/C][C] 15[/C][C] 15.69[/C][C]-0.6863[/C][/ROW]
[ROW][C]99[/C][C] 16[/C][C] 15.46[/C][C] 0.5425[/C][/ROW]
[ROW][C]100[/C][C] 16[/C][C] 15.26[/C][C] 0.7385[/C][/ROW]
[/TABLE]
Source: https://freestatistics.org/blog/index.php?pk=&T=4

Globally Unique Identifier (entire table): ba.freestatistics.org/blog/index.php?pk=&T=4

As an alternative you can also use a QR Code:  

The GUIDs for individual cells are displayed in the table below:

Multiple Linear Regression - Actuals, Interpolation, and Residuals
Time or IndexActualsInterpolationForecastResidualsPrediction Error
1 13 15.26-2.261
2 16 15.67 0.3323
3 17 15.55 1.454
4 16 15.83 0.1692
5 17 15.33 1.668
6 17 15.72 1.276
7 16 15.85 0.1506
8 14 15.63-1.635
9 16 15.37 0.6312
10 17 15.26 1.739
11 16 15.46 0.5425
12 16 15.7 0.2951
13 16 15.67 0.328
14 15 15.58-0.5834
15 16 15.69 0.3137
16 16 15.55 0.4538
17 15 15.76-0.7607
18 17 15.81 1.188
19 13 15.72-2.724
20 17 15.46 1.543
21 14 15.49-1.495
22 14 15.67-1.672
23 18 15.49 2.505
24 17 15.53 1.472
25 16 15.79 0.2064
26 15 15.78-0.7793
27 15 14.64 0.3594
28 15 15.49-0.4947
29 13 15.44-2.439
30 17 15.67 1.328
31 11 15.58-4.583
32 14 15.72-1.724
33 13 15.46-2.457
34 17 15.23 1.771
35 16 15.49 0.5053
36 17 15.01 1.99
37 16 15.58 0.4166
38 16 15.55 0.4538
39 16 15.55 0.4538
40 15 15.48-0.4761
41 12 15.42-3.42
42 17 15.26 1.739
43 14 15.44-1.439
44 14 15.17-1.173
45 16 15.46 0.5425
46 15 15.26-0.2615
47 16 15.72 0.2765
48 14 15.63-1.635
49 15 15.28-0.2801
50 17 15.6 1.402
51 10 15.33-5.332
52 17 15.58 1.417
53 20 15.19 4.809
54 17 15.72 1.276
55 18 15.6 2.402
56 17 15.39 1.613
57 14 15.39-1.387
58 17 15.78 1.225
59 17 15.76 1.239
60 16 15.62 0.3838
61 18 15.35 2.65
62 18 15.81 2.188
63 16 15.55 0.4538
64 15 15.7-0.7049
65 13 15.74-2.738
66 16 15.63 0.3652
67 12 15.51-3.509
68 16 15.63 0.3652
69 16 15.49 0.5097
70 16 15.85 0.1506
71 14 15.51-1.513
72 15 15.32-0.3173
73 14 15.39-1.387
74 15 15.79-0.7936
75 15 15.53-0.5275
76 16 15.49 0.5097
77 11 15.6-4.598
78 18 15.78 2.225
79 11 15.44-4.439
80 18 15.67 2.328
81 15 15.37-0.3688
82 19 15.6 3.402
83 17 15.79 1.206
84 14 15.32-1.317
85 13 15.35-2.35
86 17 15.55 1.454
87 14 15.65-1.653
88 19 15.78 3.225
89 14 15.53-1.528
90 16 15.46 0.5425
91 16 15.03 0.9674
92 15 15.42-0.4246
93 12 15.69-3.691
94 17 15.49 1.505
95 18 15.67 2.328
96 15 15.39-0.3874
97 18 15.58 2.417
98 15 15.69-0.6863
99 16 15.46 0.5425
100 16 15.26 0.7385


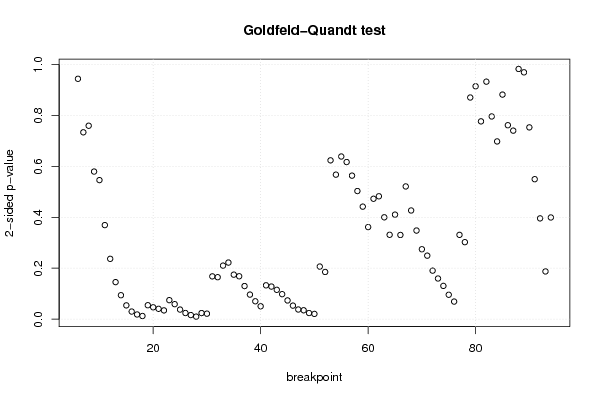
Goldfeld-Quandt test for Heteroskedasticity
p-valuesAlternative Hypothesis
breakpoint indexgreater2-sidedless
6 0.5284 0.9433 0.4716
7 0.3667 0.7334 0.6333
8 0.3795 0.7591 0.6205
9 0.2896 0.5793 0.7104
10 0.2729 0.5458 0.7271
11 0.1846 0.3692 0.8154
12 0.1184 0.2369 0.8816
13 0.07275 0.1455 0.9272
14 0.04704 0.09409 0.953
15 0.02712 0.05424 0.9729
16 0.01499 0.02999 0.985
17 0.009272 0.01854 0.9907
18 0.006255 0.01251 0.9937
19 0.02742 0.05484 0.9726
20 0.02338 0.04677 0.9766
21 0.02039 0.04077 0.9796
22 0.01727 0.03455 0.9827
23 0.03738 0.07475 0.9626
24 0.02952 0.05904 0.9705
25 0.0189 0.0378 0.9811
26 0.01215 0.0243 0.9879
27 0.008144 0.01629 0.9919
28 0.005005 0.01001 0.995
29 0.01205 0.02411 0.9879
30 0.01085 0.0217 0.9891
31 0.08403 0.1681 0.916
32 0.08242 0.1648 0.9176
33 0.1051 0.2102 0.8949
34 0.1111 0.2223 0.8889
35 0.08736 0.1747 0.9126
36 0.08424 0.1685 0.9158
37 0.06504 0.1301 0.935
38 0.04826 0.09652 0.9517
39 0.03517 0.07035 0.9648
40 0.02533 0.05066 0.9747
41 0.06648 0.133 0.9335
42 0.06405 0.1281 0.936
43 0.05764 0.1153 0.9424
44 0.04911 0.09823 0.9509
45 0.03681 0.07362 0.9632
46 0.02663 0.05325 0.9734
47 0.01902 0.03803 0.981
48 0.01754 0.03508 0.9825
49 0.01213 0.02426 0.9879
50 0.0104 0.02079 0.9896
51 0.1033 0.2066 0.8967
52 0.09265 0.1853 0.9074
53 0.3117 0.6234 0.6883
54 0.2836 0.5672 0.7164
55 0.3192 0.6384 0.6808
56 0.3083 0.6166 0.6917
57 0.2816 0.5633 0.7184
58 0.2514 0.5028 0.7486
59 0.2208 0.4417 0.7792
60 0.1808 0.3615 0.8192
61 0.2363 0.4726 0.7637
62 0.2412 0.4823 0.7588
63 0.1999 0.3999 0.8001
64 0.1656 0.3312 0.8344
65 0.2051 0.4103 0.7949
66 0.1653 0.3305 0.8347
67 0.2604 0.5209 0.7396
68 0.2133 0.4266 0.7867
69 0.1739 0.3479 0.8261
70 0.1372 0.2745 0.8628
71 0.1247 0.2493 0.8753
72 0.09526 0.1905 0.9047
73 0.07988 0.1598 0.9201
74 0.06535 0.1307 0.9347
75 0.04793 0.09586 0.9521
76 0.03461 0.06922 0.9654
77 0.1655 0.331 0.8345
78 0.1511 0.3023 0.8489
79 0.4349 0.8698 0.5651
80 0.457 0.9139 0.543
81 0.3881 0.7763 0.6119
82 0.466 0.9321 0.534
83 0.3977 0.7955 0.6023
84 0.3488 0.6975 0.6512
85 0.4406 0.8813 0.5594
86 0.3806 0.7612 0.6194
87 0.3699 0.7398 0.6301
88 0.509 0.9819 0.491
89 0.4844 0.9687 0.5156
90 0.3763 0.7527 0.6237
91 0.2747 0.5494 0.7253
92 0.1978 0.3956 0.8022
93 0.9063 0.1874 0.09372
94 0.8004 0.3992 0.1996

\begin{tabular}{lllllllll}
\hline
Goldfeld-Quandt test for Heteroskedasticity \tabularnewline
p-values & Alternative Hypothesis \tabularnewline
breakpoint index & greater & 2-sided & less \tabularnewline
6 &  0.5284 &  0.9433 &  0.4716 \tabularnewline
7 &  0.3667 &  0.7334 &  0.6333 \tabularnewline
8 &  0.3795 &  0.7591 &  0.6205 \tabularnewline
9 &  0.2896 &  0.5793 &  0.7104 \tabularnewline
10 &  0.2729 &  0.5458 &  0.7271 \tabularnewline
11 &  0.1846 &  0.3692 &  0.8154 \tabularnewline
12 &  0.1184 &  0.2369 &  0.8816 \tabularnewline
13 &  0.07275 &  0.1455 &  0.9272 \tabularnewline
14 &  0.04704 &  0.09409 &  0.953 \tabularnewline
15 &  0.02712 &  0.05424 &  0.9729 \tabularnewline
16 &  0.01499 &  0.02999 &  0.985 \tabularnewline
17 &  0.009272 &  0.01854 &  0.9907 \tabularnewline
18 &  0.006255 &  0.01251 &  0.9937 \tabularnewline
19 &  0.02742 &  0.05484 &  0.9726 \tabularnewline
20 &  0.02338 &  0.04677 &  0.9766 \tabularnewline
21 &  0.02039 &  0.04077 &  0.9796 \tabularnewline
22 &  0.01727 &  0.03455 &  0.9827 \tabularnewline
23 &  0.03738 &  0.07475 &  0.9626 \tabularnewline
24 &  0.02952 &  0.05904 &  0.9705 \tabularnewline
25 &  0.0189 &  0.0378 &  0.9811 \tabularnewline
26 &  0.01215 &  0.0243 &  0.9879 \tabularnewline
27 &  0.008144 &  0.01629 &  0.9919 \tabularnewline
28 &  0.005005 &  0.01001 &  0.995 \tabularnewline
29 &  0.01205 &  0.02411 &  0.9879 \tabularnewline
30 &  0.01085 &  0.0217 &  0.9891 \tabularnewline
31 &  0.08403 &  0.1681 &  0.916 \tabularnewline
32 &  0.08242 &  0.1648 &  0.9176 \tabularnewline
33 &  0.1051 &  0.2102 &  0.8949 \tabularnewline
34 &  0.1111 &  0.2223 &  0.8889 \tabularnewline
35 &  0.08736 &  0.1747 &  0.9126 \tabularnewline
36 &  0.08424 &  0.1685 &  0.9158 \tabularnewline
37 &  0.06504 &  0.1301 &  0.935 \tabularnewline
38 &  0.04826 &  0.09652 &  0.9517 \tabularnewline
39 &  0.03517 &  0.07035 &  0.9648 \tabularnewline
40 &  0.02533 &  0.05066 &  0.9747 \tabularnewline
41 &  0.06648 &  0.133 &  0.9335 \tabularnewline
42 &  0.06405 &  0.1281 &  0.936 \tabularnewline
43 &  0.05764 &  0.1153 &  0.9424 \tabularnewline
44 &  0.04911 &  0.09823 &  0.9509 \tabularnewline
45 &  0.03681 &  0.07362 &  0.9632 \tabularnewline
46 &  0.02663 &  0.05325 &  0.9734 \tabularnewline
47 &  0.01902 &  0.03803 &  0.981 \tabularnewline
48 &  0.01754 &  0.03508 &  0.9825 \tabularnewline
49 &  0.01213 &  0.02426 &  0.9879 \tabularnewline
50 &  0.0104 &  0.02079 &  0.9896 \tabularnewline
51 &  0.1033 &  0.2066 &  0.8967 \tabularnewline
52 &  0.09265 &  0.1853 &  0.9074 \tabularnewline
53 &  0.3117 &  0.6234 &  0.6883 \tabularnewline
54 &  0.2836 &  0.5672 &  0.7164 \tabularnewline
55 &  0.3192 &  0.6384 &  0.6808 \tabularnewline
56 &  0.3083 &  0.6166 &  0.6917 \tabularnewline
57 &  0.2816 &  0.5633 &  0.7184 \tabularnewline
58 &  0.2514 &  0.5028 &  0.7486 \tabularnewline
59 &  0.2208 &  0.4417 &  0.7792 \tabularnewline
60 &  0.1808 &  0.3615 &  0.8192 \tabularnewline
61 &  0.2363 &  0.4726 &  0.7637 \tabularnewline
62 &  0.2412 &  0.4823 &  0.7588 \tabularnewline
63 &  0.1999 &  0.3999 &  0.8001 \tabularnewline
64 &  0.1656 &  0.3312 &  0.8344 \tabularnewline
65 &  0.2051 &  0.4103 &  0.7949 \tabularnewline
66 &  0.1653 &  0.3305 &  0.8347 \tabularnewline
67 &  0.2604 &  0.5209 &  0.7396 \tabularnewline
68 &  0.2133 &  0.4266 &  0.7867 \tabularnewline
69 &  0.1739 &  0.3479 &  0.8261 \tabularnewline
70 &  0.1372 &  0.2745 &  0.8628 \tabularnewline
71 &  0.1247 &  0.2493 &  0.8753 \tabularnewline
72 &  0.09526 &  0.1905 &  0.9047 \tabularnewline
73 &  0.07988 &  0.1598 &  0.9201 \tabularnewline
74 &  0.06535 &  0.1307 &  0.9347 \tabularnewline
75 &  0.04793 &  0.09586 &  0.9521 \tabularnewline
76 &  0.03461 &  0.06922 &  0.9654 \tabularnewline
77 &  0.1655 &  0.331 &  0.8345 \tabularnewline
78 &  0.1511 &  0.3023 &  0.8489 \tabularnewline
79 &  0.4349 &  0.8698 &  0.5651 \tabularnewline
80 &  0.457 &  0.9139 &  0.543 \tabularnewline
81 &  0.3881 &  0.7763 &  0.6119 \tabularnewline
82 &  0.466 &  0.9321 &  0.534 \tabularnewline
83 &  0.3977 &  0.7955 &  0.6023 \tabularnewline
84 &  0.3488 &  0.6975 &  0.6512 \tabularnewline
85 &  0.4406 &  0.8813 &  0.5594 \tabularnewline
86 &  0.3806 &  0.7612 &  0.6194 \tabularnewline
87 &  0.3699 &  0.7398 &  0.6301 \tabularnewline
88 &  0.509 &  0.9819 &  0.491 \tabularnewline
89 &  0.4844 &  0.9687 &  0.5156 \tabularnewline
90 &  0.3763 &  0.7527 &  0.6237 \tabularnewline
91 &  0.2747 &  0.5494 &  0.7253 \tabularnewline
92 &  0.1978 &  0.3956 &  0.8022 \tabularnewline
93 &  0.9063 &  0.1874 &  0.09372 \tabularnewline
94 &  0.8004 &  0.3992 &  0.1996 \tabularnewline
\hline
\end{tabular}
%Source: https://freestatistics.org/blog/index.php?pk=&T=5

[TABLE]
[ROW][C]Goldfeld-Quandt test for Heteroskedasticity[/C][/ROW]
[ROW][C]p-values[/C][C]Alternative Hypothesis[/C][/ROW]
[ROW][C]breakpoint index[/C][C]greater[/C][C]2-sided[/C][C]less[/C][/ROW]
[ROW][C]6[/C][C] 0.5284[/C][C] 0.9433[/C][C] 0.4716[/C][/ROW]
[ROW][C]7[/C][C] 0.3667[/C][C] 0.7334[/C][C] 0.6333[/C][/ROW]
[ROW][C]8[/C][C] 0.3795[/C][C] 0.7591[/C][C] 0.6205[/C][/ROW]
[ROW][C]9[/C][C] 0.2896[/C][C] 0.5793[/C][C] 0.7104[/C][/ROW]
[ROW][C]10[/C][C] 0.2729[/C][C] 0.5458[/C][C] 0.7271[/C][/ROW]
[ROW][C]11[/C][C] 0.1846[/C][C] 0.3692[/C][C] 0.8154[/C][/ROW]
[ROW][C]12[/C][C] 0.1184[/C][C] 0.2369[/C][C] 0.8816[/C][/ROW]
[ROW][C]13[/C][C] 0.07275[/C][C] 0.1455[/C][C] 0.9272[/C][/ROW]
[ROW][C]14[/C][C] 0.04704[/C][C] 0.09409[/C][C] 0.953[/C][/ROW]
[ROW][C]15[/C][C] 0.02712[/C][C] 0.05424[/C][C] 0.9729[/C][/ROW]
[ROW][C]16[/C][C] 0.01499[/C][C] 0.02999[/C][C] 0.985[/C][/ROW]
[ROW][C]17[/C][C] 0.009272[/C][C] 0.01854[/C][C] 0.9907[/C][/ROW]
[ROW][C]18[/C][C] 0.006255[/C][C] 0.01251[/C][C] 0.9937[/C][/ROW]
[ROW][C]19[/C][C] 0.02742[/C][C] 0.05484[/C][C] 0.9726[/C][/ROW]
[ROW][C]20[/C][C] 0.02338[/C][C] 0.04677[/C][C] 0.9766[/C][/ROW]
[ROW][C]21[/C][C] 0.02039[/C][C] 0.04077[/C][C] 0.9796[/C][/ROW]
[ROW][C]22[/C][C] 0.01727[/C][C] 0.03455[/C][C] 0.9827[/C][/ROW]
[ROW][C]23[/C][C] 0.03738[/C][C] 0.07475[/C][C] 0.9626[/C][/ROW]
[ROW][C]24[/C][C] 0.02952[/C][C] 0.05904[/C][C] 0.9705[/C][/ROW]
[ROW][C]25[/C][C] 0.0189[/C][C] 0.0378[/C][C] 0.9811[/C][/ROW]
[ROW][C]26[/C][C] 0.01215[/C][C] 0.0243[/C][C] 0.9879[/C][/ROW]
[ROW][C]27[/C][C] 0.008144[/C][C] 0.01629[/C][C] 0.9919[/C][/ROW]
[ROW][C]28[/C][C] 0.005005[/C][C] 0.01001[/C][C] 0.995[/C][/ROW]
[ROW][C]29[/C][C] 0.01205[/C][C] 0.02411[/C][C] 0.9879[/C][/ROW]
[ROW][C]30[/C][C] 0.01085[/C][C] 0.0217[/C][C] 0.9891[/C][/ROW]
[ROW][C]31[/C][C] 0.08403[/C][C] 0.1681[/C][C] 0.916[/C][/ROW]
[ROW][C]32[/C][C] 0.08242[/C][C] 0.1648[/C][C] 0.9176[/C][/ROW]
[ROW][C]33[/C][C] 0.1051[/C][C] 0.2102[/C][C] 0.8949[/C][/ROW]
[ROW][C]34[/C][C] 0.1111[/C][C] 0.2223[/C][C] 0.8889[/C][/ROW]
[ROW][C]35[/C][C] 0.08736[/C][C] 0.1747[/C][C] 0.9126[/C][/ROW]
[ROW][C]36[/C][C] 0.08424[/C][C] 0.1685[/C][C] 0.9158[/C][/ROW]
[ROW][C]37[/C][C] 0.06504[/C][C] 0.1301[/C][C] 0.935[/C][/ROW]
[ROW][C]38[/C][C] 0.04826[/C][C] 0.09652[/C][C] 0.9517[/C][/ROW]
[ROW][C]39[/C][C] 0.03517[/C][C] 0.07035[/C][C] 0.9648[/C][/ROW]
[ROW][C]40[/C][C] 0.02533[/C][C] 0.05066[/C][C] 0.9747[/C][/ROW]
[ROW][C]41[/C][C] 0.06648[/C][C] 0.133[/C][C] 0.9335[/C][/ROW]
[ROW][C]42[/C][C] 0.06405[/C][C] 0.1281[/C][C] 0.936[/C][/ROW]
[ROW][C]43[/C][C] 0.05764[/C][C] 0.1153[/C][C] 0.9424[/C][/ROW]
[ROW][C]44[/C][C] 0.04911[/C][C] 0.09823[/C][C] 0.9509[/C][/ROW]
[ROW][C]45[/C][C] 0.03681[/C][C] 0.07362[/C][C] 0.9632[/C][/ROW]
[ROW][C]46[/C][C] 0.02663[/C][C] 0.05325[/C][C] 0.9734[/C][/ROW]
[ROW][C]47[/C][C] 0.01902[/C][C] 0.03803[/C][C] 0.981[/C][/ROW]
[ROW][C]48[/C][C] 0.01754[/C][C] 0.03508[/C][C] 0.9825[/C][/ROW]
[ROW][C]49[/C][C] 0.01213[/C][C] 0.02426[/C][C] 0.9879[/C][/ROW]
[ROW][C]50[/C][C] 0.0104[/C][C] 0.02079[/C][C] 0.9896[/C][/ROW]
[ROW][C]51[/C][C] 0.1033[/C][C] 0.2066[/C][C] 0.8967[/C][/ROW]
[ROW][C]52[/C][C] 0.09265[/C][C] 0.1853[/C][C] 0.9074[/C][/ROW]
[ROW][C]53[/C][C] 0.3117[/C][C] 0.6234[/C][C] 0.6883[/C][/ROW]
[ROW][C]54[/C][C] 0.2836[/C][C] 0.5672[/C][C] 0.7164[/C][/ROW]
[ROW][C]55[/C][C] 0.3192[/C][C] 0.6384[/C][C] 0.6808[/C][/ROW]
[ROW][C]56[/C][C] 0.3083[/C][C] 0.6166[/C][C] 0.6917[/C][/ROW]
[ROW][C]57[/C][C] 0.2816[/C][C] 0.5633[/C][C] 0.7184[/C][/ROW]
[ROW][C]58[/C][C] 0.2514[/C][C] 0.5028[/C][C] 0.7486[/C][/ROW]
[ROW][C]59[/C][C] 0.2208[/C][C] 0.4417[/C][C] 0.7792[/C][/ROW]
[ROW][C]60[/C][C] 0.1808[/C][C] 0.3615[/C][C] 0.8192[/C][/ROW]
[ROW][C]61[/C][C] 0.2363[/C][C] 0.4726[/C][C] 0.7637[/C][/ROW]
[ROW][C]62[/C][C] 0.2412[/C][C] 0.4823[/C][C] 0.7588[/C][/ROW]
[ROW][C]63[/C][C] 0.1999[/C][C] 0.3999[/C][C] 0.8001[/C][/ROW]
[ROW][C]64[/C][C] 0.1656[/C][C] 0.3312[/C][C] 0.8344[/C][/ROW]
[ROW][C]65[/C][C] 0.2051[/C][C] 0.4103[/C][C] 0.7949[/C][/ROW]
[ROW][C]66[/C][C] 0.1653[/C][C] 0.3305[/C][C] 0.8347[/C][/ROW]
[ROW][C]67[/C][C] 0.2604[/C][C] 0.5209[/C][C] 0.7396[/C][/ROW]
[ROW][C]68[/C][C] 0.2133[/C][C] 0.4266[/C][C] 0.7867[/C][/ROW]
[ROW][C]69[/C][C] 0.1739[/C][C] 0.3479[/C][C] 0.8261[/C][/ROW]
[ROW][C]70[/C][C] 0.1372[/C][C] 0.2745[/C][C] 0.8628[/C][/ROW]
[ROW][C]71[/C][C] 0.1247[/C][C] 0.2493[/C][C] 0.8753[/C][/ROW]
[ROW][C]72[/C][C] 0.09526[/C][C] 0.1905[/C][C] 0.9047[/C][/ROW]
[ROW][C]73[/C][C] 0.07988[/C][C] 0.1598[/C][C] 0.9201[/C][/ROW]
[ROW][C]74[/C][C] 0.06535[/C][C] 0.1307[/C][C] 0.9347[/C][/ROW]
[ROW][C]75[/C][C] 0.04793[/C][C] 0.09586[/C][C] 0.9521[/C][/ROW]
[ROW][C]76[/C][C] 0.03461[/C][C] 0.06922[/C][C] 0.9654[/C][/ROW]
[ROW][C]77[/C][C] 0.1655[/C][C] 0.331[/C][C] 0.8345[/C][/ROW]
[ROW][C]78[/C][C] 0.1511[/C][C] 0.3023[/C][C] 0.8489[/C][/ROW]
[ROW][C]79[/C][C] 0.4349[/C][C] 0.8698[/C][C] 0.5651[/C][/ROW]
[ROW][C]80[/C][C] 0.457[/C][C] 0.9139[/C][C] 0.543[/C][/ROW]
[ROW][C]81[/C][C] 0.3881[/C][C] 0.7763[/C][C] 0.6119[/C][/ROW]
[ROW][C]82[/C][C] 0.466[/C][C] 0.9321[/C][C] 0.534[/C][/ROW]
[ROW][C]83[/C][C] 0.3977[/C][C] 0.7955[/C][C] 0.6023[/C][/ROW]
[ROW][C]84[/C][C] 0.3488[/C][C] 0.6975[/C][C] 0.6512[/C][/ROW]
[ROW][C]85[/C][C] 0.4406[/C][C] 0.8813[/C][C] 0.5594[/C][/ROW]
[ROW][C]86[/C][C] 0.3806[/C][C] 0.7612[/C][C] 0.6194[/C][/ROW]
[ROW][C]87[/C][C] 0.3699[/C][C] 0.7398[/C][C] 0.6301[/C][/ROW]
[ROW][C]88[/C][C] 0.509[/C][C] 0.9819[/C][C] 0.491[/C][/ROW]
[ROW][C]89[/C][C] 0.4844[/C][C] 0.9687[/C][C] 0.5156[/C][/ROW]
[ROW][C]90[/C][C] 0.3763[/C][C] 0.7527[/C][C] 0.6237[/C][/ROW]
[ROW][C]91[/C][C] 0.2747[/C][C] 0.5494[/C][C] 0.7253[/C][/ROW]
[ROW][C]92[/C][C] 0.1978[/C][C] 0.3956[/C][C] 0.8022[/C][/ROW]
[ROW][C]93[/C][C] 0.9063[/C][C] 0.1874[/C][C] 0.09372[/C][/ROW]
[ROW][C]94[/C][C] 0.8004[/C][C] 0.3992[/C][C] 0.1996[/C][/ROW]
[/TABLE]
Source: https://freestatistics.org/blog/index.php?pk=&T=5

Globally Unique Identifier (entire table): ba.freestatistics.org/blog/index.php?pk=&T=5

As an alternative you can also use a QR Code:  

The GUIDs for individual cells are displayed in the table below:

Goldfeld-Quandt test for Heteroskedasticity
p-valuesAlternative Hypothesis
breakpoint indexgreater2-sidedless
6 0.5284 0.9433 0.4716
7 0.3667 0.7334 0.6333
8 0.3795 0.7591 0.6205
9 0.2896 0.5793 0.7104
10 0.2729 0.5458 0.7271
11 0.1846 0.3692 0.8154
12 0.1184 0.2369 0.8816
13 0.07275 0.1455 0.9272
14 0.04704 0.09409 0.953
15 0.02712 0.05424 0.9729
16 0.01499 0.02999 0.985
17 0.009272 0.01854 0.9907
18 0.006255 0.01251 0.9937
19 0.02742 0.05484 0.9726
20 0.02338 0.04677 0.9766
21 0.02039 0.04077 0.9796
22 0.01727 0.03455 0.9827
23 0.03738 0.07475 0.9626
24 0.02952 0.05904 0.9705
25 0.0189 0.0378 0.9811
26 0.01215 0.0243 0.9879
27 0.008144 0.01629 0.9919
28 0.005005 0.01001 0.995
29 0.01205 0.02411 0.9879
30 0.01085 0.0217 0.9891
31 0.08403 0.1681 0.916
32 0.08242 0.1648 0.9176
33 0.1051 0.2102 0.8949
34 0.1111 0.2223 0.8889
35 0.08736 0.1747 0.9126
36 0.08424 0.1685 0.9158
37 0.06504 0.1301 0.935
38 0.04826 0.09652 0.9517
39 0.03517 0.07035 0.9648
40 0.02533 0.05066 0.9747
41 0.06648 0.133 0.9335
42 0.06405 0.1281 0.936
43 0.05764 0.1153 0.9424
44 0.04911 0.09823 0.9509
45 0.03681 0.07362 0.9632
46 0.02663 0.05325 0.9734
47 0.01902 0.03803 0.981
48 0.01754 0.03508 0.9825
49 0.01213 0.02426 0.9879
50 0.0104 0.02079 0.9896
51 0.1033 0.2066 0.8967
52 0.09265 0.1853 0.9074
53 0.3117 0.6234 0.6883
54 0.2836 0.5672 0.7164
55 0.3192 0.6384 0.6808
56 0.3083 0.6166 0.6917
57 0.2816 0.5633 0.7184
58 0.2514 0.5028 0.7486
59 0.2208 0.4417 0.7792
60 0.1808 0.3615 0.8192
61 0.2363 0.4726 0.7637
62 0.2412 0.4823 0.7588
63 0.1999 0.3999 0.8001
64 0.1656 0.3312 0.8344
65 0.2051 0.4103 0.7949
66 0.1653 0.3305 0.8347
67 0.2604 0.5209 0.7396
68 0.2133 0.4266 0.7867
69 0.1739 0.3479 0.8261
70 0.1372 0.2745 0.8628
71 0.1247 0.2493 0.8753
72 0.09526 0.1905 0.9047
73 0.07988 0.1598 0.9201
74 0.06535 0.1307 0.9347
75 0.04793 0.09586 0.9521
76 0.03461 0.06922 0.9654
77 0.1655 0.331 0.8345
78 0.1511 0.3023 0.8489
79 0.4349 0.8698 0.5651
80 0.457 0.9139 0.543
81 0.3881 0.7763 0.6119
82 0.466 0.9321 0.534
83 0.3977 0.7955 0.6023
84 0.3488 0.6975 0.6512
85 0.4406 0.8813 0.5594
86 0.3806 0.7612 0.6194
87 0.3699 0.7398 0.6301
88 0.509 0.9819 0.491
89 0.4844 0.9687 0.5156
90 0.3763 0.7527 0.6237
91 0.2747 0.5494 0.7253
92 0.1978 0.3956 0.8022
93 0.9063 0.1874 0.09372
94 0.8004 0.3992 0.1996


Meta Analysis of Goldfeld-Quandt test for Heteroskedasticity
Description# significant tests% significant testsOK/NOK
1% type I error level0 0OK
5% type I error level160.179775NOK
10% type I error level290.325843NOK

\begin{tabular}{lllllllll}
\hline
Meta Analysis of Goldfeld-Quandt test for Heteroskedasticity \tabularnewline
Description & # significant tests & % significant tests & OK/NOK \tabularnewline
1% type I error level & 0 &  0 & OK \tabularnewline
5% type I error level & 16 & 0.179775 & NOK \tabularnewline
10% type I error level & 29 & 0.325843 & NOK \tabularnewline
\hline
\end{tabular}
%Source: https://freestatistics.org/blog/index.php?pk=&T=6

[TABLE]
[ROW][C]Meta Analysis of Goldfeld-Quandt test for Heteroskedasticity[/C][/ROW]
[ROW][C]Description[/C][C]# significant tests[/C][C]% significant tests[/C][C]OK/NOK[/C][/ROW]
[ROW][C]1% type I error level[/C][C]0[/C][C] 0[/C][C]OK[/C][/ROW]
[ROW][C]5% type I error level[/C][C]16[/C][C]0.179775[/C][C]NOK[/C][/ROW]
[ROW][C]10% type I error level[/C][C]29[/C][C]0.325843[/C][C]NOK[/C][/ROW]
[/TABLE]
Source: https://freestatistics.org/blog/index.php?pk=&T=6

Globally Unique Identifier (entire table): ba.freestatistics.org/blog/index.php?pk=&T=6

As an alternative you can also use a QR Code:  

The GUIDs for individual cells are displayed in the table below:

Meta Analysis of Goldfeld-Quandt test for Heteroskedasticity
Description# significant tests% significant testsOK/NOK
1% type I error level0 0OK
5% type I error level160.179775NOK
10% type I error level290.325843NOK


Ramsey RESET F-Test for powers (2 and 3) of fitted values
> reset_test_fitted
	RESET test
data:  mylm
RESET = 1.7821, df1 = 2, df2 = 95, p-value = 0.1739
Ramsey RESET F-Test for powers (2 and 3) of regressors
> reset_test_regressors
	RESET test
data:  mylm
RESET = 1.8464, df1 = 4, df2 = 93, p-value = 0.1265
Ramsey RESET F-Test for powers (2 and 3) of principal components
> reset_test_principal_components
	RESET test
data:  mylm
RESET = 2.3055, df1 = 2, df2 = 95, p-value = 0.1053

\begin{tabular}{lllllllll}
\hline
Ramsey RESET F-Test for powers (2 and 3) of fitted values \tabularnewline
> reset_test_fitted
	RESET test
data:  mylm
RESET = 1.7821, df1 = 2, df2 = 95, p-value = 0.1739
\tabularnewline Ramsey RESET F-Test for powers (2 and 3) of regressors \tabularnewline
> reset_test_regressors
	RESET test
data:  mylm
RESET = 1.8464, df1 = 4, df2 = 93, p-value = 0.1265
\tabularnewline Ramsey RESET F-Test for powers (2 and 3) of principal components \tabularnewline
> reset_test_principal_components
	RESET test
data:  mylm
RESET = 2.3055, df1 = 2, df2 = 95, p-value = 0.1053
\tabularnewline \hline \end{tabular} %Source: https://freestatistics.org/blog/index.php?pk=&T=7

[TABLE]
[ROW][C]Ramsey RESET F-Test for powers (2 and 3) of fitted values[/C][/ROW]
[ROW][C]
> reset_test_fitted
	RESET test
data:  mylm
RESET = 1.7821, df1 = 2, df2 = 95, p-value = 0.1739
[/C][/ROW] [ROW][C]Ramsey RESET F-Test for powers (2 and 3) of regressors[/C][/ROW] [ROW][C]
> reset_test_regressors
	RESET test
data:  mylm
RESET = 1.8464, df1 = 4, df2 = 93, p-value = 0.1265
[/C][/ROW] [ROW][C]Ramsey RESET F-Test for powers (2 and 3) of principal components[/C][/ROW] [ROW][C]
> reset_test_principal_components
	RESET test
data:  mylm
RESET = 2.3055, df1 = 2, df2 = 95, p-value = 0.1053
[/C][/ROW] [/TABLE] Source: https://freestatistics.org/blog/index.php?pk=&T=7

Globally Unique Identifier (entire table): ba.freestatistics.org/blog/index.php?pk=&T=7

As an alternative you can also use a QR Code:  

The GUIDs for individual cells are displayed in the table below:

Ramsey RESET F-Test for powers (2 and 3) of fitted values
> reset_test_fitted
	RESET test
data:  mylm
RESET = 1.7821, df1 = 2, df2 = 95, p-value = 0.1739
Ramsey RESET F-Test for powers (2 and 3) of regressors
> reset_test_regressors
	RESET test
data:  mylm
RESET = 1.8464, df1 = 4, df2 = 93, p-value = 0.1265
Ramsey RESET F-Test for powers (2 and 3) of principal components
> reset_test_principal_components
	RESET test
data:  mylm
RESET = 2.3055, df1 = 2, df2 = 95, p-value = 0.1053


Variance Inflation Factors (Multicollinearity)
> vif
Bevr_Leeftijd        ITHSUM 
     1.000272      1.000272 

\begin{tabular}{lllllllll}
\hline
Variance Inflation Factors (Multicollinearity) \tabularnewline
> vif
Bevr_Leeftijd        ITHSUM 
     1.000272      1.000272 
\tabularnewline \hline \end{tabular} %Source: https://freestatistics.org/blog/index.php?pk=&T=8

[TABLE]
[ROW][C]Variance Inflation Factors (Multicollinearity)[/C][/ROW]
[ROW][C]
> vif
Bevr_Leeftijd        ITHSUM 
     1.000272      1.000272 
[/C][/ROW] [/TABLE] Source: https://freestatistics.org/blog/index.php?pk=&T=8

Globally Unique Identifier (entire table): ba.freestatistics.org/blog/index.php?pk=&T=8

As an alternative you can also use a QR Code:  

The GUIDs for individual cells are displayed in the table below:

Variance Inflation Factors (Multicollinearity)
> vif
Bevr_Leeftijd        ITHSUM 
     1.000272      1.000272 


Parameters (Session):
par1 = 12111111 ; par2 = Triple2222Do not include Seasonal DummiesDo not include Seasonal Dummies ; par3 = additive0.990.990.993No Linear TrendNo Linear Trend ; par4 = 12two.sidedtwo.sidedtwo.sidedTRUE0 ; par5 = pairedpairedunpaired0 ; par6 = 000 ;
Parameters (R input):
par1 = 1 ; par2 = Do not include Seasonal Dummies ; par3 = No Linear Trend ; par4 = 0 ; par5 = 0 ;
R code (references can be found in the software module):
library(lattice)
library(lmtest)
library(car)
library(MASS)
n25 <- 25 #minimum number of obs. for Goldfeld-Quandt test
mywarning <- ''
par1 <- as.numeric(par1)
if(is.na(par1)) {
par1 <- 1
mywarning = 'Warning: you did not specify the column number of the endogenous series! The first column was selected by default.'
}
if (par4=='') par4 <- 0
par4 <- as.numeric(par4)
if (par5=='') par5 <- 0
par5 <- as.numeric(par5)
x <- na.omit(t(y))
k <- length(x[1,])
n <- length(x[,1])
x1 <- cbind(x[,par1], x[,1:k!=par1])
mycolnames <- c(colnames(x)[par1], colnames(x)[1:k!=par1])
colnames(x1) <- mycolnames #colnames(x)[par1]
x <- x1
if (par3 == 'First Differences'){
(n <- n -1)
x2 <- array(0, dim=c(n,k), dimnames=list(1:n, paste('(1-B)',colnames(x),sep='')))
for (i in 1:n) {
for (j in 1:k) {
x2[i,j] <- x[i+1,j] - x[i,j]
}
}
x <- x2
}
if (par3 == 'Seasonal Differences (s=12)'){
(n <- n - 12)
x2 <- array(0, dim=c(n,k), dimnames=list(1:n, paste('(1-B12)',colnames(x),sep='')))
for (i in 1:n) {
for (j in 1:k) {
x2[i,j] <- x[i+12,j] - x[i,j]
}
}
x <- x2
}
if (par3 == 'First and Seasonal Differences (s=12)'){
(n <- n -1)
x2 <- array(0, dim=c(n,k), dimnames=list(1:n, paste('(1-B)',colnames(x),sep='')))
for (i in 1:n) {
for (j in 1:k) {
x2[i,j] <- x[i+1,j] - x[i,j]
}
}
x <- x2
(n <- n - 12)
x2 <- array(0, dim=c(n,k), dimnames=list(1:n, paste('(1-B12)',colnames(x),sep='')))
for (i in 1:n) {
for (j in 1:k) {
x2[i,j] <- x[i+12,j] - x[i,j]
}
}
x <- x2
}
if(par4 > 0) {
x2 <- array(0, dim=c(n-par4,par4), dimnames=list(1:(n-par4), paste(colnames(x)[par1],'(t-',1:par4,')',sep='')))
for (i in 1:(n-par4)) {
for (j in 1:par4) {
x2[i,j] <- x[i+par4-j,par1]
}
}
x <- cbind(x[(par4+1):n,], x2)
n <- n - par4
}
if(par5 > 0) {
x2 <- array(0, dim=c(n-par5*12,par5), dimnames=list(1:(n-par5*12), paste(colnames(x)[par1],'(t-',1:par5,'s)',sep='')))
for (i in 1:(n-par5*12)) {
for (j in 1:par5) {
x2[i,j] <- x[i+par5*12-j*12,par1]
}
}
x <- cbind(x[(par5*12+1):n,], x2)
n <- n - par5*12
}
if (par2 == 'Include Monthly Dummies'){
x2 <- array(0, dim=c(n,11), dimnames=list(1:n, paste('M', seq(1:11), sep ='')))
for (i in 1:11){
x2[seq(i,n,12),i] <- 1
}
x <- cbind(x, x2)
}
if (par2 == 'Include Quarterly Dummies'){
x2 <- array(0, dim=c(n,3), dimnames=list(1:n, paste('Q', seq(1:3), sep ='')))
for (i in 1:3){
x2[seq(i,n,4),i] <- 1
}
x <- cbind(x, x2)
}
(k <- length(x[n,]))
if (par3 == 'Linear Trend'){
x <- cbind(x, c(1:n))
colnames(x)[k+1] <- 't'
}
print(x)
(k <- length(x[n,]))
head(x)
df <- as.data.frame(x)
(mylm <- lm(df))
(mysum <- summary(mylm))
if (n > n25) {
kp3 <- k + 3
nmkm3 <- n - k - 3
gqarr <- array(NA, dim=c(nmkm3-kp3+1,3))
numgqtests <- 0
numsignificant1 <- 0
numsignificant5 <- 0
numsignificant10 <- 0
for (mypoint in kp3:nmkm3) {
j <- 0
numgqtests <- numgqtests + 1
for (myalt in c('greater', 'two.sided', 'less')) {
j <- j + 1
gqarr[mypoint-kp3+1,j] <- gqtest(mylm, point=mypoint, alternative=myalt)$p.value
}
if (gqarr[mypoint-kp3+1,2] < 0.01) numsignificant1 <- numsignificant1 + 1
if (gqarr[mypoint-kp3+1,2] < 0.05) numsignificant5 <- numsignificant5 + 1
if (gqarr[mypoint-kp3+1,2] < 0.10) numsignificant10 <- numsignificant10 + 1
}
gqarr
}
bitmap(file='test0.png')
plot(x[,1], type='l', main='Actuals and Interpolation', ylab='value of Actuals and Interpolation (dots)', xlab='time or index')
points(x[,1]-mysum$resid)
grid()
dev.off()
bitmap(file='test1.png')
plot(mysum$resid, type='b', pch=19, main='Residuals', ylab='value of Residuals', xlab='time or index')
grid()
dev.off()
bitmap(file='test2.png')
sresid <- studres(mylm)
hist(sresid, freq=FALSE, main='Distribution of Studentized Residuals')
xfit<-seq(min(sresid),max(sresid),length=40)
yfit<-dnorm(xfit)
lines(xfit, yfit)
grid()
dev.off()
bitmap(file='test3.png')
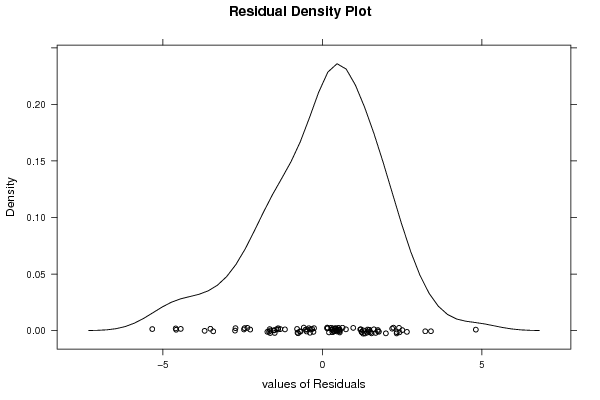
densityplot(~mysum$resid,col='black',main='Residual Density Plot', xlab='values of Residuals')
dev.off()
bitmap(file='test4.png')
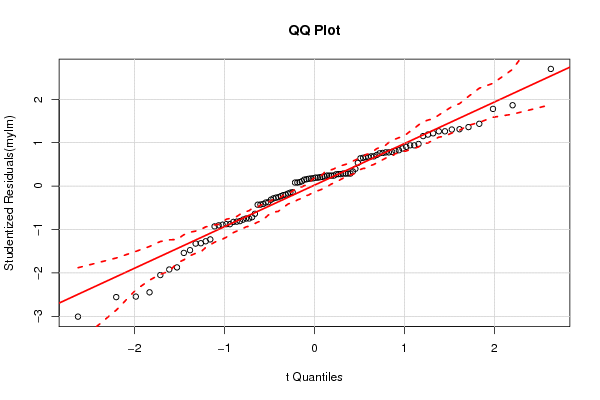
qqPlot(mylm, main='QQ Plot')
grid()
dev.off()
(myerror <- as.ts(mysum$resid))
bitmap(file='test5.png')
dum <- cbind(lag(myerror,k=1),myerror)
dum
dum1 <- dum[2:length(myerror),]
dum1
z <- as.data.frame(dum1)
print(z)
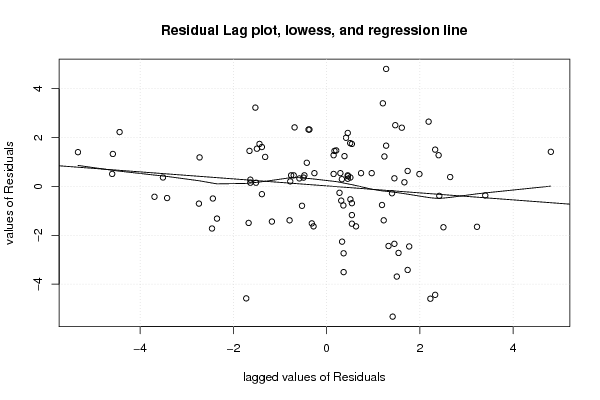
plot(z,main=paste('Residual Lag plot, lowess, and regression line'), ylab='values of Residuals', xlab='lagged values of Residuals')
lines(lowess(z))
abline(lm(z))
grid()
dev.off()
bitmap(file='test6.png')
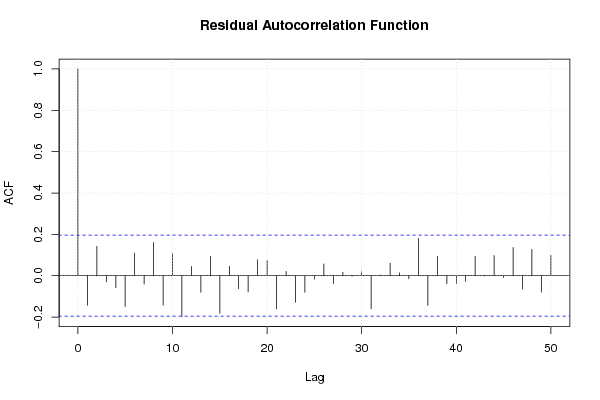
acf(mysum$resid, lag.max=length(mysum$resid)/2, main='Residual Autocorrelation Function')
grid()
dev.off()
bitmap(file='test7.png')
pacf(mysum$resid, lag.max=length(mysum$resid)/2, main='Residual Partial Autocorrelation Function')
grid()
dev.off()
bitmap(file='test8.png')
opar <- par(mfrow = c(2,2), oma = c(0, 0, 1.1, 0))
plot(mylm, las = 1, sub='Residual Diagnostics')
par(opar)
dev.off()
if (n > n25) {
bitmap(file='test9.png')
plot(kp3:nmkm3,gqarr[,2], main='Goldfeld-Quandt test',ylab='2-sided p-value',xlab='breakpoint')
grid()
dev.off()
}
load(file='createtable')
a<-table.start()
a<-table.row.start(a)
a<-table.element(a, 'Multiple Linear Regression - Estimated Regression Equation', 1, TRUE)
a<-table.row.end(a)
myeq <- colnames(x)[1]
myeq <- paste(myeq, '[t] = ', sep='')
for (i in 1:k){
if (mysum$coefficients[i,1] > 0) myeq <- paste(myeq, '+', '')
myeq <- paste(myeq, signif(mysum$coefficients[i,1],6), sep=' ')
if (rownames(mysum$coefficients)[i] != '(Intercept)') {
myeq <- paste(myeq, rownames(mysum$coefficients)[i], sep='')
if (rownames(mysum$coefficients)[i] != 't') myeq <- paste(myeq, '[t]', sep='')
}
}
myeq <- paste(myeq, ' + e[t]')
a<-table.row.start(a)
a<-table.element(a, myeq)
a<-table.row.end(a)
a<-table.row.start(a)
a<-table.element(a, mywarning)
a<-table.row.end(a)
a<-table.end(a)
table.save(a,file='mytable1.tab')
a<-table.start()
a<-table.row.start(a)
a<-table.element(a,'Multiple Linear Regression - Ordinary Least Squares', 6, TRUE)
a<-table.row.end(a)
a<-table.row.start(a)
a<-table.element(a,'Variable',header=TRUE)
a<-table.element(a,'Parameter',header=TRUE)
a<-table.element(a,'S.D.',header=TRUE)
a<-table.element(a,'T-STAT
H0: parameter = 0',header=TRUE)
a<-table.element(a,'2-tail p-value',header=TRUE)
a<-table.element(a,'1-tail p-value',header=TRUE)
a<-table.row.end(a)
for (i in 1:k){
a<-table.row.start(a)
a<-table.element(a,rownames(mysum$coefficients)[i],header=TRUE)
a<-table.element(a,formatC(signif(mysum$coefficients[i,1],5),format='g',flag='+'))
a<-table.element(a,formatC(signif(mysum$coefficients[i,2],5),format='g',flag=' '))
a<-table.element(a,formatC(signif(mysum$coefficients[i,3],4),format='e',flag='+'))
a<-table.element(a,formatC(signif(mysum$coefficients[i,4],4),format='g',flag=' '))
a<-table.element(a,formatC(signif(mysum$coefficients[i,4]/2,4),format='g',flag=' '))
a<-table.row.end(a)
}
a<-table.end(a)
table.save(a,file='mytable2.tab')
a<-table.start()
a<-table.row.start(a)
a<-table.element(a, 'Multiple Linear Regression - Regression Statistics', 2, TRUE)
a<-table.row.end(a)
a<-table.row.start(a)
a<-table.element(a, 'Multiple R',1,TRUE)
a<-table.element(a,formatC(signif(sqrt(mysum$r.squared),6),format='g',flag=' '))
a<-table.row.end(a)
a<-table.row.start(a)
a<-table.element(a, 'R-squared',1,TRUE)
a<-table.element(a,formatC(signif(mysum$r.squared,6),format='g',flag=' '))
a<-table.row.end(a)
a<-table.row.start(a)
a<-table.element(a, 'Adjusted R-squared',1,TRUE)
a<-table.element(a,formatC(signif(mysum$adj.r.squared,6),format='g',flag=' '))
a<-table.row.end(a)
a<-table.row.start(a)
a<-table.element(a, 'F-TEST (value)',1,TRUE)
a<-table.element(a,formatC(signif(mysum$fstatistic[1],6),format='g',flag=' '))
a<-table.row.end(a)
a<-table.row.start(a)
a<-table.element(a, 'F-TEST (DF numerator)',1,TRUE)
a<-table.element(a, signif(mysum$fstatistic[2],6))
a<-table.row.end(a)
a<-table.row.start(a)
a<-table.element(a, 'F-TEST (DF denominator)',1,TRUE)
a<-table.element(a, signif(mysum$fstatistic[3],6))
a<-table.row.end(a)
a<-table.row.start(a)
a<-table.element(a, 'p-value',1,TRUE)
a<-table.element(a,formatC(signif(1-pf(mysum$fstatistic[1],mysum$fstatistic[2],mysum$fstatistic[3]),6),format='g',flag=' '))
a<-table.row.end(a)
a<-table.row.start(a)
a<-table.element(a, 'Multiple Linear Regression - Residual Statistics', 2, TRUE)
a<-table.row.end(a)
a<-table.row.start(a)
a<-table.element(a, 'Residual Standard Deviation',1,TRUE)
a<-table.element(a,formatC(signif(mysum$sigma,6),format='g',flag=' '))
a<-table.row.end(a)
a<-table.row.start(a)
a<-table.element(a, 'Sum Squared Residuals',1,TRUE)
a<-table.element(a,formatC(signif(sum(myerror*myerror),6),format='g',flag=' '))
a<-table.row.end(a)
a<-table.end(a)
table.save(a,file='mytable3.tab')
myr <- as.numeric(mysum$resid)
myr
if(n < 200) {
a<-table.start()
a<-table.row.start(a)
a<-table.element(a, 'Multiple Linear Regression - Actuals, Interpolation, and Residuals', 4, TRUE)
a<-table.row.end(a)
a<-table.row.start(a)
a<-table.element(a, 'Time or Index', 1, TRUE)
a<-table.element(a, 'Actuals', 1, TRUE)
a<-table.element(a, 'Interpolation
Forecast', 1, TRUE)
a<-table.element(a, 'Residuals
Prediction Error', 1, TRUE)
a<-table.row.end(a)
for (i in 1:n) {
a<-table.row.start(a)
a<-table.element(a,i, 1, TRUE)
a<-table.element(a,formatC(signif(x[i],6),format='g',flag=' '))
a<-table.element(a,formatC(signif(x[i]-mysum$resid[i],6),format='g',flag=' '))
a<-table.element(a,formatC(signif(mysum$resid[i],6),format='g',flag=' '))
a<-table.row.end(a)
}
a<-table.end(a)
table.save(a,file='mytable4.tab')
if (n > n25) {
a<-table.start()
a<-table.row.start(a)
a<-table.element(a,'Goldfeld-Quandt test for Heteroskedasticity',4,TRUE)
a<-table.row.end(a)
a<-table.row.start(a)
a<-table.element(a,'p-values',header=TRUE)
a<-table.element(a,'Alternative Hypothesis',3,header=TRUE)
a<-table.row.end(a)
a<-table.row.start(a)
a<-table.element(a,'breakpoint index',header=TRUE)
a<-table.element(a,'greater',header=TRUE)
a<-table.element(a,'2-sided',header=TRUE)
a<-table.element(a,'less',header=TRUE)
a<-table.row.end(a)
for (mypoint in kp3:nmkm3) {
a<-table.row.start(a)
a<-table.element(a,mypoint,header=TRUE)
a<-table.element(a,formatC(signif(gqarr[mypoint-kp3+1,1],6),format='g',flag=' '))
a<-table.element(a,formatC(signif(gqarr[mypoint-kp3+1,2],6),format='g',flag=' '))
a<-table.element(a,formatC(signif(gqarr[mypoint-kp3+1,3],6),format='g',flag=' '))
a<-table.row.end(a)
}
a<-table.end(a)
table.save(a,file='mytable5.tab')
a<-table.start()
a<-table.row.start(a)
a<-table.element(a,'Meta Analysis of Goldfeld-Quandt test for Heteroskedasticity',4,TRUE)
a<-table.row.end(a)
a<-table.row.start(a)
a<-table.element(a,'Description',header=TRUE)
a<-table.element(a,'# significant tests',header=TRUE)
a<-table.element(a,'% significant tests',header=TRUE)
a<-table.element(a,'OK/NOK',header=TRUE)
a<-table.row.end(a)
a<-table.row.start(a)
a<-table.element(a,'1% type I error level',header=TRUE)
a<-table.element(a,signif(numsignificant1,6))
a<-table.element(a,formatC(signif(numsignificant1/numgqtests,6),format='g',flag=' '))
if (numsignificant1/numgqtests < 0.01) dum <- 'OK' else dum <- 'NOK'
a<-table.element(a,dum)
a<-table.row.end(a)
a<-table.row.start(a)
a<-table.element(a,'5% type I error level',header=TRUE)
a<-table.element(a,signif(numsignificant5,6))
a<-table.element(a,signif(numsignificant5/numgqtests,6))
if (numsignificant5/numgqtests < 0.05) dum <- 'OK' else dum <- 'NOK'
a<-table.element(a,dum)
a<-table.row.end(a)
a<-table.row.start(a)
a<-table.element(a,'10% type I error level',header=TRUE)
a<-table.element(a,signif(numsignificant10,6))
a<-table.element(a,signif(numsignificant10/numgqtests,6))
if (numsignificant10/numgqtests < 0.1) dum <- 'OK' else dum <- 'NOK'
a<-table.element(a,dum)
a<-table.row.end(a)
a<-table.end(a)
table.save(a,file='mytable6.tab')
}
}
a<-table.start()
a<-table.row.start(a)
a<-table.element(a,'Ramsey RESET F-Test for powers (2 and 3) of fitted values',1,TRUE)
a<-table.row.end(a)
a<-table.row.start(a)
reset_test_fitted <- resettest(mylm,power=2:3,type='fitted')
a<-table.element(a,paste('
',RC.texteval('reset_test_fitted'),'
',sep=''))
a<-table.row.end(a)
a<-table.row.start(a)
a<-table.element(a,'Ramsey RESET F-Test for powers (2 and 3) of regressors',1,TRUE)
a<-table.row.end(a)
a<-table.row.start(a)
reset_test_regressors <- resettest(mylm,power=2:3,type='regressor')
a<-table.element(a,paste('
',RC.texteval('reset_test_regressors'),'
',sep=''))
a<-table.row.end(a)
a<-table.row.start(a)
a<-table.element(a,'Ramsey RESET F-Test for powers (2 and 3) of principal components',1,TRUE)
a<-table.row.end(a)
a<-table.row.start(a)
reset_test_principal_components <- resettest(mylm,power=2:3,type='princomp')
a<-table.element(a,paste('
',RC.texteval('reset_test_principal_components'),'
',sep=''))
a<-table.row.end(a)
a<-table.end(a)
table.save(a,file='mytable8.tab')
a<-table.start()
a<-table.row.start(a)
a<-table.element(a,'Variance Inflation Factors (Multicollinearity)',1,TRUE)
a<-table.row.end(a)
a<-table.row.start(a)
vif <- vif(mylm)
a<-table.element(a,paste('
',RC.texteval('vif'),'
',sep=''))
a<-table.row.end(a)
a<-table.end(a)
table.save(a,file='mytable9.tab')