Free Statistics

of Irreproducible Research!

Author's title

Author*The author of this computation has been verified*
R Software Modulerwasp_multipleregression.wasp
Title produced by softwareMultiple Regression
Date of computationWed, 25 Jan 2017 10:50:40 +0100
Cite this page as followsStatistical Computations at FreeStatistics.org, Office for Research Development and Education, URL https://freestatistics.org/blog/index.php?v=date/2017/Jan/25/t1485338337xmpn8swdp7yzgj5.htm/, Retrieved Mon, 13 May 2024 22:46:06 +0000
Statistical Computations at FreeStatistics.org, Office for Research Development and Education, URL https://freestatistics.org/blog/index.php?pk=306488, Retrieved Mon, 13 May 2024 22:46:06 +0000
QR Codes:

Original text written by user:
IsPrivate?No (this computation is public)
User-defined keywords
Estimated Impact54
Family? (F = Feedback message, R = changed R code, M = changed R Module, P = changed Parameters, D = changed Data)
-       [Multiple Regression] [Vraag 11] [2017-01-25 09:50:40] [31f526a885cd288e1bc58dc4a6a7fb1f] [Current]
Feedback Forum

Post a new message
Dataseries X:
13 14 4 2 4 3 5 4
16 19 5 3 3 4 5 4
17 17 4 4 5 4 5 4
NA 17 3 4 3 3 4 4
NA 15 4 4 5 4 5 4
16 20 3 4 4 4 5 5
NA 15 3 4 4 3 3 4
NA 19 3 4 5 4 4 4
NA 15 4 5 4 4 5 5
17 15 4 5 5 4 5 5
17 19 4 4 2 4 5 4
15 NA 4 4 5 3 5 4
16 20 4 4 4 3 4 5
14 18 3 3 5 4 4 5
16 15 4 4 5 4 2 5
17 14 3 4 5 4 4 5
NA 20 3 4 5 4 4 5
NA NA NA NA 5 NA 5 5
NA 16 5 5 4 3 4 4
NA 16 4 4 4 4 5 4
16 16 3 4 5 3 4 5
NA 10 4 4 4 4 5 5
16 19 4 4 5 4 4 5
NA 19 4 4 5 4 4 4
NA 16 4 4 5 4 4 5
NA 15 3 4 4 4 4 4
16 18 3 4 4 3 5 5
15 17 4 4 4 4 4 4
16 19 2 4 5 4 5 5
16 17 5 4 4 4 4 4
13 NA 4 3 5 4 4 4
15 19 4 5 5 4 5 5
17 20 5 4 5 4 4 5
NA 5 4 3 5 4 NA 5
13 19 2 3 5 4 5 4
17 16 4 5 2 4 4 4
NA 15 3 4 5 4 4 4
14 16 4 3 5 3 4 5
14 18 4 3 3 4 4 4
18 16 4 4 5 4 4 4
NA 15 5 4 4 4 4 4
17 17 4 5 5 4 5 5
13 NA 3 3 4 4 4 4
16 20 5 5 5 3 5 5
15 19 5 4 5 3 4 4
15 7 4 4 4 3 4 5
NA 13 4 4 4 4 4 4
15 16 3 5 5 3 3 4
13 16 4 4 4 4 5 4
NA NA 2 3 4 2 NA 4
17 18 4 5 5 4 4 4
NA 18 5 5 2 4 5 4
NA 16 5 5 5 4 4 4
11 17 4 3 5 4 5 5
14 19 4 3 4 3 4 5
13 16 4 4 5 4 4 4
NA 19 3 4 4 3 3 4
17 13 3 4 4 4 4 3
16 16 4 4 4 3 5 4
NA 13 4 4 4 4 5 4
17 12 5 5 3 4 5 5
16 17 2 4 4 4 5 5
16 17 4 4 4 4 5 5
16 17 3 4 4 4 2 4
15 16 4 4 5 4 5 5
12 16 4 2 4 4 4 4
17 14 4 4 4 3 5 3
14 16 4 4 4 3 5 4
14 13 5 4 5 3 3 5
16 16 3 4 4 3 5 5
NA 14 3 4 4 3 4 5
NA 20 4 5 5 5 5 4
NA 12 4 4 3 4 NA 4
NA 13 4 4 4 4 4 4
NA 18 4 4 4 5 5 4
15 14 3 4 3 4 4 4
16 19 4 4 4 4 5 4
14 18 3 4 5 3 5 5
15 14 3 3 5 4 4 5
17 18 4 3 5 4 4 4
NA 19 4 4 5 4 4 5
10 15 3 3 3 4 4 4
NA 14 4 4 4 4 5 4
17 17 4 4 3 4 5 5
NA 19 4 4 4 4 5 5
20 13 5 4 4 4 4 4
17 19 5 4 3 5 4 5
18 18 4 4 5 4 5 5
NA 20 3 4 5 4 4 5
17 15 3 NA 4 4 4 4
14 15 4 2 3 3 4 4
NA 15 4 4 5 4 4 3
17 20 4 4 5 4 4 5
NA 15 4 4 4 4 5 4
17 19 4 5 4 4 5 3
NA 18 3 4 4 3 5 5
16 18 4 4 5 4 4 5
18 15 5 4 3 4 4 5
18 20 5 4 5 5 4 5
16 17 4 5 4 4 5 5
NA 12 3 4 5 4 4 5
NA 18 5 3 4 4 5 5
15 19 4 4 5 4 4 5
13 20 5 4 4 4 4 5
NA NA 3 4 4 3 NA 4
NA 17 5 4 4 5 5 5
NA 15 4 4 5 3 NA 5
NA 16 4 4 3 3 4 3
NA 18 4 4 5 4 4 4
16 18 4 4 5 4 4 4
NA 14 3 4 5 4 5 3
NA 15 4 4 4 4 4 4
NA 12 4 4 4 3 4 5
12 17 3 3 4 3 5 5
NA 14 4 4 4 3 4 4
16 18 3 4 5 4 4 4
16 17 4 4 5 4 3 4
NA 17 5 4 5 1 5 5
16 20 5 4 5 4 5 5
14 16 4 4 4 4 4 3
15 14 4 4 5 3 4 4
14 15 3 4 4 3 4 5
NA 18 4 4 4 4 4 4
15 20 4 4 4 4 5 4
NA 17 4 5 3 4 4 4
15 17 3 4 4 4 4 4
16 17 4 4 4 3 4 4
NA 17 4 4 4 4 4 5
NA 15 3 4 3 3 4 4
NA 17 4 4 4 3 4 3
11 18 3 2 4 2 4 4
NA 17 4 4 4 3 5 4
18 20 5 4 4 3 5 4
NA 15 2 4 4 3 3 5
11 16 3 3 4 4 4 4
NA 15 4 4 4 3 4 4
18 18 5 5 4 4 5 4
NA 11 NA NA 2 NA NA NA
15 15 4 5 5 4 4 4
19 18 5 5 5 5 5 4
17 20 4 5 5 4 5 5
NA 19 4 4 4 3 4 5
14 14 3 4 5 4 5 4
NA 16 4 4 5 4 4 4
13 15 4 4 2 4 4 4
17 17 4 4 3 4 5 5
14 18 4 4 4 4 5 5
19 20 5 4 5 3 5 4
14 17 4 3 5 4 4 4
NA 18 4 4 5 4 4 4
NA 15 3 3 2 3 4 4
16 16 4 5 5 4 4 3
16 11 4 4 4 3 4 4
15 15 4 4 4 4 4 5
12 18 3 4 5 3 5 5
NA 17 4 4 5 4 4 5
17 16 5 4 5 4 5 4
NA 12 4 4 5 4 3 4
NA 19 2 3 5 4 4 4
18 18 4 4 4 4 4 5
15 15 4 3 4 3 5 5
18 17 4 4 4 4 4 3
15 19 4 5 5 5 4 4
NA 18 5 4 3 4 4 4
NA 19 5 4 4 3 4 4
NA 16 3 3 1 4 5 5
16 16 4 4 4 4 4 5
NA 16 4 4 4 4 5 4
16 14 2 3 4 5 5 4


Summary of computational transaction
Raw Input view raw input (R code)
Raw Outputview raw output of R engine
Computing time9 seconds
R ServerBig Analytics Cloud Computing Center
R Framework error message
Warning: there are blank lines in the 'Data X' field.
Please, use NA for missing data - blank lines are simply
 deleted and are NOT treated as missing values.

\begin{tabular}{lllllllll}
\hline
Summary of computational transaction \tabularnewline
Raw Input view raw input (R code)  \tabularnewline
Raw Outputview raw output of R engine  \tabularnewline
Computing time9 seconds \tabularnewline
R ServerBig Analytics Cloud Computing Center \tabularnewline
R Framework error message & 
Warning: there are blank lines in the 'Data X' field.
Please, use NA for missing data - blank lines are simply
 deleted and are NOT treated as missing values.
\tabularnewline \hline \end{tabular} %Source: https://freestatistics.org/blog/index.php?pk=306488&T=0

[TABLE]
[ROW]
Summary of computational transaction[/C][/ROW] [ROW]Raw Input[/C] view raw input (R code) [/C][/ROW] [ROW]Raw Output[/C]view raw output of R engine [/C][/ROW] [ROW]Computing time[/C]9 seconds[/C][/ROW] [ROW]R Server[/C]Big Analytics Cloud Computing Center[/C][/ROW] [ROW]R Framework error message[/C][C]
Warning: there are blank lines in the 'Data X' field.
Please, use NA for missing data - blank lines are simply
 deleted and are NOT treated as missing values.
[/C][/ROW] [/TABLE] Source: https://freestatistics.org/blog/index.php?pk=306488&T=0

Globally Unique Identifier (entire table): ba.freestatistics.org/blog/index.php?pk=306488&T=0

As an alternative you can also use a QR Code:  

The GUIDs for individual cells are displayed in the table below:

Summary of computational transaction
Raw Input view raw input (R code)
Raw Outputview raw output of R engine
Computing time9 seconds
R ServerBig Analytics Cloud Computing Center
R Framework error message
Warning: there are blank lines in the 'Data X' field.
Please, use NA for missing data - blank lines are simply
 deleted and are NOT treated as missing values.


Multiple Linear Regression - Estimated Regression Equation
TVDC[t] = + 6.21559 + 0.0032006ITHSUM[t] + 0.647678SKEOU1[t] + 1.14898SKEOU2[t] + 0.0122695SKEOU3[t] + 0.497619SKEOU4[t] + 0.145986SKEOU5[t] -0.0798165SKEOU6[t] + e[t]
Warning: you did not specify the column number of the endogenous series! The first column was selected by default.

\begin{tabular}{lllllllll}
\hline
Multiple Linear Regression - Estimated Regression Equation \tabularnewline
TVDC[t] =  +  6.21559 +  0.0032006ITHSUM[t] +  0.647678SKEOU1[t] +  1.14898SKEOU2[t] +  0.0122695SKEOU3[t] +  0.497619SKEOU4[t] +  0.145986SKEOU5[t] -0.0798165SKEOU6[t]  + e[t] \tabularnewline
Warning: you did not specify the column number of the endogenous series! The first column was selected by default. \tabularnewline
\hline
\end{tabular}
%Source: https://freestatistics.org/blog/index.php?pk=306488&T=1

[TABLE]
[ROW][C]Multiple Linear Regression - Estimated Regression Equation[/C][/ROW]
[ROW][C]TVDC[t] =  +  6.21559 +  0.0032006ITHSUM[t] +  0.647678SKEOU1[t] +  1.14898SKEOU2[t] +  0.0122695SKEOU3[t] +  0.497619SKEOU4[t] +  0.145986SKEOU5[t] -0.0798165SKEOU6[t]  + e[t][/C][/ROW]
[ROW][C]Warning: you did not specify the column number of the endogenous series! The first column was selected by default.[/C][/ROW]
[/TABLE]
Source: https://freestatistics.org/blog/index.php?pk=306488&T=1

Globally Unique Identifier (entire table): ba.freestatistics.org/blog/index.php?pk=306488&T=1

As an alternative you can also use a QR Code:  

The GUIDs for individual cells are displayed in the table below:

Multiple Linear Regression - Estimated Regression Equation
TVDC[t] = + 6.21559 + 0.0032006ITHSUM[t] + 0.647678SKEOU1[t] + 1.14898SKEOU2[t] + 0.0122695SKEOU3[t] + 0.497619SKEOU4[t] + 0.145986SKEOU5[t] -0.0798165SKEOU6[t] + e[t]
Warning: you did not specify the column number of the endogenous series! The first column was selected by default.


Multiple Linear Regression - Ordinary Least Squares
VariableParameterS.D.T-STATH0: parameter = 02-tail p-value1-tail p-value
(Intercept)+6.216 2.218+2.8020e+00 0.0062 0.0031
ITHSUM+0.003201 0.0738+4.3370e-02 0.9655 0.4828
SKEOU1+0.6477 0.2212+2.9280e+00 0.004311 0.002155
SKEOU2+1.149 0.2463+4.6640e+00 1.059e-05 5.297e-06
SKEOU3+0.01227 0.2134+5.7490e-02 0.9543 0.4771
SKEOU4+0.4976 0.2995+1.6620e+00 0.1 0.05002
SKEOU5+0.146 0.252+5.7930e-01 0.5638 0.2819
SKEOU6-0.07982 0.2642-3.0210e-01 0.7633 0.3816

\begin{tabular}{lllllllll}
\hline
Multiple Linear Regression - Ordinary Least Squares \tabularnewline
Variable & Parameter & S.D. & T-STATH0: parameter = 0 & 2-tail p-value & 1-tail p-value \tabularnewline
(Intercept) & +6.216 &  2.218 & +2.8020e+00 &  0.0062 &  0.0031 \tabularnewline
ITHSUM & +0.003201 &  0.0738 & +4.3370e-02 &  0.9655 &  0.4828 \tabularnewline
SKEOU1 & +0.6477 &  0.2212 & +2.9280e+00 &  0.004311 &  0.002155 \tabularnewline
SKEOU2 & +1.149 &  0.2463 & +4.6640e+00 &  1.059e-05 &  5.297e-06 \tabularnewline
SKEOU3 & +0.01227 &  0.2134 & +5.7490e-02 &  0.9543 &  0.4771 \tabularnewline
SKEOU4 & +0.4976 &  0.2995 & +1.6620e+00 &  0.1 &  0.05002 \tabularnewline
SKEOU5 & +0.146 &  0.252 & +5.7930e-01 &  0.5638 &  0.2819 \tabularnewline
SKEOU6 & -0.07982 &  0.2642 & -3.0210e-01 &  0.7633 &  0.3816 \tabularnewline
\hline
\end{tabular}
%Source: https://freestatistics.org/blog/index.php?pk=306488&T=2

[TABLE]
[ROW][C]Multiple Linear Regression - Ordinary Least Squares[/C][/ROW]
[ROW][C]Variable[/C][C]Parameter[/C][C]S.D.[/C][C]T-STATH0: parameter = 0[/C][C]2-tail p-value[/C][C]1-tail p-value[/C][/ROW]
[ROW][C](Intercept)[/C][C]+6.216[/C][C] 2.218[/C][C]+2.8020e+00[/C][C] 0.0062[/C][C] 0.0031[/C][/ROW]
[ROW][C]ITHSUM[/C][C]+0.003201[/C][C] 0.0738[/C][C]+4.3370e-02[/C][C] 0.9655[/C][C] 0.4828[/C][/ROW]
[ROW][C]SKEOU1[/C][C]+0.6477[/C][C] 0.2212[/C][C]+2.9280e+00[/C][C] 0.004311[/C][C] 0.002155[/C][/ROW]
[ROW][C]SKEOU2[/C][C]+1.149[/C][C] 0.2463[/C][C]+4.6640e+00[/C][C] 1.059e-05[/C][C] 5.297e-06[/C][/ROW]
[ROW][C]SKEOU3[/C][C]+0.01227[/C][C] 0.2134[/C][C]+5.7490e-02[/C][C] 0.9543[/C][C] 0.4771[/C][/ROW]
[ROW][C]SKEOU4[/C][C]+0.4976[/C][C] 0.2995[/C][C]+1.6620e+00[/C][C] 0.1[/C][C] 0.05002[/C][/ROW]
[ROW][C]SKEOU5[/C][C]+0.146[/C][C] 0.252[/C][C]+5.7930e-01[/C][C] 0.5638[/C][C] 0.2819[/C][/ROW]
[ROW][C]SKEOU6[/C][C]-0.07982[/C][C] 0.2642[/C][C]-3.0210e-01[/C][C] 0.7633[/C][C] 0.3816[/C][/ROW]
[/TABLE]
Source: https://freestatistics.org/blog/index.php?pk=306488&T=2

Globally Unique Identifier (entire table): ba.freestatistics.org/blog/index.php?pk=306488&T=2

As an alternative you can also use a QR Code:  

The GUIDs for individual cells are displayed in the table below:

Multiple Linear Regression - Ordinary Least Squares
VariableParameterS.D.T-STATH0: parameter = 02-tail p-value1-tail p-value
(Intercept)+6.216 2.218+2.8020e+00 0.0062 0.0031
ITHSUM+0.003201 0.0738+4.3370e-02 0.9655 0.4828
SKEOU1+0.6477 0.2212+2.9280e+00 0.004311 0.002155
SKEOU2+1.149 0.2463+4.6640e+00 1.059e-05 5.297e-06
SKEOU3+0.01227 0.2134+5.7490e-02 0.9543 0.4771
SKEOU4+0.4976 0.2995+1.6620e+00 0.1 0.05002
SKEOU5+0.146 0.252+5.7930e-01 0.5638 0.2819
SKEOU6-0.07982 0.2642-3.0210e-01 0.7633 0.3816


Multiple Linear Regression - Regression Statistics
Multiple R 0.6039
R-squared 0.3647
Adjusted R-squared 0.3158
F-TEST (value) 7.463
F-TEST (DF numerator)7
F-TEST (DF denominator)91
p-value 4.422e-07
Multiple Linear Regression - Residual Statistics
Residual Standard Deviation 1.547
Sum Squared Residuals 217.7

\begin{tabular}{lllllllll}
\hline
Multiple Linear Regression - Regression Statistics \tabularnewline
Multiple R &  0.6039 \tabularnewline
R-squared &  0.3647 \tabularnewline
Adjusted R-squared &  0.3158 \tabularnewline
F-TEST (value) &  7.463 \tabularnewline
F-TEST (DF numerator) & 7 \tabularnewline
F-TEST (DF denominator) & 91 \tabularnewline
p-value &  4.422e-07 \tabularnewline
Multiple Linear Regression - Residual Statistics \tabularnewline
Residual Standard Deviation &  1.547 \tabularnewline
Sum Squared Residuals &  217.7 \tabularnewline
\hline
\end{tabular}
%Source: https://freestatistics.org/blog/index.php?pk=306488&T=3

[TABLE]
[ROW][C]Multiple Linear Regression - Regression Statistics[/C][/ROW]
[ROW][C]Multiple R[/C][C] 0.6039[/C][/ROW]
[ROW][C]R-squared[/C][C] 0.3647[/C][/ROW]
[ROW][C]Adjusted R-squared[/C][C] 0.3158[/C][/ROW]
[ROW][C]F-TEST (value)[/C][C] 7.463[/C][/ROW]
[ROW][C]F-TEST (DF numerator)[/C][C]7[/C][/ROW]
[ROW][C]F-TEST (DF denominator)[/C][C]91[/C][/ROW]
[ROW][C]p-value[/C][C] 4.422e-07[/C][/ROW]
[ROW][C]Multiple Linear Regression - Residual Statistics[/C][/ROW]
[ROW][C]Residual Standard Deviation[/C][C] 1.547[/C][/ROW]
[ROW][C]Sum Squared Residuals[/C][C] 217.7[/C][/ROW]
[/TABLE]
Source: https://freestatistics.org/blog/index.php?pk=306488&T=3

Globally Unique Identifier (entire table): ba.freestatistics.org/blog/index.php?pk=306488&T=3

As an alternative you can also use a QR Code:  

The GUIDs for individual cells are displayed in the table below:

Multiple Linear Regression - Regression Statistics
Multiple R 0.6039
R-squared 0.3647
Adjusted R-squared 0.3158
F-TEST (value) 7.463
F-TEST (DF numerator)7
F-TEST (DF denominator)91
p-value 4.422e-07
Multiple Linear Regression - Residual Statistics
Residual Standard Deviation 1.547
Sum Squared Residuals 217.7


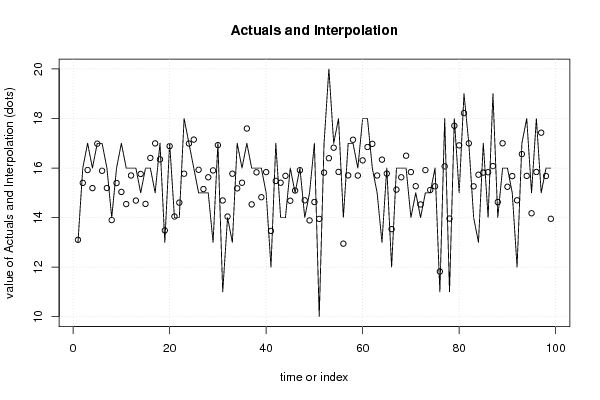
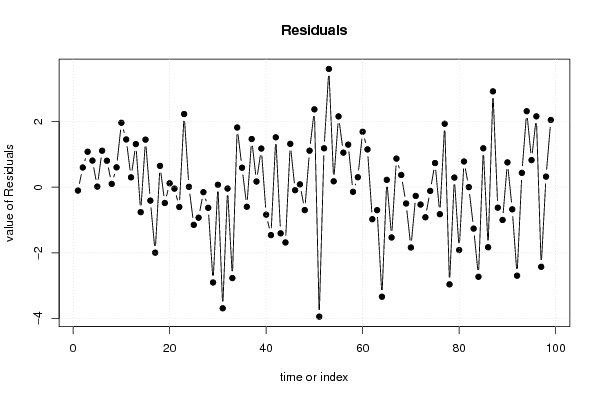
Multiple Linear Regression - Actuals, Interpolation, and Residuals
Time or IndexActualsInterpolationForecastResidualsPrediction Error
1 13 13.1-0.1017
2 16 15.4 0.6003
3 17 15.92 1.081
4 16 15.19 0.811
5 17 16.98 0.01813
6 17 15.89 1.111
7 16 15.19 0.807
8 14 13.9 0.1001
9 16 15.39 0.6051
10 17 15.04 1.964
11 16 14.54 1.455
12 16 15.7 0.3003
13 16 14.68 1.315
14 15 15.76-0.7609
15 16 14.55 1.45
16 16 16.41-0.4085
17 15 16.99-1.995
18 17 16.35 0.6494
19 13 13.48-0.4812
20 17 16.88 0.1179
21 14 14.04-0.04351
22 14 14.6-0.6028
23 18 15.77 2.23
24 17 16.99 0.01173
25 16 17.15-1.148
26 15 15.93-0.9296
27 15 15.15-0.1514
28 15 15.63-0.6276
29 13 15.9-2.904
30 17 16.93 0.07469
31 11 14.69-3.69
32 14 14.04-0.04085
33 13 15.77-2.77
34 17 15.18 1.82
35 16 15.41 0.594
36 17 17.6-0.5954
37 16 14.53 1.468
38 16 15.83 0.173
39 16 14.82 1.179
40 15 15.84-0.8361
41 12 13.46-1.46
42 17 15.48 1.521
43 14 15.41-1.406
44 14 15.68-1.685
45 16 14.68 1.321
46 15 15.09-0.09131
47 16 15.91 0.08676
48 14 14.7-0.6972
49 15 13.89 1.113
50 17 14.63 2.373
51 10 13.95-3.946
52 17 15.81 1.185
53 20 16.4 3.604
54 17 16.82 0.1795
55 18 15.84 2.158
56 14 12.95 1.053
57 17 15.7 1.297
58 17 17.14-0.142
59 16 15.7 0.3035
60 18 16.31 1.69
61 18 16.85 1.152
62 16 16.98-0.976
63 15 15.7-0.6997
64 13 16.34-3.338
65 16 15.78 0.2237
66 12 13.53-1.533
67 16 15.13 0.8713
68 16 15.63 0.3729
69 16 16.5-0.4966
70 14 15.84-1.837
71 15 15.27-0.2659
72 14 14.53-0.5293
73 15 15.92-0.9164
74 15 15.11-0.1132
75 16 15.26 0.7368
76 11 11.82-0.8232
77 18 16.07 1.933
78 11 13.96-2.961
79 18 17.71 0.2933
80 15 16.92-1.916
81 19 18.22 0.7834
82 17 17 0.002124
83 14 15.26-1.262
84 13 15.73-2.73
85 17 15.81 1.185
86 14 15.83-1.83
87 19 16.08 2.921
88 14 14.62-0.6241
89 16 17-0.9987
90 16 15.24 0.756
91 15 15.67-0.6746
92 12 14.7-2.697
93 17 16.56 0.4364
94 18 15.68 2.316
95 15 14.17 0.826
96 18 15.84 2.159
97 15 17.43-2.426
98 16 15.68 0.3222
99 16 13.95 2.049

\begin{tabular}{lllllllll}
\hline
Multiple Linear Regression - Actuals, Interpolation, and Residuals \tabularnewline
Time or Index & Actuals & InterpolationForecast & ResidualsPrediction Error \tabularnewline
1 &  13 &  13.1 & -0.1017 \tabularnewline
2 &  16 &  15.4 &  0.6003 \tabularnewline
3 &  17 &  15.92 &  1.081 \tabularnewline
4 &  16 &  15.19 &  0.811 \tabularnewline
5 &  17 &  16.98 &  0.01813 \tabularnewline
6 &  17 &  15.89 &  1.111 \tabularnewline
7 &  16 &  15.19 &  0.807 \tabularnewline
8 &  14 &  13.9 &  0.1001 \tabularnewline
9 &  16 &  15.39 &  0.6051 \tabularnewline
10 &  17 &  15.04 &  1.964 \tabularnewline
11 &  16 &  14.54 &  1.455 \tabularnewline
12 &  16 &  15.7 &  0.3003 \tabularnewline
13 &  16 &  14.68 &  1.315 \tabularnewline
14 &  15 &  15.76 & -0.7609 \tabularnewline
15 &  16 &  14.55 &  1.45 \tabularnewline
16 &  16 &  16.41 & -0.4085 \tabularnewline
17 &  15 &  16.99 & -1.995 \tabularnewline
18 &  17 &  16.35 &  0.6494 \tabularnewline
19 &  13 &  13.48 & -0.4812 \tabularnewline
20 &  17 &  16.88 &  0.1179 \tabularnewline
21 &  14 &  14.04 & -0.04351 \tabularnewline
22 &  14 &  14.6 & -0.6028 \tabularnewline
23 &  18 &  15.77 &  2.23 \tabularnewline
24 &  17 &  16.99 &  0.01173 \tabularnewline
25 &  16 &  17.15 & -1.148 \tabularnewline
26 &  15 &  15.93 & -0.9296 \tabularnewline
27 &  15 &  15.15 & -0.1514 \tabularnewline
28 &  15 &  15.63 & -0.6276 \tabularnewline
29 &  13 &  15.9 & -2.904 \tabularnewline
30 &  17 &  16.93 &  0.07469 \tabularnewline
31 &  11 &  14.69 & -3.69 \tabularnewline
32 &  14 &  14.04 & -0.04085 \tabularnewline
33 &  13 &  15.77 & -2.77 \tabularnewline
34 &  17 &  15.18 &  1.82 \tabularnewline
35 &  16 &  15.41 &  0.594 \tabularnewline
36 &  17 &  17.6 & -0.5954 \tabularnewline
37 &  16 &  14.53 &  1.468 \tabularnewline
38 &  16 &  15.83 &  0.173 \tabularnewline
39 &  16 &  14.82 &  1.179 \tabularnewline
40 &  15 &  15.84 & -0.8361 \tabularnewline
41 &  12 &  13.46 & -1.46 \tabularnewline
42 &  17 &  15.48 &  1.521 \tabularnewline
43 &  14 &  15.41 & -1.406 \tabularnewline
44 &  14 &  15.68 & -1.685 \tabularnewline
45 &  16 &  14.68 &  1.321 \tabularnewline
46 &  15 &  15.09 & -0.09131 \tabularnewline
47 &  16 &  15.91 &  0.08676 \tabularnewline
48 &  14 &  14.7 & -0.6972 \tabularnewline
49 &  15 &  13.89 &  1.113 \tabularnewline
50 &  17 &  14.63 &  2.373 \tabularnewline
51 &  10 &  13.95 & -3.946 \tabularnewline
52 &  17 &  15.81 &  1.185 \tabularnewline
53 &  20 &  16.4 &  3.604 \tabularnewline
54 &  17 &  16.82 &  0.1795 \tabularnewline
55 &  18 &  15.84 &  2.158 \tabularnewline
56 &  14 &  12.95 &  1.053 \tabularnewline
57 &  17 &  15.7 &  1.297 \tabularnewline
58 &  17 &  17.14 & -0.142 \tabularnewline
59 &  16 &  15.7 &  0.3035 \tabularnewline
60 &  18 &  16.31 &  1.69 \tabularnewline
61 &  18 &  16.85 &  1.152 \tabularnewline
62 &  16 &  16.98 & -0.976 \tabularnewline
63 &  15 &  15.7 & -0.6997 \tabularnewline
64 &  13 &  16.34 & -3.338 \tabularnewline
65 &  16 &  15.78 &  0.2237 \tabularnewline
66 &  12 &  13.53 & -1.533 \tabularnewline
67 &  16 &  15.13 &  0.8713 \tabularnewline
68 &  16 &  15.63 &  0.3729 \tabularnewline
69 &  16 &  16.5 & -0.4966 \tabularnewline
70 &  14 &  15.84 & -1.837 \tabularnewline
71 &  15 &  15.27 & -0.2659 \tabularnewline
72 &  14 &  14.53 & -0.5293 \tabularnewline
73 &  15 &  15.92 & -0.9164 \tabularnewline
74 &  15 &  15.11 & -0.1132 \tabularnewline
75 &  16 &  15.26 &  0.7368 \tabularnewline
76 &  11 &  11.82 & -0.8232 \tabularnewline
77 &  18 &  16.07 &  1.933 \tabularnewline
78 &  11 &  13.96 & -2.961 \tabularnewline
79 &  18 &  17.71 &  0.2933 \tabularnewline
80 &  15 &  16.92 & -1.916 \tabularnewline
81 &  19 &  18.22 &  0.7834 \tabularnewline
82 &  17 &  17 &  0.002124 \tabularnewline
83 &  14 &  15.26 & -1.262 \tabularnewline
84 &  13 &  15.73 & -2.73 \tabularnewline
85 &  17 &  15.81 &  1.185 \tabularnewline
86 &  14 &  15.83 & -1.83 \tabularnewline
87 &  19 &  16.08 &  2.921 \tabularnewline
88 &  14 &  14.62 & -0.6241 \tabularnewline
89 &  16 &  17 & -0.9987 \tabularnewline
90 &  16 &  15.24 &  0.756 \tabularnewline
91 &  15 &  15.67 & -0.6746 \tabularnewline
92 &  12 &  14.7 & -2.697 \tabularnewline
93 &  17 &  16.56 &  0.4364 \tabularnewline
94 &  18 &  15.68 &  2.316 \tabularnewline
95 &  15 &  14.17 &  0.826 \tabularnewline
96 &  18 &  15.84 &  2.159 \tabularnewline
97 &  15 &  17.43 & -2.426 \tabularnewline
98 &  16 &  15.68 &  0.3222 \tabularnewline
99 &  16 &  13.95 &  2.049 \tabularnewline
\hline
\end{tabular}
%Source: https://freestatistics.org/blog/index.php?pk=306488&T=4

[TABLE]
[ROW][C]Multiple Linear Regression - Actuals, Interpolation, and Residuals[/C][/ROW]
[ROW][C]Time or Index[/C][C]Actuals[/C][C]InterpolationForecast[/C][C]ResidualsPrediction Error[/C][/ROW]
[ROW][C]1[/C][C] 13[/C][C] 13.1[/C][C]-0.1017[/C][/ROW]
[ROW][C]2[/C][C] 16[/C][C] 15.4[/C][C] 0.6003[/C][/ROW]
[ROW][C]3[/C][C] 17[/C][C] 15.92[/C][C] 1.081[/C][/ROW]
[ROW][C]4[/C][C] 16[/C][C] 15.19[/C][C] 0.811[/C][/ROW]
[ROW][C]5[/C][C] 17[/C][C] 16.98[/C][C] 0.01813[/C][/ROW]
[ROW][C]6[/C][C] 17[/C][C] 15.89[/C][C] 1.111[/C][/ROW]
[ROW][C]7[/C][C] 16[/C][C] 15.19[/C][C] 0.807[/C][/ROW]
[ROW][C]8[/C][C] 14[/C][C] 13.9[/C][C] 0.1001[/C][/ROW]
[ROW][C]9[/C][C] 16[/C][C] 15.39[/C][C] 0.6051[/C][/ROW]
[ROW][C]10[/C][C] 17[/C][C] 15.04[/C][C] 1.964[/C][/ROW]
[ROW][C]11[/C][C] 16[/C][C] 14.54[/C][C] 1.455[/C][/ROW]
[ROW][C]12[/C][C] 16[/C][C] 15.7[/C][C] 0.3003[/C][/ROW]
[ROW][C]13[/C][C] 16[/C][C] 14.68[/C][C] 1.315[/C][/ROW]
[ROW][C]14[/C][C] 15[/C][C] 15.76[/C][C]-0.7609[/C][/ROW]
[ROW][C]15[/C][C] 16[/C][C] 14.55[/C][C] 1.45[/C][/ROW]
[ROW][C]16[/C][C] 16[/C][C] 16.41[/C][C]-0.4085[/C][/ROW]
[ROW][C]17[/C][C] 15[/C][C] 16.99[/C][C]-1.995[/C][/ROW]
[ROW][C]18[/C][C] 17[/C][C] 16.35[/C][C] 0.6494[/C][/ROW]
[ROW][C]19[/C][C] 13[/C][C] 13.48[/C][C]-0.4812[/C][/ROW]
[ROW][C]20[/C][C] 17[/C][C] 16.88[/C][C] 0.1179[/C][/ROW]
[ROW][C]21[/C][C] 14[/C][C] 14.04[/C][C]-0.04351[/C][/ROW]
[ROW][C]22[/C][C] 14[/C][C] 14.6[/C][C]-0.6028[/C][/ROW]
[ROW][C]23[/C][C] 18[/C][C] 15.77[/C][C] 2.23[/C][/ROW]
[ROW][C]24[/C][C] 17[/C][C] 16.99[/C][C] 0.01173[/C][/ROW]
[ROW][C]25[/C][C] 16[/C][C] 17.15[/C][C]-1.148[/C][/ROW]
[ROW][C]26[/C][C] 15[/C][C] 15.93[/C][C]-0.9296[/C][/ROW]
[ROW][C]27[/C][C] 15[/C][C] 15.15[/C][C]-0.1514[/C][/ROW]
[ROW][C]28[/C][C] 15[/C][C] 15.63[/C][C]-0.6276[/C][/ROW]
[ROW][C]29[/C][C] 13[/C][C] 15.9[/C][C]-2.904[/C][/ROW]
[ROW][C]30[/C][C] 17[/C][C] 16.93[/C][C] 0.07469[/C][/ROW]
[ROW][C]31[/C][C] 11[/C][C] 14.69[/C][C]-3.69[/C][/ROW]
[ROW][C]32[/C][C] 14[/C][C] 14.04[/C][C]-0.04085[/C][/ROW]
[ROW][C]33[/C][C] 13[/C][C] 15.77[/C][C]-2.77[/C][/ROW]
[ROW][C]34[/C][C] 17[/C][C] 15.18[/C][C] 1.82[/C][/ROW]
[ROW][C]35[/C][C] 16[/C][C] 15.41[/C][C] 0.594[/C][/ROW]
[ROW][C]36[/C][C] 17[/C][C] 17.6[/C][C]-0.5954[/C][/ROW]
[ROW][C]37[/C][C] 16[/C][C] 14.53[/C][C] 1.468[/C][/ROW]
[ROW][C]38[/C][C] 16[/C][C] 15.83[/C][C] 0.173[/C][/ROW]
[ROW][C]39[/C][C] 16[/C][C] 14.82[/C][C] 1.179[/C][/ROW]
[ROW][C]40[/C][C] 15[/C][C] 15.84[/C][C]-0.8361[/C][/ROW]
[ROW][C]41[/C][C] 12[/C][C] 13.46[/C][C]-1.46[/C][/ROW]
[ROW][C]42[/C][C] 17[/C][C] 15.48[/C][C] 1.521[/C][/ROW]
[ROW][C]43[/C][C] 14[/C][C] 15.41[/C][C]-1.406[/C][/ROW]
[ROW][C]44[/C][C] 14[/C][C] 15.68[/C][C]-1.685[/C][/ROW]
[ROW][C]45[/C][C] 16[/C][C] 14.68[/C][C] 1.321[/C][/ROW]
[ROW][C]46[/C][C] 15[/C][C] 15.09[/C][C]-0.09131[/C][/ROW]
[ROW][C]47[/C][C] 16[/C][C] 15.91[/C][C] 0.08676[/C][/ROW]
[ROW][C]48[/C][C] 14[/C][C] 14.7[/C][C]-0.6972[/C][/ROW]
[ROW][C]49[/C][C] 15[/C][C] 13.89[/C][C] 1.113[/C][/ROW]
[ROW][C]50[/C][C] 17[/C][C] 14.63[/C][C] 2.373[/C][/ROW]
[ROW][C]51[/C][C] 10[/C][C] 13.95[/C][C]-3.946[/C][/ROW]
[ROW][C]52[/C][C] 17[/C][C] 15.81[/C][C] 1.185[/C][/ROW]
[ROW][C]53[/C][C] 20[/C][C] 16.4[/C][C] 3.604[/C][/ROW]
[ROW][C]54[/C][C] 17[/C][C] 16.82[/C][C] 0.1795[/C][/ROW]
[ROW][C]55[/C][C] 18[/C][C] 15.84[/C][C] 2.158[/C][/ROW]
[ROW][C]56[/C][C] 14[/C][C] 12.95[/C][C] 1.053[/C][/ROW]
[ROW][C]57[/C][C] 17[/C][C] 15.7[/C][C] 1.297[/C][/ROW]
[ROW][C]58[/C][C] 17[/C][C] 17.14[/C][C]-0.142[/C][/ROW]
[ROW][C]59[/C][C] 16[/C][C] 15.7[/C][C] 0.3035[/C][/ROW]
[ROW][C]60[/C][C] 18[/C][C] 16.31[/C][C] 1.69[/C][/ROW]
[ROW][C]61[/C][C] 18[/C][C] 16.85[/C][C] 1.152[/C][/ROW]
[ROW][C]62[/C][C] 16[/C][C] 16.98[/C][C]-0.976[/C][/ROW]
[ROW][C]63[/C][C] 15[/C][C] 15.7[/C][C]-0.6997[/C][/ROW]
[ROW][C]64[/C][C] 13[/C][C] 16.34[/C][C]-3.338[/C][/ROW]
[ROW][C]65[/C][C] 16[/C][C] 15.78[/C][C] 0.2237[/C][/ROW]
[ROW][C]66[/C][C] 12[/C][C] 13.53[/C][C]-1.533[/C][/ROW]
[ROW][C]67[/C][C] 16[/C][C] 15.13[/C][C] 0.8713[/C][/ROW]
[ROW][C]68[/C][C] 16[/C][C] 15.63[/C][C] 0.3729[/C][/ROW]
[ROW][C]69[/C][C] 16[/C][C] 16.5[/C][C]-0.4966[/C][/ROW]
[ROW][C]70[/C][C] 14[/C][C] 15.84[/C][C]-1.837[/C][/ROW]
[ROW][C]71[/C][C] 15[/C][C] 15.27[/C][C]-0.2659[/C][/ROW]
[ROW][C]72[/C][C] 14[/C][C] 14.53[/C][C]-0.5293[/C][/ROW]
[ROW][C]73[/C][C] 15[/C][C] 15.92[/C][C]-0.9164[/C][/ROW]
[ROW][C]74[/C][C] 15[/C][C] 15.11[/C][C]-0.1132[/C][/ROW]
[ROW][C]75[/C][C] 16[/C][C] 15.26[/C][C] 0.7368[/C][/ROW]
[ROW][C]76[/C][C] 11[/C][C] 11.82[/C][C]-0.8232[/C][/ROW]
[ROW][C]77[/C][C] 18[/C][C] 16.07[/C][C] 1.933[/C][/ROW]
[ROW][C]78[/C][C] 11[/C][C] 13.96[/C][C]-2.961[/C][/ROW]
[ROW][C]79[/C][C] 18[/C][C] 17.71[/C][C] 0.2933[/C][/ROW]
[ROW][C]80[/C][C] 15[/C][C] 16.92[/C][C]-1.916[/C][/ROW]
[ROW][C]81[/C][C] 19[/C][C] 18.22[/C][C] 0.7834[/C][/ROW]
[ROW][C]82[/C][C] 17[/C][C] 17[/C][C] 0.002124[/C][/ROW]
[ROW][C]83[/C][C] 14[/C][C] 15.26[/C][C]-1.262[/C][/ROW]
[ROW][C]84[/C][C] 13[/C][C] 15.73[/C][C]-2.73[/C][/ROW]
[ROW][C]85[/C][C] 17[/C][C] 15.81[/C][C] 1.185[/C][/ROW]
[ROW][C]86[/C][C] 14[/C][C] 15.83[/C][C]-1.83[/C][/ROW]
[ROW][C]87[/C][C] 19[/C][C] 16.08[/C][C] 2.921[/C][/ROW]
[ROW][C]88[/C][C] 14[/C][C] 14.62[/C][C]-0.6241[/C][/ROW]
[ROW][C]89[/C][C] 16[/C][C] 17[/C][C]-0.9987[/C][/ROW]
[ROW][C]90[/C][C] 16[/C][C] 15.24[/C][C] 0.756[/C][/ROW]
[ROW][C]91[/C][C] 15[/C][C] 15.67[/C][C]-0.6746[/C][/ROW]
[ROW][C]92[/C][C] 12[/C][C] 14.7[/C][C]-2.697[/C][/ROW]
[ROW][C]93[/C][C] 17[/C][C] 16.56[/C][C] 0.4364[/C][/ROW]
[ROW][C]94[/C][C] 18[/C][C] 15.68[/C][C] 2.316[/C][/ROW]
[ROW][C]95[/C][C] 15[/C][C] 14.17[/C][C] 0.826[/C][/ROW]
[ROW][C]96[/C][C] 18[/C][C] 15.84[/C][C] 2.159[/C][/ROW]
[ROW][C]97[/C][C] 15[/C][C] 17.43[/C][C]-2.426[/C][/ROW]
[ROW][C]98[/C][C] 16[/C][C] 15.68[/C][C] 0.3222[/C][/ROW]
[ROW][C]99[/C][C] 16[/C][C] 13.95[/C][C] 2.049[/C][/ROW]
[/TABLE]
Source: https://freestatistics.org/blog/index.php?pk=306488&T=4

Globally Unique Identifier (entire table): ba.freestatistics.org/blog/index.php?pk=306488&T=4

As an alternative you can also use a QR Code:  

The GUIDs for individual cells are displayed in the table below:

Multiple Linear Regression - Actuals, Interpolation, and Residuals
Time or IndexActualsInterpolationForecastResidualsPrediction Error
1 13 13.1-0.1017
2 16 15.4 0.6003
3 17 15.92 1.081
4 16 15.19 0.811
5 17 16.98 0.01813
6 17 15.89 1.111
7 16 15.19 0.807
8 14 13.9 0.1001
9 16 15.39 0.6051
10 17 15.04 1.964
11 16 14.54 1.455
12 16 15.7 0.3003
13 16 14.68 1.315
14 15 15.76-0.7609
15 16 14.55 1.45
16 16 16.41-0.4085
17 15 16.99-1.995
18 17 16.35 0.6494
19 13 13.48-0.4812
20 17 16.88 0.1179
21 14 14.04-0.04351
22 14 14.6-0.6028
23 18 15.77 2.23
24 17 16.99 0.01173
25 16 17.15-1.148
26 15 15.93-0.9296
27 15 15.15-0.1514
28 15 15.63-0.6276
29 13 15.9-2.904
30 17 16.93 0.07469
31 11 14.69-3.69
32 14 14.04-0.04085
33 13 15.77-2.77
34 17 15.18 1.82
35 16 15.41 0.594
36 17 17.6-0.5954
37 16 14.53 1.468
38 16 15.83 0.173
39 16 14.82 1.179
40 15 15.84-0.8361
41 12 13.46-1.46
42 17 15.48 1.521
43 14 15.41-1.406
44 14 15.68-1.685
45 16 14.68 1.321
46 15 15.09-0.09131
47 16 15.91 0.08676
48 14 14.7-0.6972
49 15 13.89 1.113
50 17 14.63 2.373
51 10 13.95-3.946
52 17 15.81 1.185
53 20 16.4 3.604
54 17 16.82 0.1795
55 18 15.84 2.158
56 14 12.95 1.053
57 17 15.7 1.297
58 17 17.14-0.142
59 16 15.7 0.3035
60 18 16.31 1.69
61 18 16.85 1.152
62 16 16.98-0.976
63 15 15.7-0.6997
64 13 16.34-3.338
65 16 15.78 0.2237
66 12 13.53-1.533
67 16 15.13 0.8713
68 16 15.63 0.3729
69 16 16.5-0.4966
70 14 15.84-1.837
71 15 15.27-0.2659
72 14 14.53-0.5293
73 15 15.92-0.9164
74 15 15.11-0.1132
75 16 15.26 0.7368
76 11 11.82-0.8232
77 18 16.07 1.933
78 11 13.96-2.961
79 18 17.71 0.2933
80 15 16.92-1.916
81 19 18.22 0.7834
82 17 17 0.002124
83 14 15.26-1.262
84 13 15.73-2.73
85 17 15.81 1.185
86 14 15.83-1.83
87 19 16.08 2.921
88 14 14.62-0.6241
89 16 17-0.9987
90 16 15.24 0.756
91 15 15.67-0.6746
92 12 14.7-2.697
93 17 16.56 0.4364
94 18 15.68 2.316
95 15 14.17 0.826
96 18 15.84 2.159
97 15 17.43-2.426
98 16 15.68 0.3222
99 16 13.95 2.049


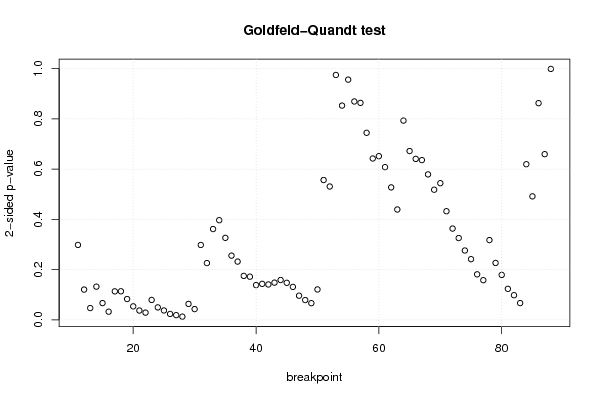
Goldfeld-Quandt test for Heteroskedasticity
p-valuesAlternative Hypothesis
breakpoint indexgreater2-sidedless
11 0.149 0.298 0.851
12 0.06014 0.1203 0.9399
13 0.02332 0.04664 0.9767
14 0.06596 0.1319 0.934
15 0.03324 0.06647 0.9668
16 0.01608 0.03216 0.9839
17 0.05662 0.1132 0.9434
18 0.05675 0.1135 0.9433
19 0.04134 0.08268 0.9587
20 0.02678 0.05355 0.9732
21 0.01846 0.03692 0.9815
22 0.01417 0.02835 0.9858
23 0.03952 0.07904 0.9605
24 0.02467 0.04934 0.9753
25 0.01857 0.03714 0.9814
26 0.01162 0.02323 0.9884
27 0.009174 0.01835 0.9908
28 0.006228 0.01246 0.9938
29 0.03155 0.06309 0.9685
30 0.02128 0.04256 0.9787
31 0.1489 0.2979 0.8511
32 0.1129 0.2258 0.8871
33 0.1806 0.3613 0.8194
34 0.1983 0.3965 0.8017
35 0.1631 0.3263 0.8369
36 0.1277 0.2554 0.8723
37 0.1159 0.2318 0.8841
38 0.08736 0.1747 0.9126
39 0.08577 0.1715 0.9142
40 0.06908 0.1382 0.9309
41 0.07154 0.1431 0.9285
42 0.07032 0.1406 0.9297
43 0.07391 0.1478 0.9261
44 0.07916 0.1583 0.9208
45 0.07362 0.1472 0.9264
46 0.06546 0.1309 0.9345
47 0.04794 0.09589 0.9521
48 0.03931 0.07861 0.9607
49 0.03309 0.06619 0.9669
50 0.06037 0.1207 0.9396
51 0.2782 0.5565 0.7218
52 0.2653 0.5307 0.7347
53 0.4874 0.9748 0.5126
54 0.4264 0.8529 0.5736
55 0.4781 0.9561 0.5219
56 0.4346 0.8692 0.5654
57 0.4318 0.8637 0.5682
58 0.3723 0.7445 0.6277
59 0.3211 0.6422 0.6789
60 0.3257 0.6514 0.6743
61 0.3039 0.6078 0.6961
62 0.2636 0.5272 0.7364
63 0.2195 0.4391 0.7805
64 0.3965 0.793 0.6035
65 0.3359 0.6718 0.6641
66 0.3203 0.6405 0.6797
67 0.3179 0.6358 0.6821
68 0.2895 0.5789 0.7105
69 0.2589 0.5179 0.7411
70 0.2719 0.5438 0.7281
71 0.2161 0.4323 0.7839
72 0.1816 0.3632 0.8184
73 0.1627 0.3255 0.8373
74 0.1379 0.2759 0.8621
75 0.1207 0.2414 0.8793
76 0.09047 0.1809 0.9095
77 0.07884 0.1577 0.9212
78 0.1587 0.3174 0.8413
79 0.1131 0.2263 0.8869
80 0.08934 0.1787 0.9107
81 0.06163 0.1233 0.9384
82 0.04894 0.09788 0.9511
83 0.03326 0.06652 0.9667
84 0.3097 0.6193 0.6903
85 0.2458 0.4915 0.7542
86 0.5688 0.8625 0.4312
87 0.6703 0.6594 0.3297
88 0.4994 0.9987 0.5006

\begin{tabular}{lllllllll}
\hline
Goldfeld-Quandt test for Heteroskedasticity \tabularnewline
p-values & Alternative Hypothesis \tabularnewline
breakpoint index & greater & 2-sided & less \tabularnewline
11 &  0.149 &  0.298 &  0.851 \tabularnewline
12 &  0.06014 &  0.1203 &  0.9399 \tabularnewline
13 &  0.02332 &  0.04664 &  0.9767 \tabularnewline
14 &  0.06596 &  0.1319 &  0.934 \tabularnewline
15 &  0.03324 &  0.06647 &  0.9668 \tabularnewline
16 &  0.01608 &  0.03216 &  0.9839 \tabularnewline
17 &  0.05662 &  0.1132 &  0.9434 \tabularnewline
18 &  0.05675 &  0.1135 &  0.9433 \tabularnewline
19 &  0.04134 &  0.08268 &  0.9587 \tabularnewline
20 &  0.02678 &  0.05355 &  0.9732 \tabularnewline
21 &  0.01846 &  0.03692 &  0.9815 \tabularnewline
22 &  0.01417 &  0.02835 &  0.9858 \tabularnewline
23 &  0.03952 &  0.07904 &  0.9605 \tabularnewline
24 &  0.02467 &  0.04934 &  0.9753 \tabularnewline
25 &  0.01857 &  0.03714 &  0.9814 \tabularnewline
26 &  0.01162 &  0.02323 &  0.9884 \tabularnewline
27 &  0.009174 &  0.01835 &  0.9908 \tabularnewline
28 &  0.006228 &  0.01246 &  0.9938 \tabularnewline
29 &  0.03155 &  0.06309 &  0.9685 \tabularnewline
30 &  0.02128 &  0.04256 &  0.9787 \tabularnewline
31 &  0.1489 &  0.2979 &  0.8511 \tabularnewline
32 &  0.1129 &  0.2258 &  0.8871 \tabularnewline
33 &  0.1806 &  0.3613 &  0.8194 \tabularnewline
34 &  0.1983 &  0.3965 &  0.8017 \tabularnewline
35 &  0.1631 &  0.3263 &  0.8369 \tabularnewline
36 &  0.1277 &  0.2554 &  0.8723 \tabularnewline
37 &  0.1159 &  0.2318 &  0.8841 \tabularnewline
38 &  0.08736 &  0.1747 &  0.9126 \tabularnewline
39 &  0.08577 &  0.1715 &  0.9142 \tabularnewline
40 &  0.06908 &  0.1382 &  0.9309 \tabularnewline
41 &  0.07154 &  0.1431 &  0.9285 \tabularnewline
42 &  0.07032 &  0.1406 &  0.9297 \tabularnewline
43 &  0.07391 &  0.1478 &  0.9261 \tabularnewline
44 &  0.07916 &  0.1583 &  0.9208 \tabularnewline
45 &  0.07362 &  0.1472 &  0.9264 \tabularnewline
46 &  0.06546 &  0.1309 &  0.9345 \tabularnewline
47 &  0.04794 &  0.09589 &  0.9521 \tabularnewline
48 &  0.03931 &  0.07861 &  0.9607 \tabularnewline
49 &  0.03309 &  0.06619 &  0.9669 \tabularnewline
50 &  0.06037 &  0.1207 &  0.9396 \tabularnewline
51 &  0.2782 &  0.5565 &  0.7218 \tabularnewline
52 &  0.2653 &  0.5307 &  0.7347 \tabularnewline
53 &  0.4874 &  0.9748 &  0.5126 \tabularnewline
54 &  0.4264 &  0.8529 &  0.5736 \tabularnewline
55 &  0.4781 &  0.9561 &  0.5219 \tabularnewline
56 &  0.4346 &  0.8692 &  0.5654 \tabularnewline
57 &  0.4318 &  0.8637 &  0.5682 \tabularnewline
58 &  0.3723 &  0.7445 &  0.6277 \tabularnewline
59 &  0.3211 &  0.6422 &  0.6789 \tabularnewline
60 &  0.3257 &  0.6514 &  0.6743 \tabularnewline
61 &  0.3039 &  0.6078 &  0.6961 \tabularnewline
62 &  0.2636 &  0.5272 &  0.7364 \tabularnewline
63 &  0.2195 &  0.4391 &  0.7805 \tabularnewline
64 &  0.3965 &  0.793 &  0.6035 \tabularnewline
65 &  0.3359 &  0.6718 &  0.6641 \tabularnewline
66 &  0.3203 &  0.6405 &  0.6797 \tabularnewline
67 &  0.3179 &  0.6358 &  0.6821 \tabularnewline
68 &  0.2895 &  0.5789 &  0.7105 \tabularnewline
69 &  0.2589 &  0.5179 &  0.7411 \tabularnewline
70 &  0.2719 &  0.5438 &  0.7281 \tabularnewline
71 &  0.2161 &  0.4323 &  0.7839 \tabularnewline
72 &  0.1816 &  0.3632 &  0.8184 \tabularnewline
73 &  0.1627 &  0.3255 &  0.8373 \tabularnewline
74 &  0.1379 &  0.2759 &  0.8621 \tabularnewline
75 &  0.1207 &  0.2414 &  0.8793 \tabularnewline
76 &  0.09047 &  0.1809 &  0.9095 \tabularnewline
77 &  0.07884 &  0.1577 &  0.9212 \tabularnewline
78 &  0.1587 &  0.3174 &  0.8413 \tabularnewline
79 &  0.1131 &  0.2263 &  0.8869 \tabularnewline
80 &  0.08934 &  0.1787 &  0.9107 \tabularnewline
81 &  0.06163 &  0.1233 &  0.9384 \tabularnewline
82 &  0.04894 &  0.09788 &  0.9511 \tabularnewline
83 &  0.03326 &  0.06652 &  0.9667 \tabularnewline
84 &  0.3097 &  0.6193 &  0.6903 \tabularnewline
85 &  0.2458 &  0.4915 &  0.7542 \tabularnewline
86 &  0.5688 &  0.8625 &  0.4312 \tabularnewline
87 &  0.6703 &  0.6594 &  0.3297 \tabularnewline
88 &  0.4994 &  0.9987 &  0.5006 \tabularnewline
\hline
\end{tabular}
%Source: https://freestatistics.org/blog/index.php?pk=306488&T=5

[TABLE]
[ROW][C]Goldfeld-Quandt test for Heteroskedasticity[/C][/ROW]
[ROW][C]p-values[/C][C]Alternative Hypothesis[/C][/ROW]
[ROW][C]breakpoint index[/C][C]greater[/C][C]2-sided[/C][C]less[/C][/ROW]
[ROW][C]11[/C][C] 0.149[/C][C] 0.298[/C][C] 0.851[/C][/ROW]
[ROW][C]12[/C][C] 0.06014[/C][C] 0.1203[/C][C] 0.9399[/C][/ROW]
[ROW][C]13[/C][C] 0.02332[/C][C] 0.04664[/C][C] 0.9767[/C][/ROW]
[ROW][C]14[/C][C] 0.06596[/C][C] 0.1319[/C][C] 0.934[/C][/ROW]
[ROW][C]15[/C][C] 0.03324[/C][C] 0.06647[/C][C] 0.9668[/C][/ROW]
[ROW][C]16[/C][C] 0.01608[/C][C] 0.03216[/C][C] 0.9839[/C][/ROW]
[ROW][C]17[/C][C] 0.05662[/C][C] 0.1132[/C][C] 0.9434[/C][/ROW]
[ROW][C]18[/C][C] 0.05675[/C][C] 0.1135[/C][C] 0.9433[/C][/ROW]
[ROW][C]19[/C][C] 0.04134[/C][C] 0.08268[/C][C] 0.9587[/C][/ROW]
[ROW][C]20[/C][C] 0.02678[/C][C] 0.05355[/C][C] 0.9732[/C][/ROW]
[ROW][C]21[/C][C] 0.01846[/C][C] 0.03692[/C][C] 0.9815[/C][/ROW]
[ROW][C]22[/C][C] 0.01417[/C][C] 0.02835[/C][C] 0.9858[/C][/ROW]
[ROW][C]23[/C][C] 0.03952[/C][C] 0.07904[/C][C] 0.9605[/C][/ROW]
[ROW][C]24[/C][C] 0.02467[/C][C] 0.04934[/C][C] 0.9753[/C][/ROW]
[ROW][C]25[/C][C] 0.01857[/C][C] 0.03714[/C][C] 0.9814[/C][/ROW]
[ROW][C]26[/C][C] 0.01162[/C][C] 0.02323[/C][C] 0.9884[/C][/ROW]
[ROW][C]27[/C][C] 0.009174[/C][C] 0.01835[/C][C] 0.9908[/C][/ROW]
[ROW][C]28[/C][C] 0.006228[/C][C] 0.01246[/C][C] 0.9938[/C][/ROW]
[ROW][C]29[/C][C] 0.03155[/C][C] 0.06309[/C][C] 0.9685[/C][/ROW]
[ROW][C]30[/C][C] 0.02128[/C][C] 0.04256[/C][C] 0.9787[/C][/ROW]
[ROW][C]31[/C][C] 0.1489[/C][C] 0.2979[/C][C] 0.8511[/C][/ROW]
[ROW][C]32[/C][C] 0.1129[/C][C] 0.2258[/C][C] 0.8871[/C][/ROW]
[ROW][C]33[/C][C] 0.1806[/C][C] 0.3613[/C][C] 0.8194[/C][/ROW]
[ROW][C]34[/C][C] 0.1983[/C][C] 0.3965[/C][C] 0.8017[/C][/ROW]
[ROW][C]35[/C][C] 0.1631[/C][C] 0.3263[/C][C] 0.8369[/C][/ROW]
[ROW][C]36[/C][C] 0.1277[/C][C] 0.2554[/C][C] 0.8723[/C][/ROW]
[ROW][C]37[/C][C] 0.1159[/C][C] 0.2318[/C][C] 0.8841[/C][/ROW]
[ROW][C]38[/C][C] 0.08736[/C][C] 0.1747[/C][C] 0.9126[/C][/ROW]
[ROW][C]39[/C][C] 0.08577[/C][C] 0.1715[/C][C] 0.9142[/C][/ROW]
[ROW][C]40[/C][C] 0.06908[/C][C] 0.1382[/C][C] 0.9309[/C][/ROW]
[ROW][C]41[/C][C] 0.07154[/C][C] 0.1431[/C][C] 0.9285[/C][/ROW]
[ROW][C]42[/C][C] 0.07032[/C][C] 0.1406[/C][C] 0.9297[/C][/ROW]
[ROW][C]43[/C][C] 0.07391[/C][C] 0.1478[/C][C] 0.9261[/C][/ROW]
[ROW][C]44[/C][C] 0.07916[/C][C] 0.1583[/C][C] 0.9208[/C][/ROW]
[ROW][C]45[/C][C] 0.07362[/C][C] 0.1472[/C][C] 0.9264[/C][/ROW]
[ROW][C]46[/C][C] 0.06546[/C][C] 0.1309[/C][C] 0.9345[/C][/ROW]
[ROW][C]47[/C][C] 0.04794[/C][C] 0.09589[/C][C] 0.9521[/C][/ROW]
[ROW][C]48[/C][C] 0.03931[/C][C] 0.07861[/C][C] 0.9607[/C][/ROW]
[ROW][C]49[/C][C] 0.03309[/C][C] 0.06619[/C][C] 0.9669[/C][/ROW]
[ROW][C]50[/C][C] 0.06037[/C][C] 0.1207[/C][C] 0.9396[/C][/ROW]
[ROW][C]51[/C][C] 0.2782[/C][C] 0.5565[/C][C] 0.7218[/C][/ROW]
[ROW][C]52[/C][C] 0.2653[/C][C] 0.5307[/C][C] 0.7347[/C][/ROW]
[ROW][C]53[/C][C] 0.4874[/C][C] 0.9748[/C][C] 0.5126[/C][/ROW]
[ROW][C]54[/C][C] 0.4264[/C][C] 0.8529[/C][C] 0.5736[/C][/ROW]
[ROW][C]55[/C][C] 0.4781[/C][C] 0.9561[/C][C] 0.5219[/C][/ROW]
[ROW][C]56[/C][C] 0.4346[/C][C] 0.8692[/C][C] 0.5654[/C][/ROW]
[ROW][C]57[/C][C] 0.4318[/C][C] 0.8637[/C][C] 0.5682[/C][/ROW]
[ROW][C]58[/C][C] 0.3723[/C][C] 0.7445[/C][C] 0.6277[/C][/ROW]
[ROW][C]59[/C][C] 0.3211[/C][C] 0.6422[/C][C] 0.6789[/C][/ROW]
[ROW][C]60[/C][C] 0.3257[/C][C] 0.6514[/C][C] 0.6743[/C][/ROW]
[ROW][C]61[/C][C] 0.3039[/C][C] 0.6078[/C][C] 0.6961[/C][/ROW]
[ROW][C]62[/C][C] 0.2636[/C][C] 0.5272[/C][C] 0.7364[/C][/ROW]
[ROW][C]63[/C][C] 0.2195[/C][C] 0.4391[/C][C] 0.7805[/C][/ROW]
[ROW][C]64[/C][C] 0.3965[/C][C] 0.793[/C][C] 0.6035[/C][/ROW]
[ROW][C]65[/C][C] 0.3359[/C][C] 0.6718[/C][C] 0.6641[/C][/ROW]
[ROW][C]66[/C][C] 0.3203[/C][C] 0.6405[/C][C] 0.6797[/C][/ROW]
[ROW][C]67[/C][C] 0.3179[/C][C] 0.6358[/C][C] 0.6821[/C][/ROW]
[ROW][C]68[/C][C] 0.2895[/C][C] 0.5789[/C][C] 0.7105[/C][/ROW]
[ROW][C]69[/C][C] 0.2589[/C][C] 0.5179[/C][C] 0.7411[/C][/ROW]
[ROW][C]70[/C][C] 0.2719[/C][C] 0.5438[/C][C] 0.7281[/C][/ROW]
[ROW][C]71[/C][C] 0.2161[/C][C] 0.4323[/C][C] 0.7839[/C][/ROW]
[ROW][C]72[/C][C] 0.1816[/C][C] 0.3632[/C][C] 0.8184[/C][/ROW]
[ROW][C]73[/C][C] 0.1627[/C][C] 0.3255[/C][C] 0.8373[/C][/ROW]
[ROW][C]74[/C][C] 0.1379[/C][C] 0.2759[/C][C] 0.8621[/C][/ROW]
[ROW][C]75[/C][C] 0.1207[/C][C] 0.2414[/C][C] 0.8793[/C][/ROW]
[ROW][C]76[/C][C] 0.09047[/C][C] 0.1809[/C][C] 0.9095[/C][/ROW]
[ROW][C]77[/C][C] 0.07884[/C][C] 0.1577[/C][C] 0.9212[/C][/ROW]
[ROW][C]78[/C][C] 0.1587[/C][C] 0.3174[/C][C] 0.8413[/C][/ROW]
[ROW][C]79[/C][C] 0.1131[/C][C] 0.2263[/C][C] 0.8869[/C][/ROW]
[ROW][C]80[/C][C] 0.08934[/C][C] 0.1787[/C][C] 0.9107[/C][/ROW]
[ROW][C]81[/C][C] 0.06163[/C][C] 0.1233[/C][C] 0.9384[/C][/ROW]
[ROW][C]82[/C][C] 0.04894[/C][C] 0.09788[/C][C] 0.9511[/C][/ROW]
[ROW][C]83[/C][C] 0.03326[/C][C] 0.06652[/C][C] 0.9667[/C][/ROW]
[ROW][C]84[/C][C] 0.3097[/C][C] 0.6193[/C][C] 0.6903[/C][/ROW]
[ROW][C]85[/C][C] 0.2458[/C][C] 0.4915[/C][C] 0.7542[/C][/ROW]
[ROW][C]86[/C][C] 0.5688[/C][C] 0.8625[/C][C] 0.4312[/C][/ROW]
[ROW][C]87[/C][C] 0.6703[/C][C] 0.6594[/C][C] 0.3297[/C][/ROW]
[ROW][C]88[/C][C] 0.4994[/C][C] 0.9987[/C][C] 0.5006[/C][/ROW]
[/TABLE]
Source: https://freestatistics.org/blog/index.php?pk=306488&T=5

Globally Unique Identifier (entire table): ba.freestatistics.org/blog/index.php?pk=306488&T=5

As an alternative you can also use a QR Code:  

The GUIDs for individual cells are displayed in the table below:

Goldfeld-Quandt test for Heteroskedasticity
p-valuesAlternative Hypothesis
breakpoint indexgreater2-sidedless
11 0.149 0.298 0.851
12 0.06014 0.1203 0.9399
13 0.02332 0.04664 0.9767
14 0.06596 0.1319 0.934
15 0.03324 0.06647 0.9668
16 0.01608 0.03216 0.9839
17 0.05662 0.1132 0.9434
18 0.05675 0.1135 0.9433
19 0.04134 0.08268 0.9587
20 0.02678 0.05355 0.9732
21 0.01846 0.03692 0.9815
22 0.01417 0.02835 0.9858
23 0.03952 0.07904 0.9605
24 0.02467 0.04934 0.9753
25 0.01857 0.03714 0.9814
26 0.01162 0.02323 0.9884
27 0.009174 0.01835 0.9908
28 0.006228 0.01246 0.9938
29 0.03155 0.06309 0.9685
30 0.02128 0.04256 0.9787
31 0.1489 0.2979 0.8511
32 0.1129 0.2258 0.8871
33 0.1806 0.3613 0.8194
34 0.1983 0.3965 0.8017
35 0.1631 0.3263 0.8369
36 0.1277 0.2554 0.8723
37 0.1159 0.2318 0.8841
38 0.08736 0.1747 0.9126
39 0.08577 0.1715 0.9142
40 0.06908 0.1382 0.9309
41 0.07154 0.1431 0.9285
42 0.07032 0.1406 0.9297
43 0.07391 0.1478 0.9261
44 0.07916 0.1583 0.9208
45 0.07362 0.1472 0.9264
46 0.06546 0.1309 0.9345
47 0.04794 0.09589 0.9521
48 0.03931 0.07861 0.9607
49 0.03309 0.06619 0.9669
50 0.06037 0.1207 0.9396
51 0.2782 0.5565 0.7218
52 0.2653 0.5307 0.7347
53 0.4874 0.9748 0.5126
54 0.4264 0.8529 0.5736
55 0.4781 0.9561 0.5219
56 0.4346 0.8692 0.5654
57 0.4318 0.8637 0.5682
58 0.3723 0.7445 0.6277
59 0.3211 0.6422 0.6789
60 0.3257 0.6514 0.6743
61 0.3039 0.6078 0.6961
62 0.2636 0.5272 0.7364
63 0.2195 0.4391 0.7805
64 0.3965 0.793 0.6035
65 0.3359 0.6718 0.6641
66 0.3203 0.6405 0.6797
67 0.3179 0.6358 0.6821
68 0.2895 0.5789 0.7105
69 0.2589 0.5179 0.7411
70 0.2719 0.5438 0.7281
71 0.2161 0.4323 0.7839
72 0.1816 0.3632 0.8184
73 0.1627 0.3255 0.8373
74 0.1379 0.2759 0.8621
75 0.1207 0.2414 0.8793
76 0.09047 0.1809 0.9095
77 0.07884 0.1577 0.9212
78 0.1587 0.3174 0.8413
79 0.1131 0.2263 0.8869
80 0.08934 0.1787 0.9107
81 0.06163 0.1233 0.9384
82 0.04894 0.09788 0.9511
83 0.03326 0.06652 0.9667
84 0.3097 0.6193 0.6903
85 0.2458 0.4915 0.7542
86 0.5688 0.8625 0.4312
87 0.6703 0.6594 0.3297
88 0.4994 0.9987 0.5006


Meta Analysis of Goldfeld-Quandt test for Heteroskedasticity
Description# significant tests% significant testsOK/NOK
1% type I error level0 0OK
5% type I error level100.128205NOK
10% type I error level200.25641NOK

\begin{tabular}{lllllllll}
\hline
Meta Analysis of Goldfeld-Quandt test for Heteroskedasticity \tabularnewline
Description & # significant tests & % significant tests & OK/NOK \tabularnewline
1% type I error level & 0 &  0 & OK \tabularnewline
5% type I error level & 10 & 0.128205 & NOK \tabularnewline
10% type I error level & 20 & 0.25641 & NOK \tabularnewline
\hline
\end{tabular}
%Source: https://freestatistics.org/blog/index.php?pk=306488&T=6

[TABLE]
[ROW][C]Meta Analysis of Goldfeld-Quandt test for Heteroskedasticity[/C][/ROW]
[ROW][C]Description[/C][C]# significant tests[/C][C]% significant tests[/C][C]OK/NOK[/C][/ROW]
[ROW][C]1% type I error level[/C][C]0[/C][C] 0[/C][C]OK[/C][/ROW]
[ROW][C]5% type I error level[/C][C]10[/C][C]0.128205[/C][C]NOK[/C][/ROW]
[ROW][C]10% type I error level[/C][C]20[/C][C]0.25641[/C][C]NOK[/C][/ROW]
[/TABLE]
Source: https://freestatistics.org/blog/index.php?pk=306488&T=6

Globally Unique Identifier (entire table): ba.freestatistics.org/blog/index.php?pk=306488&T=6

As an alternative you can also use a QR Code:  

The GUIDs for individual cells are displayed in the table below:

Meta Analysis of Goldfeld-Quandt test for Heteroskedasticity
Description# significant tests% significant testsOK/NOK
1% type I error level0 0OK
5% type I error level100.128205NOK
10% type I error level200.25641NOK


Ramsey RESET F-Test for powers (2 and 3) of fitted values
> reset_test_fitted
	RESET test
data:  mylm
RESET = 0.87317, df1 = 2, df2 = 89, p-value = 0.4212
Ramsey RESET F-Test for powers (2 and 3) of regressors
> reset_test_regressors
	RESET test
data:  mylm
RESET = 0.90208, df1 = 14, df2 = 77, p-value = 0.5599
Ramsey RESET F-Test for powers (2 and 3) of principal components
> reset_test_principal_components
	RESET test
data:  mylm
RESET = 0.73694, df1 = 2, df2 = 89, p-value = 0.4815

\begin{tabular}{lllllllll}
\hline
Ramsey RESET F-Test for powers (2 and 3) of fitted values \tabularnewline
> reset_test_fitted
	RESET test
data:  mylm
RESET = 0.87317, df1 = 2, df2 = 89, p-value = 0.4212
\tabularnewline Ramsey RESET F-Test for powers (2 and 3) of regressors \tabularnewline
> reset_test_regressors
	RESET test
data:  mylm
RESET = 0.90208, df1 = 14, df2 = 77, p-value = 0.5599
\tabularnewline Ramsey RESET F-Test for powers (2 and 3) of principal components \tabularnewline
> reset_test_principal_components
	RESET test
data:  mylm
RESET = 0.73694, df1 = 2, df2 = 89, p-value = 0.4815
\tabularnewline \hline \end{tabular} %Source: https://freestatistics.org/blog/index.php?pk=306488&T=7

[TABLE]
[ROW][C]Ramsey RESET F-Test for powers (2 and 3) of fitted values[/C][/ROW]
[ROW][C]
> reset_test_fitted
	RESET test
data:  mylm
RESET = 0.87317, df1 = 2, df2 = 89, p-value = 0.4212
[/C][/ROW] [ROW][C]Ramsey RESET F-Test for powers (2 and 3) of regressors[/C][/ROW] [ROW][C]
> reset_test_regressors
	RESET test
data:  mylm
RESET = 0.90208, df1 = 14, df2 = 77, p-value = 0.5599
[/C][/ROW] [ROW][C]Ramsey RESET F-Test for powers (2 and 3) of principal components[/C][/ROW] [ROW][C]
> reset_test_principal_components
	RESET test
data:  mylm
RESET = 0.73694, df1 = 2, df2 = 89, p-value = 0.4815
[/C][/ROW] [/TABLE] Source: https://freestatistics.org/blog/index.php?pk=306488&T=7

Globally Unique Identifier (entire table): ba.freestatistics.org/blog/index.php?pk=306488&T=7

As an alternative you can also use a QR Code:  

The GUIDs for individual cells are displayed in the table below:

Ramsey RESET F-Test for powers (2 and 3) of fitted values
> reset_test_fitted
	RESET test
data:  mylm
RESET = 0.87317, df1 = 2, df2 = 89, p-value = 0.4212
Ramsey RESET F-Test for powers (2 and 3) of regressors
> reset_test_regressors
	RESET test
data:  mylm
RESET = 0.90208, df1 = 14, df2 = 77, p-value = 0.5599
Ramsey RESET F-Test for powers (2 and 3) of principal components
> reset_test_principal_components
	RESET test
data:  mylm
RESET = 0.73694, df1 = 2, df2 = 89, p-value = 0.4815


Variance Inflation Factors (Multicollinearity)
> vif
  ITHSUM   SKEOU1   SKEOU2   SKEOU3   SKEOU4   SKEOU5   SKEOU6 
1.164189 1.099822 1.179477 1.113710 1.111735 1.085730 1.050983 

\begin{tabular}{lllllllll}
\hline
Variance Inflation Factors (Multicollinearity) \tabularnewline
> vif
  ITHSUM   SKEOU1   SKEOU2   SKEOU3   SKEOU4   SKEOU5   SKEOU6 
1.164189 1.099822 1.179477 1.113710 1.111735 1.085730 1.050983 
\tabularnewline \hline \end{tabular} %Source: https://freestatistics.org/blog/index.php?pk=306488&T=8

[TABLE]
[ROW][C]Variance Inflation Factors (Multicollinearity)[/C][/ROW]
[ROW][C]
> vif
  ITHSUM   SKEOU1   SKEOU2   SKEOU3   SKEOU4   SKEOU5   SKEOU6 
1.164189 1.099822 1.179477 1.113710 1.111735 1.085730 1.050983 
[/C][/ROW] [/TABLE] Source: https://freestatistics.org/blog/index.php?pk=306488&T=8

Globally Unique Identifier (entire table): ba.freestatistics.org/blog/index.php?pk=306488&T=8

As an alternative you can also use a QR Code:  

The GUIDs for individual cells are displayed in the table below:

Variance Inflation Factors (Multicollinearity)
> vif
  ITHSUM   SKEOU1   SKEOU2   SKEOU3   SKEOU4   SKEOU5   SKEOU6 
1.164189 1.099822 1.179477 1.113710 1.111735 1.085730 1.050983 


Parameters (Session):
Parameters (R input):
par1 = ; par2 = Do not include Seasonal Dummies ; par3 = No Linear Trend ; par4 = ; par5 = ;
R code (references can be found in the software module):
library(lattice)
library(lmtest)
library(car)
library(MASS)
n25 <- 25 #minimum number of obs. for Goldfeld-Quandt test
mywarning <- ''
par1 <- as.numeric(par1)
if(is.na(par1)) {
par1 <- 1
mywarning = 'Warning: you did not specify the column number of the endogenous series! The first column was selected by default.'
}
if (par4=='') par4 <- 0
par4 <- as.numeric(par4)
if (par5=='') par5 <- 0
par5 <- as.numeric(par5)
x <- na.omit(t(y))
k <- length(x[1,])
n <- length(x[,1])
x1 <- cbind(x[,par1], x[,1:k!=par1])
mycolnames <- c(colnames(x)[par1], colnames(x)[1:k!=par1])
colnames(x1) <- mycolnames #colnames(x)[par1]
x <- x1
if (par3 == 'First Differences'){
(n <- n -1)
x2 <- array(0, dim=c(n,k), dimnames=list(1:n, paste('(1-B)',colnames(x),sep='')))
for (i in 1:n) {
for (j in 1:k) {
x2[i,j] <- x[i+1,j] - x[i,j]
}
}
x <- x2
}
if (par3 == 'Seasonal Differences (s=12)'){
(n <- n - 12)
x2 <- array(0, dim=c(n,k), dimnames=list(1:n, paste('(1-B12)',colnames(x),sep='')))
for (i in 1:n) {
for (j in 1:k) {
x2[i,j] <- x[i+12,j] - x[i,j]
}
}
x <- x2
}
if (par3 == 'First and Seasonal Differences (s=12)'){
(n <- n -1)
x2 <- array(0, dim=c(n,k), dimnames=list(1:n, paste('(1-B)',colnames(x),sep='')))
for (i in 1:n) {
for (j in 1:k) {
x2[i,j] <- x[i+1,j] - x[i,j]
}
}
x <- x2
(n <- n - 12)
x2 <- array(0, dim=c(n,k), dimnames=list(1:n, paste('(1-B12)',colnames(x),sep='')))
for (i in 1:n) {
for (j in 1:k) {
x2[i,j] <- x[i+12,j] - x[i,j]
}
}
x <- x2
}
if(par4 > 0) {
x2 <- array(0, dim=c(n-par4,par4), dimnames=list(1:(n-par4), paste(colnames(x)[par1],'(t-',1:par4,')',sep='')))
for (i in 1:(n-par4)) {
for (j in 1:par4) {
x2[i,j] <- x[i+par4-j,par1]
}
}
x <- cbind(x[(par4+1):n,], x2)
n <- n - par4
}
if(par5 > 0) {
x2 <- array(0, dim=c(n-par5*12,par5), dimnames=list(1:(n-par5*12), paste(colnames(x)[par1],'(t-',1:par5,'s)',sep='')))
for (i in 1:(n-par5*12)) {
for (j in 1:par5) {
x2[i,j] <- x[i+par5*12-j*12,par1]
}
}
x <- cbind(x[(par5*12+1):n,], x2)
n <- n - par5*12
}
if (par2 == 'Include Monthly Dummies'){
x2 <- array(0, dim=c(n,11), dimnames=list(1:n, paste('M', seq(1:11), sep ='')))
for (i in 1:11){
x2[seq(i,n,12),i] <- 1
}
x <- cbind(x, x2)
}
if (par2 == 'Include Quarterly Dummies'){
x2 <- array(0, dim=c(n,3), dimnames=list(1:n, paste('Q', seq(1:3), sep ='')))
for (i in 1:3){
x2[seq(i,n,4),i] <- 1
}
x <- cbind(x, x2)
}
(k <- length(x[n,]))
if (par3 == 'Linear Trend'){
x <- cbind(x, c(1:n))
colnames(x)[k+1] <- 't'
}
print(x)
(k <- length(x[n,]))
head(x)
df <- as.data.frame(x)
(mylm <- lm(df))
(mysum <- summary(mylm))
if (n > n25) {
kp3 <- k + 3
nmkm3 <- n - k - 3
gqarr <- array(NA, dim=c(nmkm3-kp3+1,3))
numgqtests <- 0
numsignificant1 <- 0
numsignificant5 <- 0
numsignificant10 <- 0
for (mypoint in kp3:nmkm3) {
j <- 0
numgqtests <- numgqtests + 1
for (myalt in c('greater', 'two.sided', 'less')) {
j <- j + 1
gqarr[mypoint-kp3+1,j] <- gqtest(mylm, point=mypoint, alternative=myalt)$p.value
}
if (gqarr[mypoint-kp3+1,2] < 0.01) numsignificant1 <- numsignificant1 + 1
if (gqarr[mypoint-kp3+1,2] < 0.05) numsignificant5 <- numsignificant5 + 1
if (gqarr[mypoint-kp3+1,2] < 0.10) numsignificant10 <- numsignificant10 + 1
}
gqarr
}
bitmap(file='test0.png')
plot(x[,1], type='l', main='Actuals and Interpolation', ylab='value of Actuals and Interpolation (dots)', xlab='time or index')
points(x[,1]-mysum$resid)
grid()
dev.off()
bitmap(file='test1.png')
plot(mysum$resid, type='b', pch=19, main='Residuals', ylab='value of Residuals', xlab='time or index')
grid()
dev.off()
bitmap(file='test2.png')
sresid <- studres(mylm)
hist(sresid, freq=FALSE, main='Distribution of Studentized Residuals')
xfit<-seq(min(sresid),max(sresid),length=40)
yfit<-dnorm(xfit)
lines(xfit, yfit)
grid()
dev.off()
bitmap(file='test3.png')
densityplot(~mysum$resid,col='black',main='Residual Density Plot', xlab='values of Residuals')
dev.off()
bitmap(file='test4.png')
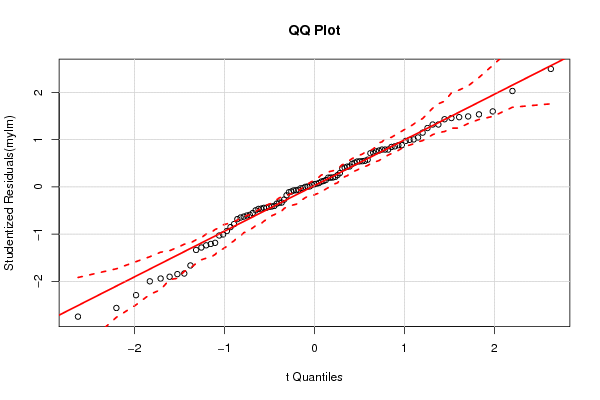
qqPlot(mylm, main='QQ Plot')
grid()
dev.off()
(myerror <- as.ts(mysum$resid))
bitmap(file='test5.png')
dum <- cbind(lag(myerror,k=1),myerror)
dum
dum1 <- dum[2:length(myerror),]
dum1
z <- as.data.frame(dum1)
print(z)
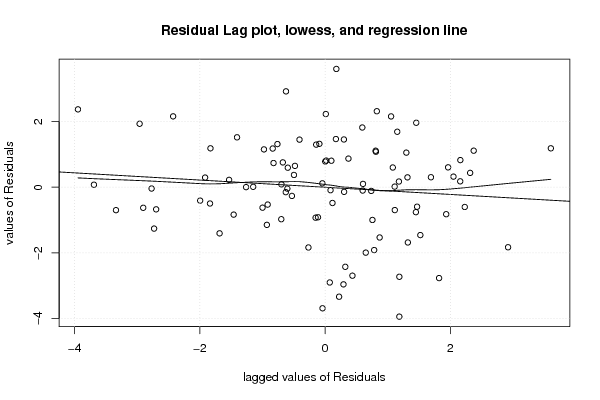
plot(z,main=paste('Residual Lag plot, lowess, and regression line'), ylab='values of Residuals', xlab='lagged values of Residuals')
lines(lowess(z))
abline(lm(z))
grid()
dev.off()
bitmap(file='test6.png')
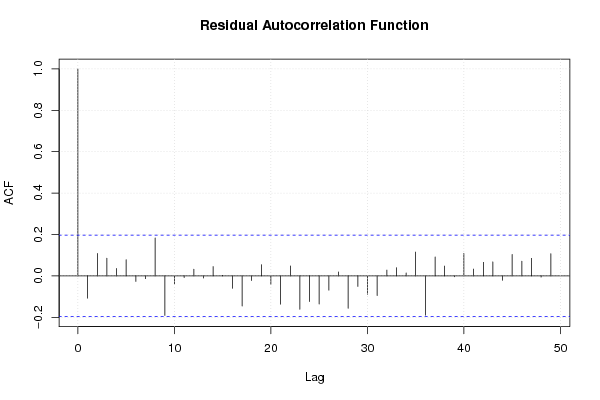
acf(mysum$resid, lag.max=length(mysum$resid)/2, main='Residual Autocorrelation Function')
grid()
dev.off()
bitmap(file='test7.png')
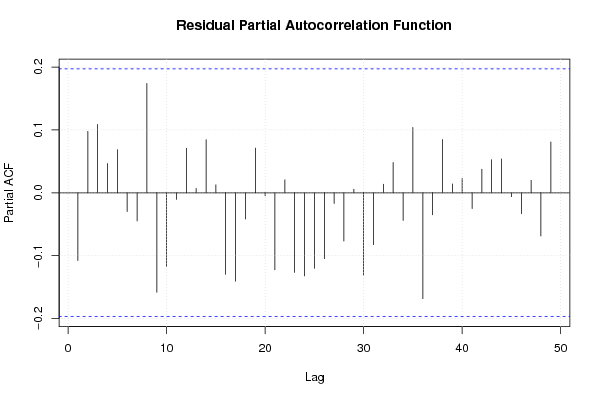
pacf(mysum$resid, lag.max=length(mysum$resid)/2, main='Residual Partial Autocorrelation Function')
grid()
dev.off()
bitmap(file='test8.png')
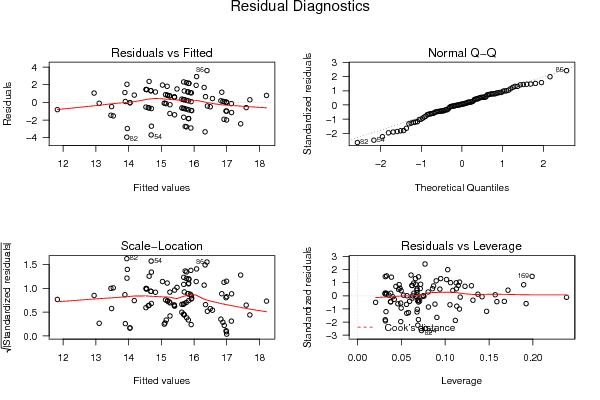
opar <- par(mfrow = c(2,2), oma = c(0, 0, 1.1, 0))
plot(mylm, las = 1, sub='Residual Diagnostics')
par(opar)
dev.off()
if (n > n25) {
bitmap(file='test9.png')
plot(kp3:nmkm3,gqarr[,2], main='Goldfeld-Quandt test',ylab='2-sided p-value',xlab='breakpoint')
grid()
dev.off()
}
load(file='createtable')
a<-table.start()
a<-table.row.start(a)
a<-table.element(a, 'Multiple Linear Regression - Estimated Regression Equation', 1, TRUE)
a<-table.row.end(a)
myeq <- colnames(x)[1]
myeq <- paste(myeq, '[t] = ', sep='')
for (i in 1:k){
if (mysum$coefficients[i,1] > 0) myeq <- paste(myeq, '+', '')
myeq <- paste(myeq, signif(mysum$coefficients[i,1],6), sep=' ')
if (rownames(mysum$coefficients)[i] != '(Intercept)') {
myeq <- paste(myeq, rownames(mysum$coefficients)[i], sep='')
if (rownames(mysum$coefficients)[i] != 't') myeq <- paste(myeq, '[t]', sep='')
}
}
myeq <- paste(myeq, ' + e[t]')
a<-table.row.start(a)
a<-table.element(a, myeq)
a<-table.row.end(a)
a<-table.row.start(a)
a<-table.element(a, mywarning)
a<-table.row.end(a)
a<-table.end(a)
table.save(a,file='mytable1.tab')
a<-table.start()
a<-table.row.start(a)
a<-table.element(a,'Multiple Linear Regression - Ordinary Least Squares', 6, TRUE)
a<-table.row.end(a)
a<-table.row.start(a)
a<-table.element(a,'Variable',header=TRUE)
a<-table.element(a,'Parameter',header=TRUE)
a<-table.element(a,'S.D.',header=TRUE)
a<-table.element(a,'T-STAT
H0: parameter = 0',header=TRUE)
a<-table.element(a,'2-tail p-value',header=TRUE)
a<-table.element(a,'1-tail p-value',header=TRUE)
a<-table.row.end(a)
for (i in 1:k){
a<-table.row.start(a)
a<-table.element(a,rownames(mysum$coefficients)[i],header=TRUE)
a<-table.element(a,formatC(signif(mysum$coefficients[i,1],5),format='g',flag='+'))
a<-table.element(a,formatC(signif(mysum$coefficients[i,2],5),format='g',flag=' '))
a<-table.element(a,formatC(signif(mysum$coefficients[i,3],4),format='e',flag='+'))
a<-table.element(a,formatC(signif(mysum$coefficients[i,4],4),format='g',flag=' '))
a<-table.element(a,formatC(signif(mysum$coefficients[i,4]/2,4),format='g',flag=' '))
a<-table.row.end(a)
}
a<-table.end(a)
table.save(a,file='mytable2.tab')
a<-table.start()
a<-table.row.start(a)
a<-table.element(a, 'Multiple Linear Regression - Regression Statistics', 2, TRUE)
a<-table.row.end(a)
a<-table.row.start(a)
a<-table.element(a, 'Multiple R',1,TRUE)
a<-table.element(a,formatC(signif(sqrt(mysum$r.squared),6),format='g',flag=' '))
a<-table.row.end(a)
a<-table.row.start(a)
a<-table.element(a, 'R-squared',1,TRUE)
a<-table.element(a,formatC(signif(mysum$r.squared,6),format='g',flag=' '))
a<-table.row.end(a)
a<-table.row.start(a)
a<-table.element(a, 'Adjusted R-squared',1,TRUE)
a<-table.element(a,formatC(signif(mysum$adj.r.squared,6),format='g',flag=' '))
a<-table.row.end(a)
a<-table.row.start(a)
a<-table.element(a, 'F-TEST (value)',1,TRUE)
a<-table.element(a,formatC(signif(mysum$fstatistic[1],6),format='g',flag=' '))
a<-table.row.end(a)
a<-table.row.start(a)
a<-table.element(a, 'F-TEST (DF numerator)',1,TRUE)
a<-table.element(a, signif(mysum$fstatistic[2],6))
a<-table.row.end(a)
a<-table.row.start(a)
a<-table.element(a, 'F-TEST (DF denominator)',1,TRUE)
a<-table.element(a, signif(mysum$fstatistic[3],6))
a<-table.row.end(a)
a<-table.row.start(a)
a<-table.element(a, 'p-value',1,TRUE)
a<-table.element(a,formatC(signif(1-pf(mysum$fstatistic[1],mysum$fstatistic[2],mysum$fstatistic[3]),6),format='g',flag=' '))
a<-table.row.end(a)
a<-table.row.start(a)
a<-table.element(a, 'Multiple Linear Regression - Residual Statistics', 2, TRUE)
a<-table.row.end(a)
a<-table.row.start(a)
a<-table.element(a, 'Residual Standard Deviation',1,TRUE)
a<-table.element(a,formatC(signif(mysum$sigma,6),format='g',flag=' '))
a<-table.row.end(a)
a<-table.row.start(a)
a<-table.element(a, 'Sum Squared Residuals',1,TRUE)
a<-table.element(a,formatC(signif(sum(myerror*myerror),6),format='g',flag=' '))
a<-table.row.end(a)
a<-table.end(a)
table.save(a,file='mytable3.tab')
myr <- as.numeric(mysum$resid)
myr
if(n < 200) {
a<-table.start()
a<-table.row.start(a)
a<-table.element(a, 'Multiple Linear Regression - Actuals, Interpolation, and Residuals', 4, TRUE)
a<-table.row.end(a)
a<-table.row.start(a)
a<-table.element(a, 'Time or Index', 1, TRUE)
a<-table.element(a, 'Actuals', 1, TRUE)
a<-table.element(a, 'Interpolation
Forecast', 1, TRUE)
a<-table.element(a, 'Residuals
Prediction Error', 1, TRUE)
a<-table.row.end(a)
for (i in 1:n) {
a<-table.row.start(a)
a<-table.element(a,i, 1, TRUE)
a<-table.element(a,formatC(signif(x[i],6),format='g',flag=' '))
a<-table.element(a,formatC(signif(x[i]-mysum$resid[i],6),format='g',flag=' '))
a<-table.element(a,formatC(signif(mysum$resid[i],6),format='g',flag=' '))
a<-table.row.end(a)
}
a<-table.end(a)
table.save(a,file='mytable4.tab')
if (n > n25) {
a<-table.start()
a<-table.row.start(a)
a<-table.element(a,'Goldfeld-Quandt test for Heteroskedasticity',4,TRUE)
a<-table.row.end(a)
a<-table.row.start(a)
a<-table.element(a,'p-values',header=TRUE)
a<-table.element(a,'Alternative Hypothesis',3,header=TRUE)
a<-table.row.end(a)
a<-table.row.start(a)
a<-table.element(a,'breakpoint index',header=TRUE)
a<-table.element(a,'greater',header=TRUE)
a<-table.element(a,'2-sided',header=TRUE)
a<-table.element(a,'less',header=TRUE)
a<-table.row.end(a)
for (mypoint in kp3:nmkm3) {
a<-table.row.start(a)
a<-table.element(a,mypoint,header=TRUE)
a<-table.element(a,formatC(signif(gqarr[mypoint-kp3+1,1],6),format='g',flag=' '))
a<-table.element(a,formatC(signif(gqarr[mypoint-kp3+1,2],6),format='g',flag=' '))
a<-table.element(a,formatC(signif(gqarr[mypoint-kp3+1,3],6),format='g',flag=' '))
a<-table.row.end(a)
}
a<-table.end(a)
table.save(a,file='mytable5.tab')
a<-table.start()
a<-table.row.start(a)
a<-table.element(a,'Meta Analysis of Goldfeld-Quandt test for Heteroskedasticity',4,TRUE)
a<-table.row.end(a)
a<-table.row.start(a)
a<-table.element(a,'Description',header=TRUE)
a<-table.element(a,'# significant tests',header=TRUE)
a<-table.element(a,'% significant tests',header=TRUE)
a<-table.element(a,'OK/NOK',header=TRUE)
a<-table.row.end(a)
a<-table.row.start(a)
a<-table.element(a,'1% type I error level',header=TRUE)
a<-table.element(a,signif(numsignificant1,6))
a<-table.element(a,formatC(signif(numsignificant1/numgqtests,6),format='g',flag=' '))
if (numsignificant1/numgqtests < 0.01) dum <- 'OK' else dum <- 'NOK'
a<-table.element(a,dum)
a<-table.row.end(a)
a<-table.row.start(a)
a<-table.element(a,'5% type I error level',header=TRUE)
a<-table.element(a,signif(numsignificant5,6))
a<-table.element(a,signif(numsignificant5/numgqtests,6))
if (numsignificant5/numgqtests < 0.05) dum <- 'OK' else dum <- 'NOK'
a<-table.element(a,dum)
a<-table.row.end(a)
a<-table.row.start(a)
a<-table.element(a,'10% type I error level',header=TRUE)
a<-table.element(a,signif(numsignificant10,6))
a<-table.element(a,signif(numsignificant10/numgqtests,6))
if (numsignificant10/numgqtests < 0.1) dum <- 'OK' else dum <- 'NOK'
a<-table.element(a,dum)
a<-table.row.end(a)
a<-table.end(a)
table.save(a,file='mytable6.tab')
}
}
a<-table.start()
a<-table.row.start(a)
a<-table.element(a,'Ramsey RESET F-Test for powers (2 and 3) of fitted values',1,TRUE)
a<-table.row.end(a)
a<-table.row.start(a)
reset_test_fitted <- resettest(mylm,power=2:3,type='fitted')
a<-table.element(a,paste('
',RC.texteval('reset_test_fitted'),'
',sep=''))
a<-table.row.end(a)
a<-table.row.start(a)
a<-table.element(a,'Ramsey RESET F-Test for powers (2 and 3) of regressors',1,TRUE)
a<-table.row.end(a)
a<-table.row.start(a)
reset_test_regressors <- resettest(mylm,power=2:3,type='regressor')
a<-table.element(a,paste('
',RC.texteval('reset_test_regressors'),'
',sep=''))
a<-table.row.end(a)
a<-table.row.start(a)
a<-table.element(a,'Ramsey RESET F-Test for powers (2 and 3) of principal components',1,TRUE)
a<-table.row.end(a)
a<-table.row.start(a)
reset_test_principal_components <- resettest(mylm,power=2:3,type='princomp')
a<-table.element(a,paste('
',RC.texteval('reset_test_principal_components'),'
',sep=''))
a<-table.row.end(a)
a<-table.end(a)
table.save(a,file='mytable8.tab')
a<-table.start()
a<-table.row.start(a)
a<-table.element(a,'Variance Inflation Factors (Multicollinearity)',1,TRUE)
a<-table.row.end(a)
a<-table.row.start(a)
vif <- vif(mylm)
a<-table.element(a,paste('
',RC.texteval('vif'),'
',sep=''))
a<-table.row.end(a)
a<-table.end(a)
table.save(a,file='mytable9.tab')