Free Statistics

of Irreproducible Research!

Author's title

Author*The author of this computation has been verified*
R Software Modulerwasp_autocorrelation.wasp
Title produced by software(Partial) Autocorrelation Function
Date of computationTue, 24 Jan 2017 15:56:42 +0100
Cite this page as followsStatistical Computations at FreeStatistics.org, Office for Research Development and Education, URL https://freestatistics.org/blog/index.php?v=date/2017/Jan/24/t14852699241gpzptdw50kxiv3.htm/, Retrieved Tue, 14 May 2024 03:50:56 +0000
Statistical Computations at FreeStatistics.org, Office for Research Development and Education, URL https://freestatistics.org/blog/index.php?pk=305195, Retrieved Tue, 14 May 2024 03:50:56 +0000
QR Codes:

Original text written by user:
IsPrivate?No (this computation is public)
User-defined keywords
Estimated Impact56
Family? (F = Feedback message, R = changed R code, M = changed R Module, P = changed Parameters, D = changed Data)
-       [(Partial) Autocorrelation Function] [] [2017-01-24 14:56:42] [f20c721eaecf28dbff8d9b9768e8b0c7] [Current]
Feedback Forum

Post a new message
Dataseries X:
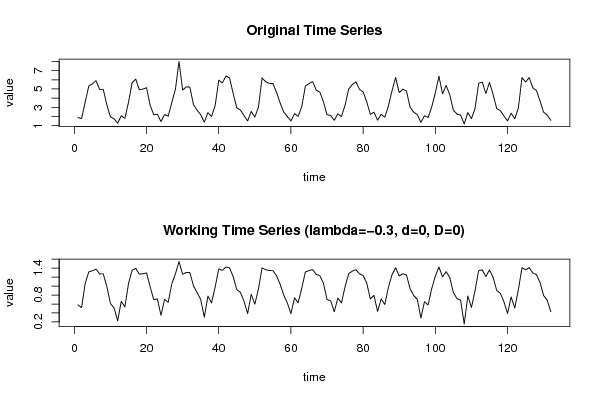
1.894
1.757
3.582
5.321
5.561
5.907
4.944
4.966
3.258
1.964
1.743
1.262
2.086
1.793
3.548
5.672
6.084
4.914
4.990
5.139
3.218
2.179
2.238
1.442
2.205
2.025
3.531
4.977
7.998
4.880
5.231
5.202
3.303
2.683
2.202
1.376
2.422
1.997
3.163
5.964
5.657
6.415
6.208
4.500
2.939
2.702
2.090
1.504
2.549
1.931
3.013
6.204
5.788
5.611
5.594
4.647
3.490
2.487
1.992
1.507
2.306
2.002
3.075
5.331
5.589
5.813
4.876
4.665
3.601
2.192
2.111
1.580
2.288
1.993
3.228
5.000
5.480
5.770
4.962
4.685
3.607
2.222
2.467
1.594
2.228
1.910
3.157
4.809
6.249
4.607
4.975
4.784
3.028
2.461
2.218
1.351
2.070
1.887
3.024
4.596
6.398
4.459
5.382
4.359
2.687
2.249
2.154
1.169
2.429
1.762
2.846
5.627
5.749
4.502
5.720
4.403
2.867
2.635
2.059
1.511
2.359
1.741
2.917
6.249
5.760
6.250
5.134
4.831
3.695
2.462
2.146
1.579


Summary of computational transaction
Raw Input view raw input (R code)
Raw Outputview raw output of R engine
Computing time1 seconds
R ServerBig Analytics Cloud Computing Center

\begin{tabular}{lllllllll}
\hline
Summary of computational transaction \tabularnewline
Raw Input view raw input (R code)  \tabularnewline
Raw Outputview raw output of R engine  \tabularnewline
Computing time1 seconds \tabularnewline
R ServerBig Analytics Cloud Computing Center \tabularnewline
\hline
\end{tabular}
%Source: https://freestatistics.org/blog/index.php?pk=305195&T=0

[TABLE]
[ROW]
Summary of computational transaction[/C][/ROW] [ROW]Raw Input[/C] view raw input (R code) [/C][/ROW] [ROW]Raw Output[/C]view raw output of R engine [/C][/ROW] [ROW]Computing time[/C]1 seconds[/C][/ROW] [ROW]R Server[/C]Big Analytics Cloud Computing Center[/C][/ROW] [/TABLE] Source: https://freestatistics.org/blog/index.php?pk=305195&T=0

Globally Unique Identifier (entire table): ba.freestatistics.org/blog/index.php?pk=305195&T=0

As an alternative you can also use a QR Code:  

The GUIDs for individual cells are displayed in the table below:

Summary of computational transaction
Raw Input view raw input (R code)
Raw Outputview raw output of R engine
Computing time1 seconds
R ServerBig Analytics Cloud Computing Center


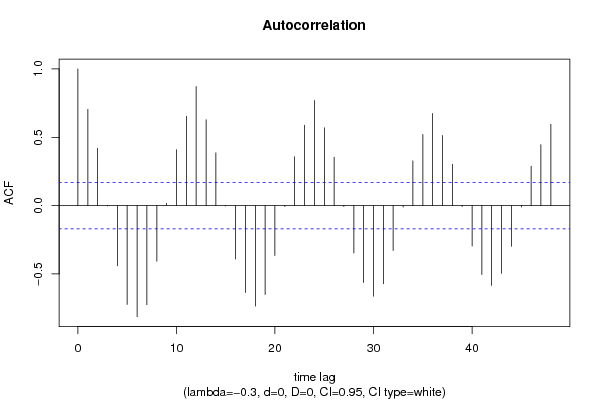
Autocorrelation Function
Time lag kACF(k)T-STATP-value
10.7042918.09170
20.4190974.81512e-06
3-0.002571-0.02950.488239
4-0.440041-5.05571e-06
5-0.723297-8.310
6-0.812788-9.33820
7-0.725101-8.33080
8-0.40743-4.6813e-06
90.0165570.19020.424713
100.4087764.69653e-06
110.6536077.50940
120.87086910.00550
130.628887.22530
140.3860894.43581e-05
15-0.002824-0.03250.487081
16-0.391312-4.49588e-06
17-0.636032-7.30750
18-0.735286-8.44780
19-0.650272-7.47110
20-0.365946-4.20442.4e-05
21-0.006602-0.07580.469828
220.3574664.1073.5e-05
230.5877496.75270
240.7693498.83920
250.5690186.53750
260.3534254.06054.2e-05
27-0.007151-0.08220.467322
28-0.347496-3.99245.4e-05
29-0.562947-6.46780
30-0.662835-7.61540
31-0.572621-6.57890
32-0.328636-3.77570.00012
33-0.010551-0.12120.451852
340.3274353.76190.000126
350.5206665.9820
360.6746047.75060
370.5129465.89330
380.3025683.47620.000344
39-0.00674-0.07740.469196
40-0.296495-3.40650.000436
41-0.504444-5.79560
42-0.584137-6.71120
43-0.495297-5.69050
44-0.297358-3.41640.000422
45-0.010195-0.11710.453467
460.2882163.31130.000599
470.4447315.10961e-06
480.5944276.82940

\begin{tabular}{lllllllll}
\hline
Autocorrelation Function \tabularnewline
Time lag k & ACF(k) & T-STAT & P-value \tabularnewline
1 & 0.704291 & 8.0917 & 0 \tabularnewline
2 & 0.419097 & 4.8151 & 2e-06 \tabularnewline
3 & -0.002571 & -0.0295 & 0.488239 \tabularnewline
4 & -0.440041 & -5.0557 & 1e-06 \tabularnewline
5 & -0.723297 & -8.31 & 0 \tabularnewline
6 & -0.812788 & -9.3382 & 0 \tabularnewline
7 & -0.725101 & -8.3308 & 0 \tabularnewline
8 & -0.40743 & -4.681 & 3e-06 \tabularnewline
9 & 0.016557 & 0.1902 & 0.424713 \tabularnewline
10 & 0.408776 & 4.6965 & 3e-06 \tabularnewline
11 & 0.653607 & 7.5094 & 0 \tabularnewline
12 & 0.870869 & 10.0055 & 0 \tabularnewline
13 & 0.62888 & 7.2253 & 0 \tabularnewline
14 & 0.386089 & 4.4358 & 1e-05 \tabularnewline
15 & -0.002824 & -0.0325 & 0.487081 \tabularnewline
16 & -0.391312 & -4.4958 & 8e-06 \tabularnewline
17 & -0.636032 & -7.3075 & 0 \tabularnewline
18 & -0.735286 & -8.4478 & 0 \tabularnewline
19 & -0.650272 & -7.4711 & 0 \tabularnewline
20 & -0.365946 & -4.2044 & 2.4e-05 \tabularnewline
21 & -0.006602 & -0.0758 & 0.469828 \tabularnewline
22 & 0.357466 & 4.107 & 3.5e-05 \tabularnewline
23 & 0.587749 & 6.7527 & 0 \tabularnewline
24 & 0.769349 & 8.8392 & 0 \tabularnewline
25 & 0.569018 & 6.5375 & 0 \tabularnewline
26 & 0.353425 & 4.0605 & 4.2e-05 \tabularnewline
27 & -0.007151 & -0.0822 & 0.467322 \tabularnewline
28 & -0.347496 & -3.9924 & 5.4e-05 \tabularnewline
29 & -0.562947 & -6.4678 & 0 \tabularnewline
30 & -0.662835 & -7.6154 & 0 \tabularnewline
31 & -0.572621 & -6.5789 & 0 \tabularnewline
32 & -0.328636 & -3.7757 & 0.00012 \tabularnewline
33 & -0.010551 & -0.1212 & 0.451852 \tabularnewline
34 & 0.327435 & 3.7619 & 0.000126 \tabularnewline
35 & 0.520666 & 5.982 & 0 \tabularnewline
36 & 0.674604 & 7.7506 & 0 \tabularnewline
37 & 0.512946 & 5.8933 & 0 \tabularnewline
38 & 0.302568 & 3.4762 & 0.000344 \tabularnewline
39 & -0.00674 & -0.0774 & 0.469196 \tabularnewline
40 & -0.296495 & -3.4065 & 0.000436 \tabularnewline
41 & -0.504444 & -5.7956 & 0 \tabularnewline
42 & -0.584137 & -6.7112 & 0 \tabularnewline
43 & -0.495297 & -5.6905 & 0 \tabularnewline
44 & -0.297358 & -3.4164 & 0.000422 \tabularnewline
45 & -0.010195 & -0.1171 & 0.453467 \tabularnewline
46 & 0.288216 & 3.3113 & 0.000599 \tabularnewline
47 & 0.444731 & 5.1096 & 1e-06 \tabularnewline
48 & 0.594427 & 6.8294 & 0 \tabularnewline
\hline
\end{tabular}
%Source: https://freestatistics.org/blog/index.php?pk=305195&T=1

[TABLE]
[ROW][C]Autocorrelation Function[/C][/ROW]
[ROW][C]Time lag k[/C][C]ACF(k)[/C][C]T-STAT[/C][C]P-value[/C][/ROW]
[ROW][C]1[/C][C]0.704291[/C][C]8.0917[/C][C]0[/C][/ROW]
[ROW][C]2[/C][C]0.419097[/C][C]4.8151[/C][C]2e-06[/C][/ROW]
[ROW][C]3[/C][C]-0.002571[/C][C]-0.0295[/C][C]0.488239[/C][/ROW]
[ROW][C]4[/C][C]-0.440041[/C][C]-5.0557[/C][C]1e-06[/C][/ROW]
[ROW][C]5[/C][C]-0.723297[/C][C]-8.31[/C][C]0[/C][/ROW]
[ROW][C]6[/C][C]-0.812788[/C][C]-9.3382[/C][C]0[/C][/ROW]
[ROW][C]7[/C][C]-0.725101[/C][C]-8.3308[/C][C]0[/C][/ROW]
[ROW][C]8[/C][C]-0.40743[/C][C]-4.681[/C][C]3e-06[/C][/ROW]
[ROW][C]9[/C][C]0.016557[/C][C]0.1902[/C][C]0.424713[/C][/ROW]
[ROW][C]10[/C][C]0.408776[/C][C]4.6965[/C][C]3e-06[/C][/ROW]
[ROW][C]11[/C][C]0.653607[/C][C]7.5094[/C][C]0[/C][/ROW]
[ROW][C]12[/C][C]0.870869[/C][C]10.0055[/C][C]0[/C][/ROW]
[ROW][C]13[/C][C]0.62888[/C][C]7.2253[/C][C]0[/C][/ROW]
[ROW][C]14[/C][C]0.386089[/C][C]4.4358[/C][C]1e-05[/C][/ROW]
[ROW][C]15[/C][C]-0.002824[/C][C]-0.0325[/C][C]0.487081[/C][/ROW]
[ROW][C]16[/C][C]-0.391312[/C][C]-4.4958[/C][C]8e-06[/C][/ROW]
[ROW][C]17[/C][C]-0.636032[/C][C]-7.3075[/C][C]0[/C][/ROW]
[ROW][C]18[/C][C]-0.735286[/C][C]-8.4478[/C][C]0[/C][/ROW]
[ROW][C]19[/C][C]-0.650272[/C][C]-7.4711[/C][C]0[/C][/ROW]
[ROW][C]20[/C][C]-0.365946[/C][C]-4.2044[/C][C]2.4e-05[/C][/ROW]
[ROW][C]21[/C][C]-0.006602[/C][C]-0.0758[/C][C]0.469828[/C][/ROW]
[ROW][C]22[/C][C]0.357466[/C][C]4.107[/C][C]3.5e-05[/C][/ROW]
[ROW][C]23[/C][C]0.587749[/C][C]6.7527[/C][C]0[/C][/ROW]
[ROW][C]24[/C][C]0.769349[/C][C]8.8392[/C][C]0[/C][/ROW]
[ROW][C]25[/C][C]0.569018[/C][C]6.5375[/C][C]0[/C][/ROW]
[ROW][C]26[/C][C]0.353425[/C][C]4.0605[/C][C]4.2e-05[/C][/ROW]
[ROW][C]27[/C][C]-0.007151[/C][C]-0.0822[/C][C]0.467322[/C][/ROW]
[ROW][C]28[/C][C]-0.347496[/C][C]-3.9924[/C][C]5.4e-05[/C][/ROW]
[ROW][C]29[/C][C]-0.562947[/C][C]-6.4678[/C][C]0[/C][/ROW]
[ROW][C]30[/C][C]-0.662835[/C][C]-7.6154[/C][C]0[/C][/ROW]
[ROW][C]31[/C][C]-0.572621[/C][C]-6.5789[/C][C]0[/C][/ROW]
[ROW][C]32[/C][C]-0.328636[/C][C]-3.7757[/C][C]0.00012[/C][/ROW]
[ROW][C]33[/C][C]-0.010551[/C][C]-0.1212[/C][C]0.451852[/C][/ROW]
[ROW][C]34[/C][C]0.327435[/C][C]3.7619[/C][C]0.000126[/C][/ROW]
[ROW][C]35[/C][C]0.520666[/C][C]5.982[/C][C]0[/C][/ROW]
[ROW][C]36[/C][C]0.674604[/C][C]7.7506[/C][C]0[/C][/ROW]
[ROW][C]37[/C][C]0.512946[/C][C]5.8933[/C][C]0[/C][/ROW]
[ROW][C]38[/C][C]0.302568[/C][C]3.4762[/C][C]0.000344[/C][/ROW]
[ROW][C]39[/C][C]-0.00674[/C][C]-0.0774[/C][C]0.469196[/C][/ROW]
[ROW][C]40[/C][C]-0.296495[/C][C]-3.4065[/C][C]0.000436[/C][/ROW]
[ROW][C]41[/C][C]-0.504444[/C][C]-5.7956[/C][C]0[/C][/ROW]
[ROW][C]42[/C][C]-0.584137[/C][C]-6.7112[/C][C]0[/C][/ROW]
[ROW][C]43[/C][C]-0.495297[/C][C]-5.6905[/C][C]0[/C][/ROW]
[ROW][C]44[/C][C]-0.297358[/C][C]-3.4164[/C][C]0.000422[/C][/ROW]
[ROW][C]45[/C][C]-0.010195[/C][C]-0.1171[/C][C]0.453467[/C][/ROW]
[ROW][C]46[/C][C]0.288216[/C][C]3.3113[/C][C]0.000599[/C][/ROW]
[ROW][C]47[/C][C]0.444731[/C][C]5.1096[/C][C]1e-06[/C][/ROW]
[ROW][C]48[/C][C]0.594427[/C][C]6.8294[/C][C]0[/C][/ROW]
[/TABLE]
Source: https://freestatistics.org/blog/index.php?pk=305195&T=1

Globally Unique Identifier (entire table): ba.freestatistics.org/blog/index.php?pk=305195&T=1

As an alternative you can also use a QR Code:  

The GUIDs for individual cells are displayed in the table below:

Autocorrelation Function
Time lag kACF(k)T-STATP-value
10.7042918.09170
20.4190974.81512e-06
3-0.002571-0.02950.488239
4-0.440041-5.05571e-06
5-0.723297-8.310
6-0.812788-9.33820
7-0.725101-8.33080
8-0.40743-4.6813e-06
90.0165570.19020.424713
100.4087764.69653e-06
110.6536077.50940
120.87086910.00550
130.628887.22530
140.3860894.43581e-05
15-0.002824-0.03250.487081
16-0.391312-4.49588e-06
17-0.636032-7.30750
18-0.735286-8.44780
19-0.650272-7.47110
20-0.365946-4.20442.4e-05
21-0.006602-0.07580.469828
220.3574664.1073.5e-05
230.5877496.75270
240.7693498.83920
250.5690186.53750
260.3534254.06054.2e-05
27-0.007151-0.08220.467322
28-0.347496-3.99245.4e-05
29-0.562947-6.46780
30-0.662835-7.61540
31-0.572621-6.57890
32-0.328636-3.77570.00012
33-0.010551-0.12120.451852
340.3274353.76190.000126
350.5206665.9820
360.6746047.75060
370.5129465.89330
380.3025683.47620.000344
39-0.00674-0.07740.469196
40-0.296495-3.40650.000436
41-0.504444-5.79560
42-0.584137-6.71120
43-0.495297-5.69050
44-0.297358-3.41640.000422
45-0.010195-0.11710.453467
460.2882163.31130.000599
470.4447315.10961e-06
480.5944276.82940


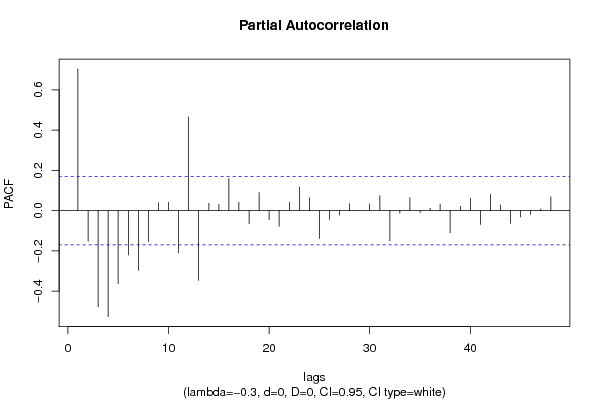
Partial Autocorrelation Function
Time lag kPACF(k)T-STATP-value
10.7042918.09170
2-0.152645-1.75380.040897
3-0.477999-5.49180
4-0.527019-6.0550
5-0.363831-4.18012.6e-05
6-0.219889-2.52630.006354
7-0.296407-3.40550.000438
8-0.153103-1.7590.040446
90.0396160.45520.324872
100.0416970.47910.316345
11-0.209823-2.41070.00865
120.4650885.34340
13-0.346696-3.98325.6e-05
140.0370050.42520.335707
150.0304970.35040.363306
160.1592951.83020.034741
170.0419890.48240.315154
18-0.06526-0.74980.227361
190.0896371.02990.152482
20-0.044832-0.51510.303677
21-0.077251-0.88750.188201
220.041480.47660.317228
230.1159381.3320.092573
240.0637360.73230.232651
25-0.138487-1.59110.05699
26-0.043882-0.50420.307494
27-0.021749-0.24990.401534
280.0342870.39390.347137
29-0.000294-0.00340.498656
300.0327720.37650.353568
310.0739060.84910.198678
32-0.150108-1.72460.043469
33-0.012673-0.14560.442227
340.0641190.73670.231315
35-0.009433-0.10840.456929
360.0120670.13860.444972
370.0331810.38120.351827
38-0.109426-1.25720.105448
390.0211990.24360.403977
400.0624050.7170.237327
41-0.068235-0.7840.217232
420.0803990.92370.178659
430.0279020.32060.374522
44-0.063142-0.72540.234731
45-0.031887-0.36640.357344
46-0.01898-0.21810.413857
470.0077710.08930.464496
480.0694120.79750.2133

\begin{tabular}{lllllllll}
\hline
Partial Autocorrelation Function \tabularnewline
Time lag k & PACF(k) & T-STAT & P-value \tabularnewline
1 & 0.704291 & 8.0917 & 0 \tabularnewline
2 & -0.152645 & -1.7538 & 0.040897 \tabularnewline
3 & -0.477999 & -5.4918 & 0 \tabularnewline
4 & -0.527019 & -6.055 & 0 \tabularnewline
5 & -0.363831 & -4.1801 & 2.6e-05 \tabularnewline
6 & -0.219889 & -2.5263 & 0.006354 \tabularnewline
7 & -0.296407 & -3.4055 & 0.000438 \tabularnewline
8 & -0.153103 & -1.759 & 0.040446 \tabularnewline
9 & 0.039616 & 0.4552 & 0.324872 \tabularnewline
10 & 0.041697 & 0.4791 & 0.316345 \tabularnewline
11 & -0.209823 & -2.4107 & 0.00865 \tabularnewline
12 & 0.465088 & 5.3434 & 0 \tabularnewline
13 & -0.346696 & -3.9832 & 5.6e-05 \tabularnewline
14 & 0.037005 & 0.4252 & 0.335707 \tabularnewline
15 & 0.030497 & 0.3504 & 0.363306 \tabularnewline
16 & 0.159295 & 1.8302 & 0.034741 \tabularnewline
17 & 0.041989 & 0.4824 & 0.315154 \tabularnewline
18 & -0.06526 & -0.7498 & 0.227361 \tabularnewline
19 & 0.089637 & 1.0299 & 0.152482 \tabularnewline
20 & -0.044832 & -0.5151 & 0.303677 \tabularnewline
21 & -0.077251 & -0.8875 & 0.188201 \tabularnewline
22 & 0.04148 & 0.4766 & 0.317228 \tabularnewline
23 & 0.115938 & 1.332 & 0.092573 \tabularnewline
24 & 0.063736 & 0.7323 & 0.232651 \tabularnewline
25 & -0.138487 & -1.5911 & 0.05699 \tabularnewline
26 & -0.043882 & -0.5042 & 0.307494 \tabularnewline
27 & -0.021749 & -0.2499 & 0.401534 \tabularnewline
28 & 0.034287 & 0.3939 & 0.347137 \tabularnewline
29 & -0.000294 & -0.0034 & 0.498656 \tabularnewline
30 & 0.032772 & 0.3765 & 0.353568 \tabularnewline
31 & 0.073906 & 0.8491 & 0.198678 \tabularnewline
32 & -0.150108 & -1.7246 & 0.043469 \tabularnewline
33 & -0.012673 & -0.1456 & 0.442227 \tabularnewline
34 & 0.064119 & 0.7367 & 0.231315 \tabularnewline
35 & -0.009433 & -0.1084 & 0.456929 \tabularnewline
36 & 0.012067 & 0.1386 & 0.444972 \tabularnewline
37 & 0.033181 & 0.3812 & 0.351827 \tabularnewline
38 & -0.109426 & -1.2572 & 0.105448 \tabularnewline
39 & 0.021199 & 0.2436 & 0.403977 \tabularnewline
40 & 0.062405 & 0.717 & 0.237327 \tabularnewline
41 & -0.068235 & -0.784 & 0.217232 \tabularnewline
42 & 0.080399 & 0.9237 & 0.178659 \tabularnewline
43 & 0.027902 & 0.3206 & 0.374522 \tabularnewline
44 & -0.063142 & -0.7254 & 0.234731 \tabularnewline
45 & -0.031887 & -0.3664 & 0.357344 \tabularnewline
46 & -0.01898 & -0.2181 & 0.413857 \tabularnewline
47 & 0.007771 & 0.0893 & 0.464496 \tabularnewline
48 & 0.069412 & 0.7975 & 0.2133 \tabularnewline
\hline
\end{tabular}
%Source: https://freestatistics.org/blog/index.php?pk=305195&T=2

[TABLE]
[ROW][C]Partial Autocorrelation Function[/C][/ROW]
[ROW][C]Time lag k[/C][C]PACF(k)[/C][C]T-STAT[/C][C]P-value[/C][/ROW]
[ROW][C]1[/C][C]0.704291[/C][C]8.0917[/C][C]0[/C][/ROW]
[ROW][C]2[/C][C]-0.152645[/C][C]-1.7538[/C][C]0.040897[/C][/ROW]
[ROW][C]3[/C][C]-0.477999[/C][C]-5.4918[/C][C]0[/C][/ROW]
[ROW][C]4[/C][C]-0.527019[/C][C]-6.055[/C][C]0[/C][/ROW]
[ROW][C]5[/C][C]-0.363831[/C][C]-4.1801[/C][C]2.6e-05[/C][/ROW]
[ROW][C]6[/C][C]-0.219889[/C][C]-2.5263[/C][C]0.006354[/C][/ROW]
[ROW][C]7[/C][C]-0.296407[/C][C]-3.4055[/C][C]0.000438[/C][/ROW]
[ROW][C]8[/C][C]-0.153103[/C][C]-1.759[/C][C]0.040446[/C][/ROW]
[ROW][C]9[/C][C]0.039616[/C][C]0.4552[/C][C]0.324872[/C][/ROW]
[ROW][C]10[/C][C]0.041697[/C][C]0.4791[/C][C]0.316345[/C][/ROW]
[ROW][C]11[/C][C]-0.209823[/C][C]-2.4107[/C][C]0.00865[/C][/ROW]
[ROW][C]12[/C][C]0.465088[/C][C]5.3434[/C][C]0[/C][/ROW]
[ROW][C]13[/C][C]-0.346696[/C][C]-3.9832[/C][C]5.6e-05[/C][/ROW]
[ROW][C]14[/C][C]0.037005[/C][C]0.4252[/C][C]0.335707[/C][/ROW]
[ROW][C]15[/C][C]0.030497[/C][C]0.3504[/C][C]0.363306[/C][/ROW]
[ROW][C]16[/C][C]0.159295[/C][C]1.8302[/C][C]0.034741[/C][/ROW]
[ROW][C]17[/C][C]0.041989[/C][C]0.4824[/C][C]0.315154[/C][/ROW]
[ROW][C]18[/C][C]-0.06526[/C][C]-0.7498[/C][C]0.227361[/C][/ROW]
[ROW][C]19[/C][C]0.089637[/C][C]1.0299[/C][C]0.152482[/C][/ROW]
[ROW][C]20[/C][C]-0.044832[/C][C]-0.5151[/C][C]0.303677[/C][/ROW]
[ROW][C]21[/C][C]-0.077251[/C][C]-0.8875[/C][C]0.188201[/C][/ROW]
[ROW][C]22[/C][C]0.04148[/C][C]0.4766[/C][C]0.317228[/C][/ROW]
[ROW][C]23[/C][C]0.115938[/C][C]1.332[/C][C]0.092573[/C][/ROW]
[ROW][C]24[/C][C]0.063736[/C][C]0.7323[/C][C]0.232651[/C][/ROW]
[ROW][C]25[/C][C]-0.138487[/C][C]-1.5911[/C][C]0.05699[/C][/ROW]
[ROW][C]26[/C][C]-0.043882[/C][C]-0.5042[/C][C]0.307494[/C][/ROW]
[ROW][C]27[/C][C]-0.021749[/C][C]-0.2499[/C][C]0.401534[/C][/ROW]
[ROW][C]28[/C][C]0.034287[/C][C]0.3939[/C][C]0.347137[/C][/ROW]
[ROW][C]29[/C][C]-0.000294[/C][C]-0.0034[/C][C]0.498656[/C][/ROW]
[ROW][C]30[/C][C]0.032772[/C][C]0.3765[/C][C]0.353568[/C][/ROW]
[ROW][C]31[/C][C]0.073906[/C][C]0.8491[/C][C]0.198678[/C][/ROW]
[ROW][C]32[/C][C]-0.150108[/C][C]-1.7246[/C][C]0.043469[/C][/ROW]
[ROW][C]33[/C][C]-0.012673[/C][C]-0.1456[/C][C]0.442227[/C][/ROW]
[ROW][C]34[/C][C]0.064119[/C][C]0.7367[/C][C]0.231315[/C][/ROW]
[ROW][C]35[/C][C]-0.009433[/C][C]-0.1084[/C][C]0.456929[/C][/ROW]
[ROW][C]36[/C][C]0.012067[/C][C]0.1386[/C][C]0.444972[/C][/ROW]
[ROW][C]37[/C][C]0.033181[/C][C]0.3812[/C][C]0.351827[/C][/ROW]
[ROW][C]38[/C][C]-0.109426[/C][C]-1.2572[/C][C]0.105448[/C][/ROW]
[ROW][C]39[/C][C]0.021199[/C][C]0.2436[/C][C]0.403977[/C][/ROW]
[ROW][C]40[/C][C]0.062405[/C][C]0.717[/C][C]0.237327[/C][/ROW]
[ROW][C]41[/C][C]-0.068235[/C][C]-0.784[/C][C]0.217232[/C][/ROW]
[ROW][C]42[/C][C]0.080399[/C][C]0.9237[/C][C]0.178659[/C][/ROW]
[ROW][C]43[/C][C]0.027902[/C][C]0.3206[/C][C]0.374522[/C][/ROW]
[ROW][C]44[/C][C]-0.063142[/C][C]-0.7254[/C][C]0.234731[/C][/ROW]
[ROW][C]45[/C][C]-0.031887[/C][C]-0.3664[/C][C]0.357344[/C][/ROW]
[ROW][C]46[/C][C]-0.01898[/C][C]-0.2181[/C][C]0.413857[/C][/ROW]
[ROW][C]47[/C][C]0.007771[/C][C]0.0893[/C][C]0.464496[/C][/ROW]
[ROW][C]48[/C][C]0.069412[/C][C]0.7975[/C][C]0.2133[/C][/ROW]
[/TABLE]
Source: https://freestatistics.org/blog/index.php?pk=305195&T=2

Globally Unique Identifier (entire table): ba.freestatistics.org/blog/index.php?pk=305195&T=2

As an alternative you can also use a QR Code:  

The GUIDs for individual cells are displayed in the table below:

Partial Autocorrelation Function
Time lag kPACF(k)T-STATP-value
10.7042918.09170
2-0.152645-1.75380.040897
3-0.477999-5.49180
4-0.527019-6.0550
5-0.363831-4.18012.6e-05
6-0.219889-2.52630.006354
7-0.296407-3.40550.000438
8-0.153103-1.7590.040446
90.0396160.45520.324872
100.0416970.47910.316345
11-0.209823-2.41070.00865
120.4650885.34340
13-0.346696-3.98325.6e-05
140.0370050.42520.335707
150.0304970.35040.363306
160.1592951.83020.034741
170.0419890.48240.315154
18-0.06526-0.74980.227361
190.0896371.02990.152482
20-0.044832-0.51510.303677
21-0.077251-0.88750.188201
220.041480.47660.317228
230.1159381.3320.092573
240.0637360.73230.232651
25-0.138487-1.59110.05699
26-0.043882-0.50420.307494
27-0.021749-0.24990.401534
280.0342870.39390.347137
29-0.000294-0.00340.498656
300.0327720.37650.353568
310.0739060.84910.198678
32-0.150108-1.72460.043469
33-0.012673-0.14560.442227
340.0641190.73670.231315
35-0.009433-0.10840.456929
360.0120670.13860.444972
370.0331810.38120.351827
38-0.109426-1.25720.105448
390.0211990.24360.403977
400.0624050.7170.237327
41-0.068235-0.7840.217232
420.0803990.92370.178659
430.0279020.32060.374522
44-0.063142-0.72540.234731
45-0.031887-0.36640.357344
46-0.01898-0.21810.413857
470.0077710.08930.464496
480.0694120.79750.2133


Parameters (Session):
par1 = 1 ; par2 = 2 ; par3 = Exact Pearson Chi-Squared by Simulation ;
Parameters (R input):
par1 = 48 ; par2 = -0.3 ; par3 = 0 ; par4 = 0 ; par5 = 12 ; par6 = White Noise ; par7 = 0.95 ; par8 = ;
R code (references can be found in the software module):
par8 <- ''
par7 <- '0.95'
par6 <- 'White Noise'
par5 <- '12'
par4 <- '0'
par3 <- '0'
par2 <- '-0.3'
par1 <- 'Default'
if (par1 == 'Default') {
par1 = 10*log10(length(x))
} else {
par1 <- as.numeric(par1)
}
par2 <- as.numeric(par2)
par3 <- as.numeric(par3)
par4 <- as.numeric(par4)
par5 <- as.numeric(par5)
if (par6 == 'White Noise') par6 <- 'white' else par6 <- 'ma'
par7 <- as.numeric(par7)
if (par8 != '') par8 <- as.numeric(par8)
x <- na.omit(x)
ox <- x
if (par8 == '') {
if (par2 == 0) {
x <- log(x)
} else {
x <- (x ^ par2 - 1) / par2
}
} else {
x <- log(x,base=par8)
}
if (par3 > 0) x <- diff(x,lag=1,difference=par3)
if (par4 > 0) x <- diff(x,lag=par5,difference=par4)
bitmap(file='picts.png')
op <- par(mfrow=c(2,1))
plot(ox,type='l',main='Original Time Series',xlab='time',ylab='value')
if (par8=='') {
mytitle <- paste('Working Time Series (lambda=',par2,', d=',par3,', D=',par4,')',sep='')
mysub <- paste('(lambda=',par2,', d=',par3,', D=',par4,', CI=', par7, ', CI type=',par6,')',sep='')
} else {
mytitle <- paste('Working Time Series (base=',par8,', d=',par3,', D=',par4,')',sep='')
mysub <- paste('(base=',par8,', d=',par3,', D=',par4,', CI=', par7, ', CI type=',par6,')',sep='')
}
plot(x,type='l', main=mytitle,xlab='time',ylab='value')
par(op)
dev.off()
bitmap(file='pic1.png')
racf <- acf(x, par1, main='Autocorrelation', xlab='time lag', ylab='ACF', ci.type=par6, ci=par7, sub=mysub)
dev.off()
bitmap(file='pic2.png')
rpacf <- pacf(x,par1,main='Partial Autocorrelation',xlab='lags',ylab='PACF',sub=mysub)
dev.off()
(myacf <- c(racf$acf))
(mypacf <- c(rpacf$acf))
lengthx <- length(x)
sqrtn <- sqrt(lengthx)
load(file='createtable')
a<-table.start()
a<-table.row.start(a)
a<-table.element(a,'Autocorrelation Function',4,TRUE)
a<-table.row.end(a)
a<-table.row.start(a)
a<-table.element(a,'Time lag k',header=TRUE)
a<-table.element(a,'ACF(k)',header=TRUE)
a<-table.element(a,'T-STAT',header=TRUE)
a<-table.element(a,'P-value',header=TRUE)
a<-table.row.end(a)
for (i in 2:(par1+1)) {
a<-table.row.start(a)
a<-table.element(a,i-1,header=TRUE)
a<-table.element(a,round(myacf[i],6))
mytstat <- myacf[i]*sqrtn
a<-table.element(a,round(mytstat,4))
a<-table.element(a,round(1-pt(abs(mytstat),lengthx),6))
a<-table.row.end(a)
}
a<-table.end(a)
table.save(a,file='mytable.tab')
a<-table.start()
a<-table.row.start(a)
a<-table.element(a,'Partial Autocorrelation Function',4,TRUE)
a<-table.row.end(a)
a<-table.row.start(a)
a<-table.element(a,'Time lag k',header=TRUE)
a<-table.element(a,'PACF(k)',header=TRUE)
a<-table.element(a,'T-STAT',header=TRUE)
a<-table.element(a,'P-value',header=TRUE)
a<-table.row.end(a)
for (i in 1:par1) {
a<-table.row.start(a)
a<-table.element(a,i,header=TRUE)
a<-table.element(a,round(mypacf[i],6))
mytstat <- mypacf[i]*sqrtn
a<-table.element(a,round(mytstat,4))
a<-table.element(a,round(1-pt(abs(mytstat),lengthx),6))
a<-table.row.end(a)
}
a<-table.end(a)
table.save(a,file='mytable1.tab')