Free Statistics

of Irreproducible Research!

Author's title

Author*The author of this computation has been verified*
R Software Modulerwasp_exponentialsmoothing.wasp
Title produced by softwareExponential Smoothing
Date of computationMon, 23 Jan 2017 12:08:25 +0100
Cite this page as followsStatistical Computations at FreeStatistics.org, Office for Research Development and Education, URL https://freestatistics.org/blog/index.php?v=date/2017/Jan/23/t1485169713l3yt9w1hnxgm4ur.htm/, Retrieved Wed, 15 May 2024 05:44:46 +0200
Statistical Computations at FreeStatistics.org, Office for Research Development and Education, URL https://freestatistics.org/blog/index.php?pk=, Retrieved Wed, 15 May 2024 05:44:46 +0200
QR Codes:

Original text written by user:
IsPrivate?No (this computation is public)
User-defined keywords
Estimated Impact0
Dataseries X:
3.2
3.3
3
3.5
3.7
2.7
3.6
3.5
3.8
3.4
3.7
3.5
2.8
3.8
4.3
3.3
3.6
3.6
3.3
2.8


Summary of computational transaction
Raw Input view raw input (R code)
Raw Outputview raw output of R engine
Computing time1 seconds
R ServerBig Analytics Cloud Computing Center

\begin{tabular}{lllllllll}
\hline
Summary of computational transaction \tabularnewline
Raw Input view raw input (R code)  \tabularnewline
Raw Outputview raw output of R engine  \tabularnewline
Computing time1 seconds \tabularnewline
R ServerBig Analytics Cloud Computing Center \tabularnewline
\hline
\end{tabular}
%Source: https://freestatistics.org/blog/index.php?pk=&T=0

[TABLE]
[ROW]
Summary of computational transaction[/C][/ROW] [ROW]Raw Input[/C] view raw input (R code) [/C][/ROW] [ROW]Raw Output[/C]view raw output of R engine [/C][/ROW] [ROW]Computing time[/C]1 seconds[/C][/ROW] [ROW]R Server[/C]Big Analytics Cloud Computing Center[/C][/ROW] [/TABLE] Source: https://freestatistics.org/blog/index.php?pk=&T=0

Globally Unique Identifier (entire table): ba.freestatistics.org/blog/index.php?pk=&T=0

As an alternative you can also use a QR Code:  

The GUIDs for individual cells are displayed in the table below:

Summary of computational transaction
Raw Input view raw input (R code)
Raw Outputview raw output of R engine
Computing time1 seconds
R ServerBig Analytics Cloud Computing Center


Estimated Parameters of Exponential Smoothing
ParameterValue
alpha0.0664734104791699
beta1
gammaFALSE

\begin{tabular}{lllllllll}
\hline
Estimated Parameters of Exponential Smoothing \tabularnewline
Parameter & Value \tabularnewline
alpha & 0.0664734104791699 \tabularnewline
beta & 1 \tabularnewline
gamma & FALSE \tabularnewline
\hline
\end{tabular}
%Source: https://freestatistics.org/blog/index.php?pk=&T=1

[TABLE]
[ROW][C]Estimated Parameters of Exponential Smoothing[/C][/ROW]
[ROW][C]Parameter[/C][C]Value[/C][/ROW]
[ROW][C]alpha[/C][C]0.0664734104791699[/C][/ROW]
[ROW][C]beta[/C][C]1[/C][/ROW]
[ROW][C]gamma[/C][C]FALSE[/C][/ROW]
[/TABLE]
Source: https://freestatistics.org/blog/index.php?pk=&T=1

Globally Unique Identifier (entire table): ba.freestatistics.org/blog/index.php?pk=&T=1

As an alternative you can also use a QR Code:  

The GUIDs for individual cells are displayed in the table below:

Estimated Parameters of Exponential Smoothing
ParameterValue
alpha0.0664734104791699
beta1
gammaFALSE


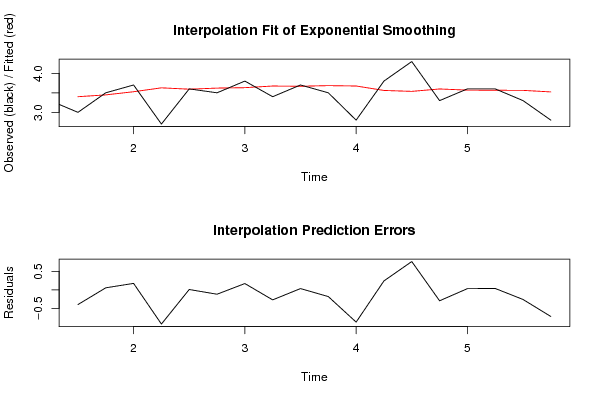
Interpolation Forecasts of Exponential Smoothing
tObservedFittedResiduals
333.4-0.399999999999999
43.53.446821271616660.0531787283833367
53.73.527301850306170.172698149693833
62.73.62720712754227-0.927207127542267
73.63.592363329808120.00763667019188308
83.53.62016942308701-0.120169423087014
93.83.631491738077740.168508261922264
103.43.67320476218415-0.273204762184146
113.73.66739476282360.0326052371763956
123.53.68408037839379-0.184080378393788
132.83.67412571154111-0.874125711541112
143.83.560195260775230.239804739224771
154.33.536252204973690.763747795026307
163.33.59790635166951-0.297906351669507
173.63.569185875286220.0308141247137828
183.63.564364890023120.0356351099768824
193.33.56223315938529-0.26223315938529
202.83.52286957656436-0.722869576564362

\begin{tabular}{lllllllll}
\hline
Interpolation Forecasts of Exponential Smoothing \tabularnewline
t & Observed & Fitted & Residuals \tabularnewline
3 & 3 & 3.4 & -0.399999999999999 \tabularnewline
4 & 3.5 & 3.44682127161666 & 0.0531787283833367 \tabularnewline
5 & 3.7 & 3.52730185030617 & 0.172698149693833 \tabularnewline
6 & 2.7 & 3.62720712754227 & -0.927207127542267 \tabularnewline
7 & 3.6 & 3.59236332980812 & 0.00763667019188308 \tabularnewline
8 & 3.5 & 3.62016942308701 & -0.120169423087014 \tabularnewline
9 & 3.8 & 3.63149173807774 & 0.168508261922264 \tabularnewline
10 & 3.4 & 3.67320476218415 & -0.273204762184146 \tabularnewline
11 & 3.7 & 3.6673947628236 & 0.0326052371763956 \tabularnewline
12 & 3.5 & 3.68408037839379 & -0.184080378393788 \tabularnewline
13 & 2.8 & 3.67412571154111 & -0.874125711541112 \tabularnewline
14 & 3.8 & 3.56019526077523 & 0.239804739224771 \tabularnewline
15 & 4.3 & 3.53625220497369 & 0.763747795026307 \tabularnewline
16 & 3.3 & 3.59790635166951 & -0.297906351669507 \tabularnewline
17 & 3.6 & 3.56918587528622 & 0.0308141247137828 \tabularnewline
18 & 3.6 & 3.56436489002312 & 0.0356351099768824 \tabularnewline
19 & 3.3 & 3.56223315938529 & -0.26223315938529 \tabularnewline
20 & 2.8 & 3.52286957656436 & -0.722869576564362 \tabularnewline
\hline
\end{tabular}
%Source: https://freestatistics.org/blog/index.php?pk=&T=2

[TABLE]
[ROW][C]Interpolation Forecasts of Exponential Smoothing[/C][/ROW]
[ROW][C]t[/C][C]Observed[/C][C]Fitted[/C][C]Residuals[/C][/ROW]
[ROW][C]3[/C][C]3[/C][C]3.4[/C][C]-0.399999999999999[/C][/ROW]
[ROW][C]4[/C][C]3.5[/C][C]3.44682127161666[/C][C]0.0531787283833367[/C][/ROW]
[ROW][C]5[/C][C]3.7[/C][C]3.52730185030617[/C][C]0.172698149693833[/C][/ROW]
[ROW][C]6[/C][C]2.7[/C][C]3.62720712754227[/C][C]-0.927207127542267[/C][/ROW]
[ROW][C]7[/C][C]3.6[/C][C]3.59236332980812[/C][C]0.00763667019188308[/C][/ROW]
[ROW][C]8[/C][C]3.5[/C][C]3.62016942308701[/C][C]-0.120169423087014[/C][/ROW]
[ROW][C]9[/C][C]3.8[/C][C]3.63149173807774[/C][C]0.168508261922264[/C][/ROW]
[ROW][C]10[/C][C]3.4[/C][C]3.67320476218415[/C][C]-0.273204762184146[/C][/ROW]
[ROW][C]11[/C][C]3.7[/C][C]3.6673947628236[/C][C]0.0326052371763956[/C][/ROW]
[ROW][C]12[/C][C]3.5[/C][C]3.68408037839379[/C][C]-0.184080378393788[/C][/ROW]
[ROW][C]13[/C][C]2.8[/C][C]3.67412571154111[/C][C]-0.874125711541112[/C][/ROW]
[ROW][C]14[/C][C]3.8[/C][C]3.56019526077523[/C][C]0.239804739224771[/C][/ROW]
[ROW][C]15[/C][C]4.3[/C][C]3.53625220497369[/C][C]0.763747795026307[/C][/ROW]
[ROW][C]16[/C][C]3.3[/C][C]3.59790635166951[/C][C]-0.297906351669507[/C][/ROW]
[ROW][C]17[/C][C]3.6[/C][C]3.56918587528622[/C][C]0.0308141247137828[/C][/ROW]
[ROW][C]18[/C][C]3.6[/C][C]3.56436489002312[/C][C]0.0356351099768824[/C][/ROW]
[ROW][C]19[/C][C]3.3[/C][C]3.56223315938529[/C][C]-0.26223315938529[/C][/ROW]
[ROW][C]20[/C][C]2.8[/C][C]3.52286957656436[/C][C]-0.722869576564362[/C][/ROW]
[/TABLE]
Source: https://freestatistics.org/blog/index.php?pk=&T=2

Globally Unique Identifier (entire table): ba.freestatistics.org/blog/index.php?pk=&T=2

As an alternative you can also use a QR Code:  

The GUIDs for individual cells are displayed in the table below:

Interpolation Forecasts of Exponential Smoothing
tObservedFittedResiduals
333.4-0.399999999999999
43.53.446821271616660.0531787283833367
53.73.527301850306170.172698149693833
62.73.62720712754227-0.927207127542267
73.63.592363329808120.00763667019188308
83.53.62016942308701-0.120169423087014
93.83.631491738077740.168508261922264
103.43.67320476218415-0.273204762184146
113.73.66739476282360.0326052371763956
123.53.68408037839379-0.184080378393788
132.83.67412571154111-0.874125711541112
143.83.560195260775230.239804739224771
154.33.536252204973690.763747795026307
163.33.59790635166951-0.297906351669507
173.63.569185875286220.0308141247137828
183.63.564364890023120.0356351099768824
193.33.56223315938529-0.26223315938529
202.83.52286957656436-0.722869576564362


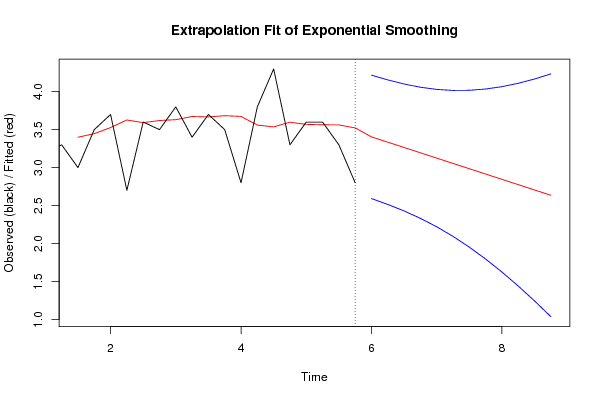
Extrapolation Forecasts of Exponential Smoothing
tForecast95% Lower Bound95% Upper Bound
213.404834314016772.591320428341144.2183481996924
223.334850657555042.514178891092394.15552242401769
233.264867001093322.428313902388214.10142009979842
243.194883344631592.330817194802444.05894949446074
253.124899688169862.219516634268254.03028274207148
263.054916031708142.093149828814224.01668223460205
272.984932375246411.951353046635494.01851170385733
282.914948718784681.79448313437724.03541430319217
292.844965062322961.623362191501454.06656793314446
302.774981405861231.439037460163694.11092535155877
312.70499774939951.242605963651834.16738953514718
322.635014092937781.035110110203394.23491807567217

\begin{tabular}{lllllllll}
\hline
Extrapolation Forecasts of Exponential Smoothing \tabularnewline
t & Forecast & 95% Lower Bound & 95% Upper Bound \tabularnewline
21 & 3.40483431401677 & 2.59132042834114 & 4.2183481996924 \tabularnewline
22 & 3.33485065755504 & 2.51417889109239 & 4.15552242401769 \tabularnewline
23 & 3.26486700109332 & 2.42831390238821 & 4.10142009979842 \tabularnewline
24 & 3.19488334463159 & 2.33081719480244 & 4.05894949446074 \tabularnewline
25 & 3.12489968816986 & 2.21951663426825 & 4.03028274207148 \tabularnewline
26 & 3.05491603170814 & 2.09314982881422 & 4.01668223460205 \tabularnewline
27 & 2.98493237524641 & 1.95135304663549 & 4.01851170385733 \tabularnewline
28 & 2.91494871878468 & 1.7944831343772 & 4.03541430319217 \tabularnewline
29 & 2.84496506232296 & 1.62336219150145 & 4.06656793314446 \tabularnewline
30 & 2.77498140586123 & 1.43903746016369 & 4.11092535155877 \tabularnewline
31 & 2.7049977493995 & 1.24260596365183 & 4.16738953514718 \tabularnewline
32 & 2.63501409293778 & 1.03511011020339 & 4.23491807567217 \tabularnewline
\hline
\end{tabular}
%Source: https://freestatistics.org/blog/index.php?pk=&T=3

[TABLE]
[ROW][C]Extrapolation Forecasts of Exponential Smoothing[/C][/ROW]
[ROW][C]t[/C][C]Forecast[/C][C]95% Lower Bound[/C][C]95% Upper Bound[/C][/ROW]
[ROW][C]21[/C][C]3.40483431401677[/C][C]2.59132042834114[/C][C]4.2183481996924[/C][/ROW]
[ROW][C]22[/C][C]3.33485065755504[/C][C]2.51417889109239[/C][C]4.15552242401769[/C][/ROW]
[ROW][C]23[/C][C]3.26486700109332[/C][C]2.42831390238821[/C][C]4.10142009979842[/C][/ROW]
[ROW][C]24[/C][C]3.19488334463159[/C][C]2.33081719480244[/C][C]4.05894949446074[/C][/ROW]
[ROW][C]25[/C][C]3.12489968816986[/C][C]2.21951663426825[/C][C]4.03028274207148[/C][/ROW]
[ROW][C]26[/C][C]3.05491603170814[/C][C]2.09314982881422[/C][C]4.01668223460205[/C][/ROW]
[ROW][C]27[/C][C]2.98493237524641[/C][C]1.95135304663549[/C][C]4.01851170385733[/C][/ROW]
[ROW][C]28[/C][C]2.91494871878468[/C][C]1.7944831343772[/C][C]4.03541430319217[/C][/ROW]
[ROW][C]29[/C][C]2.84496506232296[/C][C]1.62336219150145[/C][C]4.06656793314446[/C][/ROW]
[ROW][C]30[/C][C]2.77498140586123[/C][C]1.43903746016369[/C][C]4.11092535155877[/C][/ROW]
[ROW][C]31[/C][C]2.7049977493995[/C][C]1.24260596365183[/C][C]4.16738953514718[/C][/ROW]
[ROW][C]32[/C][C]2.63501409293778[/C][C]1.03511011020339[/C][C]4.23491807567217[/C][/ROW]
[/TABLE]
Source: https://freestatistics.org/blog/index.php?pk=&T=3

Globally Unique Identifier (entire table): ba.freestatistics.org/blog/index.php?pk=&T=3

As an alternative you can also use a QR Code:  

The GUIDs for individual cells are displayed in the table below:

Extrapolation Forecasts of Exponential Smoothing
tForecast95% Lower Bound95% Upper Bound
213.404834314016772.591320428341144.2183481996924
223.334850657555042.514178891092394.15552242401769
233.264867001093322.428313902388214.10142009979842
243.194883344631592.330817194802444.05894949446074
253.124899688169862.219516634268254.03028274207148
263.054916031708142.093149828814224.01668223460205
272.984932375246411.951353046635494.01851170385733
282.914948718784681.79448313437724.03541430319217
292.844965062322961.623362191501454.06656793314446
302.774981405861231.439037460163694.11092535155877
312.70499774939951.242605963651834.16738953514718
322.635014092937781.035110110203394.23491807567217


Parameters (Session):
par1 = 41214444 ; par2 = 122DoubleDoubleDoubleDouble ; par3 = BFGSExact Pearson Chi-Squared by Simulationadditiveadditiveadditiveadditive ; par4 = 12121212 ;
Parameters (R input):
par1 = 4 ; par2 = Double ; par3 = additive ; par4 = 12 ;
R code (references can be found in the software module):
par4 <- '12'
par3 <- 'additive'
par2 <- 'Double'
par1 <- '4'
par1 <- as.numeric(par1)
par4 <- as.numeric(par4)
if (par2 == 'Single') K <- 1
if (par2 == 'Double') K <- 2
if (par2 == 'Triple') K <- par1
nx <- length(x)
nxmK <- nx - K
x <- ts(x, frequency = par1)
if (par2 == 'Single') fit <- HoltWinters(x, gamma=F, beta=F)
if (par2 == 'Double') fit <- HoltWinters(x, gamma=F)
if (par2 == 'Triple') fit <- HoltWinters(x, seasonal=par3)
fit
myresid <- x - fit$fitted[,'xhat']
bitmap(file='test1.png')
op <- par(mfrow=c(2,1))
plot(fit,ylab='Observed (black) / Fitted (red)',main='Interpolation Fit of Exponential Smoothing')
plot(myresid,ylab='Residuals',main='Interpolation Prediction Errors')
par(op)
dev.off()
bitmap(file='test2.png')
p <- predict(fit, par4, prediction.interval=TRUE)
np <- length(p[,1])
plot(fit,p,ylab='Observed (black) / Fitted (red)',main='Extrapolation Fit of Exponential Smoothing')
dev.off()
bitmap(file='test3.png')
op <- par(mfrow = c(2,2))
acf(as.numeric(myresid),lag.max = nx/2,main='Residual ACF')
spectrum(myresid,main='Residals Periodogram')
cpgram(myresid,main='Residal Cumulative Periodogram')
qqnorm(myresid,main='Residual Normal QQ Plot')
qqline(myresid)
par(op)
dev.off()
load(file='createtable')
a<-table.start()
a<-table.row.start(a)
a<-table.element(a,'Estimated Parameters of Exponential Smoothing',2,TRUE)
a<-table.row.end(a)
a<-table.row.start(a)
a<-table.element(a,'Parameter',header=TRUE)
a<-table.element(a,'Value',header=TRUE)
a<-table.row.end(a)
a<-table.row.start(a)
a<-table.element(a,'alpha',header=TRUE)
a<-table.element(a,fit$alpha)
a<-table.row.end(a)
a<-table.row.start(a)
a<-table.element(a,'beta',header=TRUE)
a<-table.element(a,fit$beta)
a<-table.row.end(a)
a<-table.row.start(a)
a<-table.element(a,'gamma',header=TRUE)
a<-table.element(a,fit$gamma)
a<-table.row.end(a)
a<-table.end(a)
table.save(a,file='mytable.tab')
a<-table.start()
a<-table.row.start(a)
a<-table.element(a,'Interpolation Forecasts of Exponential Smoothing',4,TRUE)
a<-table.row.end(a)
a<-table.row.start(a)
a<-table.element(a,'t',header=TRUE)
a<-table.element(a,'Observed',header=TRUE)
a<-table.element(a,'Fitted',header=TRUE)
a<-table.element(a,'Residuals',header=TRUE)
a<-table.row.end(a)
for (i in 1:nxmK) {
a<-table.row.start(a)
a<-table.element(a,i+K,header=TRUE)
a<-table.element(a,x[i+K])
a<-table.element(a,fit$fitted[i,'xhat'])
a<-table.element(a,myresid[i])
a<-table.row.end(a)
}
a<-table.end(a)
table.save(a,file='mytable1.tab')
a<-table.start()
a<-table.row.start(a)
a<-table.element(a,'Extrapolation Forecasts of Exponential Smoothing',4,TRUE)
a<-table.row.end(a)
a<-table.row.start(a)
a<-table.element(a,'t',header=TRUE)
a<-table.element(a,'Forecast',header=TRUE)
a<-table.element(a,'95% Lower Bound',header=TRUE)
a<-table.element(a,'95% Upper Bound',header=TRUE)
a<-table.row.end(a)
for (i in 1:np) {
a<-table.row.start(a)
a<-table.element(a,nx+i,header=TRUE)
a<-table.element(a,p[i,'fit'])
a<-table.element(a,p[i,'lwr'])
a<-table.element(a,p[i,'upr'])
a<-table.row.end(a)
}
a<-table.end(a)
table.save(a,file='mytable2.tab')