Free Statistics

of Irreproducible Research!

Author's title

Author*The author of this computation has been verified*
R Software Modulerwasp_multipleregression.wasp
Title produced by softwareMultiple Regression
Date of computationMon, 23 Jan 2017 10:58:00 +0100
Cite this page as followsStatistical Computations at FreeStatistics.org, Office for Research Development and Education, URL https://freestatistics.org/blog/index.php?v=date/2017/Jan/23/t1485165614svekqs99hrff4s3.htm/, Retrieved Wed, 15 May 2024 12:07:14 +0200
Statistical Computations at FreeStatistics.org, Office for Research Development and Education, URL https://freestatistics.org/blog/index.php?pk=, Retrieved Wed, 15 May 2024 12:07:14 +0200
QR Codes:

Original text written by user:
IsPrivate?No (this computation is public)
User-defined keywords
Estimated Impact0
Dataseries X:
14 22 4
19 24 5
17 21 4
17 21 3
15 24 4
20 20 3
15 22 3
19 20 3
15 19 4
15 23 4
19 21 4
NA 19 4
20 19 4
18 21 3
15 21 4
14 22 3
20 22 3
NA 19 NA
16 21 5
16 21 4
16 21 3
10 20 4
19 22 4
19 22 4
16 24 4
15 21 3
18 19 3
17 19 4
19 23 2
17 21 5
NA 21 4
19 19 4
20 21 5
5 19 4
19 21 2
16 21 4
15 23 3
16 19 4
18 19 4
16 19 4
15 18 5
17 22 4
NA 18 3
20 22 5
19 18 5
7 22 4
13 22 4
16 19 3
16 22 4
NA 25 2
18 19 4
18 19 5
16 19 5
17 19 4
19 21 4
16 21 4
19 20 3
13 19 3
16 19 4
13 22 4
12 26 5
17 19 2
17 21 4
17 21 3
16 20 4
16 23 4
14 22 4
16 22 4
13 22 5
16 21 3
14 21 3
20 22 4
12 23 4
13 18 4
18 24 4
14 22 3
19 21 4
18 21 3
14 21 3
18 23 4
19 21 4
15 23 3
14 21 4
17 19 4
19 21 4
13 21 5
19 21 5
18 23 4
20 23 3
15 20 3
15 20 4
15 19 4
20 23 4
15 22 4
19 19 4
18 23 3
18 22 4
15 22 5
20 21 5
17 21 4
12 21 3
18 21 5
19 22 4
20 25 5
NA 21 3
17 23 5
15 19 4
16 22 4
18 20 4
18 21 4
14 25 3
15 21 4
12 19 4
17 23 3
14 22 4
18 21 3
17 24 4
17 21 5
20 19 5
16 18 4
14 19 4
15 20 3
18 19 4
20 22 4
17 21 4
17 22 3
17 24 4
17 28 4
15 19 3
17 18 4
18 23 3
17 19 4
20 23 5
15 19 2
16 22 3
15 21 4
18 19 5
11 22 NA
15 21 4
18 23 5
20 22 4
19 19 4
14 19 3
16 21 4
15 22 4
17 21 4
18 20 4
20 23 5
17 22 4
18 23 4
15 22 3
16 21 4
11 20 4
15 18 4
18 18 3
17 20 4
16 19 5
12 21 4
19 24 2
18 19 4
15 20 4
17 19 4
19 23 4
18 22 5
19 21 5
16 24 3
16 21 4
16 21 4
14 22 2


Summary of computational transaction
Raw Input view raw input (R code)
Raw Outputview raw output of R engine
Computing time10 seconds
R ServerBig Analytics Cloud Computing Center

\begin{tabular}{lllllllll}
\hline
Summary of computational transaction \tabularnewline
Raw Input view raw input (R code)  \tabularnewline
Raw Outputview raw output of R engine  \tabularnewline
Computing time10 seconds \tabularnewline
R ServerBig Analytics Cloud Computing Center \tabularnewline
\hline
\end{tabular}
%Source: https://freestatistics.org/blog/index.php?pk=&T=0

[TABLE]
[ROW]
Summary of computational transaction[/C][/ROW] [ROW]Raw Input[/C] view raw input (R code) [/C][/ROW] [ROW]Raw Output[/C]view raw output of R engine [/C][/ROW] [ROW]Computing time[/C]10 seconds[/C][/ROW] [ROW]R Server[/C]Big Analytics Cloud Computing Center[/C][/ROW] [/TABLE] Source: https://freestatistics.org/blog/index.php?pk=&T=0

Globally Unique Identifier (entire table): ba.freestatistics.org/blog/index.php?pk=&T=0

As an alternative you can also use a QR Code:  

The GUIDs for individual cells are displayed in the table below:

Summary of computational transaction
Raw Input view raw input (R code)
Raw Outputview raw output of R engine
Computing time10 seconds
R ServerBig Analytics Cloud Computing Center


Multiple Linear Regression - Estimated Regression Equation
ITHSUM[t] = + 12.9224 + 0.106669Bevr_Leeftijd[t] + 0.339309SKEOU1[t] + e[t]

\begin{tabular}{lllllllll}
\hline
Multiple Linear Regression - Estimated Regression Equation \tabularnewline
ITHSUM[t] =  +  12.9224 +  0.106669Bevr_Leeftijd[t] +  0.339309SKEOU1[t]  + e[t] \tabularnewline
 \tabularnewline
\hline
\end{tabular}
%Source: https://freestatistics.org/blog/index.php?pk=&T=1

[TABLE]
[ROW][C]Multiple Linear Regression - Estimated Regression Equation[/C][/ROW]
[ROW][C]ITHSUM[t] =  +  12.9224 +  0.106669Bevr_Leeftijd[t] +  0.339309SKEOU1[t]  + e[t][/C][/ROW]
[ROW][C][/C][/ROW]
[/TABLE]
Source: https://freestatistics.org/blog/index.php?pk=&T=1

Globally Unique Identifier (entire table): ba.freestatistics.org/blog/index.php?pk=&T=1

As an alternative you can also use a QR Code:  

The GUIDs for individual cells are displayed in the table below:

Multiple Linear Regression - Estimated Regression Equation
ITHSUM[t] = + 12.9224 + 0.106669Bevr_Leeftijd[t] + 0.339309SKEOU1[t] + e[t]


Multiple Linear Regression - Ordinary Least Squares
VariableParameterS.D.T-STATH0: parameter = 02-tail p-value1-tail p-value
(Intercept)+12.92 2.568+5.0310e+00 1.304e-06 6.522e-07
Bevr_Leeftijd+0.1067 0.1106+9.6420e-01 0.3364 0.1682
SKEOU1+0.3393 0.2675+1.2680e+00 0.2065 0.1033

\begin{tabular}{lllllllll}
\hline
Multiple Linear Regression - Ordinary Least Squares \tabularnewline
Variable & Parameter & S.D. & T-STATH0: parameter = 0 & 2-tail p-value & 1-tail p-value \tabularnewline
(Intercept) & +12.92 &  2.568 & +5.0310e+00 &  1.304e-06 &  6.522e-07 \tabularnewline
Bevr_Leeftijd & +0.1067 &  0.1106 & +9.6420e-01 &  0.3364 &  0.1682 \tabularnewline
SKEOU1 & +0.3393 &  0.2675 & +1.2680e+00 &  0.2065 &  0.1033 \tabularnewline
\hline
\end{tabular}
%Source: https://freestatistics.org/blog/index.php?pk=&T=2

[TABLE]
[ROW][C]Multiple Linear Regression - Ordinary Least Squares[/C][/ROW]
[ROW][C]Variable[/C][C]Parameter[/C][C]S.D.[/C][C]T-STATH0: parameter = 0[/C][C]2-tail p-value[/C][C]1-tail p-value[/C][/ROW]
[ROW][C](Intercept)[/C][C]+12.92[/C][C] 2.568[/C][C]+5.0310e+00[/C][C] 1.304e-06[/C][C] 6.522e-07[/C][/ROW]
[ROW][C]Bevr_Leeftijd[/C][C]+0.1067[/C][C] 0.1106[/C][C]+9.6420e-01[/C][C] 0.3364[/C][C] 0.1682[/C][/ROW]
[ROW][C]SKEOU1[/C][C]+0.3393[/C][C] 0.2675[/C][C]+1.2680e+00[/C][C] 0.2065[/C][C] 0.1033[/C][/ROW]
[/TABLE]
Source: https://freestatistics.org/blog/index.php?pk=&T=2

Globally Unique Identifier (entire table): ba.freestatistics.org/blog/index.php?pk=&T=2

As an alternative you can also use a QR Code:  

The GUIDs for individual cells are displayed in the table below:

Multiple Linear Regression - Ordinary Least Squares
VariableParameterS.D.T-STATH0: parameter = 02-tail p-value1-tail p-value
(Intercept)+12.92 2.568+5.0310e+00 1.304e-06 6.522e-07
Bevr_Leeftijd+0.1067 0.1106+9.6420e-01 0.3364 0.1682
SKEOU1+0.3393 0.2675+1.2680e+00 0.2065 0.1033


Multiple Linear Regression - Regression Statistics
Multiple R 0.1247
R-squared 0.01555
Adjusted R-squared 0.003162
F-TEST (value) 1.255
F-TEST (DF numerator)2
F-TEST (DF denominator)159
p-value 0.2878
Multiple Linear Regression - Residual Statistics
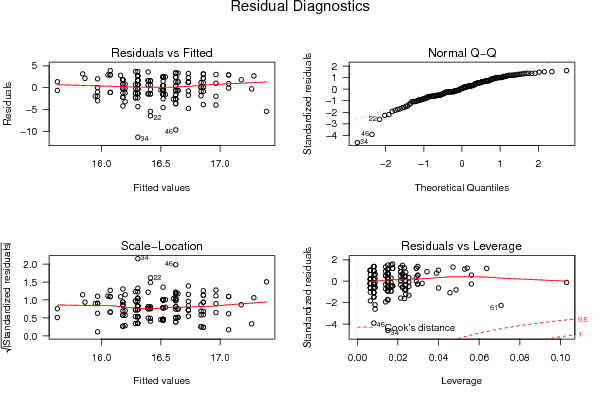
Residual Standard Deviation 2.466
Sum Squared Residuals 967.2

\begin{tabular}{lllllllll}
\hline
Multiple Linear Regression - Regression Statistics \tabularnewline
Multiple R &  0.1247 \tabularnewline
R-squared &  0.01555 \tabularnewline
Adjusted R-squared &  0.003162 \tabularnewline
F-TEST (value) &  1.255 \tabularnewline
F-TEST (DF numerator) & 2 \tabularnewline
F-TEST (DF denominator) & 159 \tabularnewline
p-value &  0.2878 \tabularnewline
Multiple Linear Regression - Residual Statistics \tabularnewline
Residual Standard Deviation &  2.466 \tabularnewline
Sum Squared Residuals &  967.2 \tabularnewline
\hline
\end{tabular}
%Source: https://freestatistics.org/blog/index.php?pk=&T=3

[TABLE]
[ROW][C]Multiple Linear Regression - Regression Statistics[/C][/ROW]
[ROW][C]Multiple R[/C][C] 0.1247[/C][/ROW]
[ROW][C]R-squared[/C][C] 0.01555[/C][/ROW]
[ROW][C]Adjusted R-squared[/C][C] 0.003162[/C][/ROW]
[ROW][C]F-TEST (value)[/C][C] 1.255[/C][/ROW]
[ROW][C]F-TEST (DF numerator)[/C][C]2[/C][/ROW]
[ROW][C]F-TEST (DF denominator)[/C][C]159[/C][/ROW]
[ROW][C]p-value[/C][C] 0.2878[/C][/ROW]
[ROW][C]Multiple Linear Regression - Residual Statistics[/C][/ROW]
[ROW][C]Residual Standard Deviation[/C][C] 2.466[/C][/ROW]
[ROW][C]Sum Squared Residuals[/C][C] 967.2[/C][/ROW]
[/TABLE]
Source: https://freestatistics.org/blog/index.php?pk=&T=3

Globally Unique Identifier (entire table): ba.freestatistics.org/blog/index.php?pk=&T=3

As an alternative you can also use a QR Code:  

The GUIDs for individual cells are displayed in the table below:

Multiple Linear Regression - Regression Statistics
Multiple R 0.1247
R-squared 0.01555
Adjusted R-squared 0.003162
F-TEST (value) 1.255
F-TEST (DF numerator)2
F-TEST (DF denominator)159
p-value 0.2878
Multiple Linear Regression - Residual Statistics
Residual Standard Deviation 2.466
Sum Squared Residuals 967.2


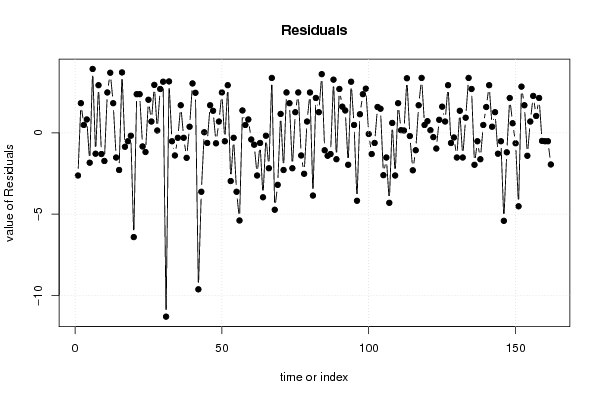
Multiple Linear Regression - Actuals, Interpolation, and Residuals
Time or IndexActualsInterpolationForecastResidualsPrediction Error
1 14 16.63-2.626
2 19 17.18 1.821
3 17 16.52 0.4803
4 17 16.18 0.8196
5 15 16.84-1.84
6 20 16.07 3.926
7 15 16.29-1.287
8 19 16.07 2.926
9 15 16.31-1.306
10 15 16.73-1.733
11 19 16.52 2.48
12 20 16.31 3.694
13 18 16.18 1.82
14 15 16.52-1.52
15 14 16.29-2.287
16 20 16.29 3.713
17 16 16.86-0.859
18 16 16.52-0.5197
19 16 16.18-0.1804
20 10 16.41-6.413
21 19 16.63 2.374
22 19 16.63 2.374
23 16 16.84-0.8397
24 15 16.18-1.18
25 18 15.97 2.033
26 17 16.31 0.6937
27 19 16.05 2.946
28 17 16.86 0.141
29 19 16.31 2.694
30 20 16.86 3.141
31 5 16.31-11.31
32 19 15.84 3.159
33 16 16.52-0.5197
34 15 16.39-1.394
35 16 16.31-0.3063
36 18 16.31 1.694
37 16 16.31-0.3063
38 15 16.54-1.539
39 17 16.63 0.3737
40 20 16.97 3.034
41 19 16.54 2.461
42 7 16.63-9.626
43 13 16.63-3.626
44 16 15.97 0.03299
45 16 16.63-0.6263
46 18 16.31 1.694
47 18 16.65 1.354
48 16 16.65-0.6456
49 17 16.31 0.6937
50 19 16.52 2.48
51 16 16.52-0.5197
52 19 16.07 2.926
53 13 15.97-2.967
54 16 16.31-0.3063
55 13 16.63-3.626
56 12 17.39-5.392
57 17 15.63 1.372
58 17 16.52 0.4803
59 17 16.18 0.8196
60 16 16.41-0.413
61 16 16.73-0.733
62 14 16.63-2.626
63 16 16.63-0.6263
64 13 16.97-3.966
65 16 16.18-0.1804
66 14 16.18-2.18
67 20 16.63 3.374
68 12 16.73-4.733
69 13 16.2-3.2
70 18 16.84 1.16
71 14 16.29-2.287
72 19 16.52 2.48
73 18 16.18 1.82
74 14 16.18-2.18
75 18 16.73 1.267
76 19 16.52 2.48
77 15 16.39-1.394
78 14 16.52-2.52
79 17 16.31 0.6937
80 19 16.52 2.48
81 13 16.86-3.859
82 19 16.86 2.141
83 18 16.73 1.267
84 20 16.39 3.606
85 15 16.07-1.074
86 15 16.41-1.413
87 15 16.31-1.306
88 20 16.73 3.267
89 15 16.63-1.626
90 19 16.31 2.694
91 18 16.39 1.606
92 18 16.63 1.374
93 15 16.97-1.966
94 20 16.86 3.141
95 17 16.52 0.4803
96 12 16.18-4.18
97 18 16.86 1.141
98 19 16.63 2.374
99 20 17.29 2.714
100 17 17.07-0.07231
101 15 16.31-1.306
102 16 16.63-0.6263
103 18 16.41 1.587
104 18 16.52 1.48
105 14 16.61-2.607
106 15 16.52-1.52
107 12 16.31-4.306
108 17 16.39 0.6063
109 14 16.63-2.626
110 18 16.18 1.82
111 17 16.84 0.1603
112 17 16.86 0.141
113 20 16.65 3.354
114 16 16.2-0.1997
115 14 16.31-2.306
116 15 16.07-1.074
117 18 16.31 1.694
118 20 16.63 3.374
119 17 16.52 0.4803
120 17 16.29 0.713
121 17 16.84 0.1603
122 17 17.27-0.2663
123 15 15.97-0.967
124 17 16.2 0.8003
125 18 16.39 1.606
126 17 16.31 0.6937
127 20 17.07 2.928
128 15 15.63-0.6277
129 16 16.29-0.287
130 15 16.52-1.52
131 18 16.65 1.354
132 15 16.52-1.52
133 18 17.07 0.9277
134 20 16.63 3.374
135 19 16.31 2.694
136 14 15.97-1.967
137 16 16.52-0.5197
138 15 16.63-1.626
139 17 16.52 0.4803
140 18 16.41 1.587
141 20 17.07 2.928
142 17 16.63 0.3737
143 18 16.73 1.267
144 15 16.29-1.287
145 16 16.52-0.5197
146 11 16.41-5.413
147 15 16.2-1.2
148 18 15.86 2.14
149 17 16.41 0.587
150 16 16.65-0.6456
151 12 16.52-4.52
152 19 16.16 2.839
153 18 16.31 1.694
154 15 16.41-1.413
155 17 16.31 0.6937
156 19 16.73 2.267
157 18 16.97 1.034
158 19 16.86 2.141
159 16 16.5-0.5004
160 16 16.52-0.5197
161 16 16.52-0.5197
162 14 15.95-1.948

\begin{tabular}{lllllllll}
\hline
Multiple Linear Regression - Actuals, Interpolation, and Residuals \tabularnewline
Time or Index & Actuals & InterpolationForecast & ResidualsPrediction Error \tabularnewline
1 &  14 &  16.63 & -2.626 \tabularnewline
2 &  19 &  17.18 &  1.821 \tabularnewline
3 &  17 &  16.52 &  0.4803 \tabularnewline
4 &  17 &  16.18 &  0.8196 \tabularnewline
5 &  15 &  16.84 & -1.84 \tabularnewline
6 &  20 &  16.07 &  3.926 \tabularnewline
7 &  15 &  16.29 & -1.287 \tabularnewline
8 &  19 &  16.07 &  2.926 \tabularnewline
9 &  15 &  16.31 & -1.306 \tabularnewline
10 &  15 &  16.73 & -1.733 \tabularnewline
11 &  19 &  16.52 &  2.48 \tabularnewline
12 &  20 &  16.31 &  3.694 \tabularnewline
13 &  18 &  16.18 &  1.82 \tabularnewline
14 &  15 &  16.52 & -1.52 \tabularnewline
15 &  14 &  16.29 & -2.287 \tabularnewline
16 &  20 &  16.29 &  3.713 \tabularnewline
17 &  16 &  16.86 & -0.859 \tabularnewline
18 &  16 &  16.52 & -0.5197 \tabularnewline
19 &  16 &  16.18 & -0.1804 \tabularnewline
20 &  10 &  16.41 & -6.413 \tabularnewline
21 &  19 &  16.63 &  2.374 \tabularnewline
22 &  19 &  16.63 &  2.374 \tabularnewline
23 &  16 &  16.84 & -0.8397 \tabularnewline
24 &  15 &  16.18 & -1.18 \tabularnewline
25 &  18 &  15.97 &  2.033 \tabularnewline
26 &  17 &  16.31 &  0.6937 \tabularnewline
27 &  19 &  16.05 &  2.946 \tabularnewline
28 &  17 &  16.86 &  0.141 \tabularnewline
29 &  19 &  16.31 &  2.694 \tabularnewline
30 &  20 &  16.86 &  3.141 \tabularnewline
31 &  5 &  16.31 & -11.31 \tabularnewline
32 &  19 &  15.84 &  3.159 \tabularnewline
33 &  16 &  16.52 & -0.5197 \tabularnewline
34 &  15 &  16.39 & -1.394 \tabularnewline
35 &  16 &  16.31 & -0.3063 \tabularnewline
36 &  18 &  16.31 &  1.694 \tabularnewline
37 &  16 &  16.31 & -0.3063 \tabularnewline
38 &  15 &  16.54 & -1.539 \tabularnewline
39 &  17 &  16.63 &  0.3737 \tabularnewline
40 &  20 &  16.97 &  3.034 \tabularnewline
41 &  19 &  16.54 &  2.461 \tabularnewline
42 &  7 &  16.63 & -9.626 \tabularnewline
43 &  13 &  16.63 & -3.626 \tabularnewline
44 &  16 &  15.97 &  0.03299 \tabularnewline
45 &  16 &  16.63 & -0.6263 \tabularnewline
46 &  18 &  16.31 &  1.694 \tabularnewline
47 &  18 &  16.65 &  1.354 \tabularnewline
48 &  16 &  16.65 & -0.6456 \tabularnewline
49 &  17 &  16.31 &  0.6937 \tabularnewline
50 &  19 &  16.52 &  2.48 \tabularnewline
51 &  16 &  16.52 & -0.5197 \tabularnewline
52 &  19 &  16.07 &  2.926 \tabularnewline
53 &  13 &  15.97 & -2.967 \tabularnewline
54 &  16 &  16.31 & -0.3063 \tabularnewline
55 &  13 &  16.63 & -3.626 \tabularnewline
56 &  12 &  17.39 & -5.392 \tabularnewline
57 &  17 &  15.63 &  1.372 \tabularnewline
58 &  17 &  16.52 &  0.4803 \tabularnewline
59 &  17 &  16.18 &  0.8196 \tabularnewline
60 &  16 &  16.41 & -0.413 \tabularnewline
61 &  16 &  16.73 & -0.733 \tabularnewline
62 &  14 &  16.63 & -2.626 \tabularnewline
63 &  16 &  16.63 & -0.6263 \tabularnewline
64 &  13 &  16.97 & -3.966 \tabularnewline
65 &  16 &  16.18 & -0.1804 \tabularnewline
66 &  14 &  16.18 & -2.18 \tabularnewline
67 &  20 &  16.63 &  3.374 \tabularnewline
68 &  12 &  16.73 & -4.733 \tabularnewline
69 &  13 &  16.2 & -3.2 \tabularnewline
70 &  18 &  16.84 &  1.16 \tabularnewline
71 &  14 &  16.29 & -2.287 \tabularnewline
72 &  19 &  16.52 &  2.48 \tabularnewline
73 &  18 &  16.18 &  1.82 \tabularnewline
74 &  14 &  16.18 & -2.18 \tabularnewline
75 &  18 &  16.73 &  1.267 \tabularnewline
76 &  19 &  16.52 &  2.48 \tabularnewline
77 &  15 &  16.39 & -1.394 \tabularnewline
78 &  14 &  16.52 & -2.52 \tabularnewline
79 &  17 &  16.31 &  0.6937 \tabularnewline
80 &  19 &  16.52 &  2.48 \tabularnewline
81 &  13 &  16.86 & -3.859 \tabularnewline
82 &  19 &  16.86 &  2.141 \tabularnewline
83 &  18 &  16.73 &  1.267 \tabularnewline
84 &  20 &  16.39 &  3.606 \tabularnewline
85 &  15 &  16.07 & -1.074 \tabularnewline
86 &  15 &  16.41 & -1.413 \tabularnewline
87 &  15 &  16.31 & -1.306 \tabularnewline
88 &  20 &  16.73 &  3.267 \tabularnewline
89 &  15 &  16.63 & -1.626 \tabularnewline
90 &  19 &  16.31 &  2.694 \tabularnewline
91 &  18 &  16.39 &  1.606 \tabularnewline
92 &  18 &  16.63 &  1.374 \tabularnewline
93 &  15 &  16.97 & -1.966 \tabularnewline
94 &  20 &  16.86 &  3.141 \tabularnewline
95 &  17 &  16.52 &  0.4803 \tabularnewline
96 &  12 &  16.18 & -4.18 \tabularnewline
97 &  18 &  16.86 &  1.141 \tabularnewline
98 &  19 &  16.63 &  2.374 \tabularnewline
99 &  20 &  17.29 &  2.714 \tabularnewline
100 &  17 &  17.07 & -0.07231 \tabularnewline
101 &  15 &  16.31 & -1.306 \tabularnewline
102 &  16 &  16.63 & -0.6263 \tabularnewline
103 &  18 &  16.41 &  1.587 \tabularnewline
104 &  18 &  16.52 &  1.48 \tabularnewline
105 &  14 &  16.61 & -2.607 \tabularnewline
106 &  15 &  16.52 & -1.52 \tabularnewline
107 &  12 &  16.31 & -4.306 \tabularnewline
108 &  17 &  16.39 &  0.6063 \tabularnewline
109 &  14 &  16.63 & -2.626 \tabularnewline
110 &  18 &  16.18 &  1.82 \tabularnewline
111 &  17 &  16.84 &  0.1603 \tabularnewline
112 &  17 &  16.86 &  0.141 \tabularnewline
113 &  20 &  16.65 &  3.354 \tabularnewline
114 &  16 &  16.2 & -0.1997 \tabularnewline
115 &  14 &  16.31 & -2.306 \tabularnewline
116 &  15 &  16.07 & -1.074 \tabularnewline
117 &  18 &  16.31 &  1.694 \tabularnewline
118 &  20 &  16.63 &  3.374 \tabularnewline
119 &  17 &  16.52 &  0.4803 \tabularnewline
120 &  17 &  16.29 &  0.713 \tabularnewline
121 &  17 &  16.84 &  0.1603 \tabularnewline
122 &  17 &  17.27 & -0.2663 \tabularnewline
123 &  15 &  15.97 & -0.967 \tabularnewline
124 &  17 &  16.2 &  0.8003 \tabularnewline
125 &  18 &  16.39 &  1.606 \tabularnewline
126 &  17 &  16.31 &  0.6937 \tabularnewline
127 &  20 &  17.07 &  2.928 \tabularnewline
128 &  15 &  15.63 & -0.6277 \tabularnewline
129 &  16 &  16.29 & -0.287 \tabularnewline
130 &  15 &  16.52 & -1.52 \tabularnewline
131 &  18 &  16.65 &  1.354 \tabularnewline
132 &  15 &  16.52 & -1.52 \tabularnewline
133 &  18 &  17.07 &  0.9277 \tabularnewline
134 &  20 &  16.63 &  3.374 \tabularnewline
135 &  19 &  16.31 &  2.694 \tabularnewline
136 &  14 &  15.97 & -1.967 \tabularnewline
137 &  16 &  16.52 & -0.5197 \tabularnewline
138 &  15 &  16.63 & -1.626 \tabularnewline
139 &  17 &  16.52 &  0.4803 \tabularnewline
140 &  18 &  16.41 &  1.587 \tabularnewline
141 &  20 &  17.07 &  2.928 \tabularnewline
142 &  17 &  16.63 &  0.3737 \tabularnewline
143 &  18 &  16.73 &  1.267 \tabularnewline
144 &  15 &  16.29 & -1.287 \tabularnewline
145 &  16 &  16.52 & -0.5197 \tabularnewline
146 &  11 &  16.41 & -5.413 \tabularnewline
147 &  15 &  16.2 & -1.2 \tabularnewline
148 &  18 &  15.86 &  2.14 \tabularnewline
149 &  17 &  16.41 &  0.587 \tabularnewline
150 &  16 &  16.65 & -0.6456 \tabularnewline
151 &  12 &  16.52 & -4.52 \tabularnewline
152 &  19 &  16.16 &  2.839 \tabularnewline
153 &  18 &  16.31 &  1.694 \tabularnewline
154 &  15 &  16.41 & -1.413 \tabularnewline
155 &  17 &  16.31 &  0.6937 \tabularnewline
156 &  19 &  16.73 &  2.267 \tabularnewline
157 &  18 &  16.97 &  1.034 \tabularnewline
158 &  19 &  16.86 &  2.141 \tabularnewline
159 &  16 &  16.5 & -0.5004 \tabularnewline
160 &  16 &  16.52 & -0.5197 \tabularnewline
161 &  16 &  16.52 & -0.5197 \tabularnewline
162 &  14 &  15.95 & -1.948 \tabularnewline
\hline
\end{tabular}
%Source: https://freestatistics.org/blog/index.php?pk=&T=4

[TABLE]
[ROW][C]Multiple Linear Regression - Actuals, Interpolation, and Residuals[/C][/ROW]
[ROW][C]Time or Index[/C][C]Actuals[/C][C]InterpolationForecast[/C][C]ResidualsPrediction Error[/C][/ROW]
[ROW][C]1[/C][C] 14[/C][C] 16.63[/C][C]-2.626[/C][/ROW]
[ROW][C]2[/C][C] 19[/C][C] 17.18[/C][C] 1.821[/C][/ROW]
[ROW][C]3[/C][C] 17[/C][C] 16.52[/C][C] 0.4803[/C][/ROW]
[ROW][C]4[/C][C] 17[/C][C] 16.18[/C][C] 0.8196[/C][/ROW]
[ROW][C]5[/C][C] 15[/C][C] 16.84[/C][C]-1.84[/C][/ROW]
[ROW][C]6[/C][C] 20[/C][C] 16.07[/C][C] 3.926[/C][/ROW]
[ROW][C]7[/C][C] 15[/C][C] 16.29[/C][C]-1.287[/C][/ROW]
[ROW][C]8[/C][C] 19[/C][C] 16.07[/C][C] 2.926[/C][/ROW]
[ROW][C]9[/C][C] 15[/C][C] 16.31[/C][C]-1.306[/C][/ROW]
[ROW][C]10[/C][C] 15[/C][C] 16.73[/C][C]-1.733[/C][/ROW]
[ROW][C]11[/C][C] 19[/C][C] 16.52[/C][C] 2.48[/C][/ROW]
[ROW][C]12[/C][C] 20[/C][C] 16.31[/C][C] 3.694[/C][/ROW]
[ROW][C]13[/C][C] 18[/C][C] 16.18[/C][C] 1.82[/C][/ROW]
[ROW][C]14[/C][C] 15[/C][C] 16.52[/C][C]-1.52[/C][/ROW]
[ROW][C]15[/C][C] 14[/C][C] 16.29[/C][C]-2.287[/C][/ROW]
[ROW][C]16[/C][C] 20[/C][C] 16.29[/C][C] 3.713[/C][/ROW]
[ROW][C]17[/C][C] 16[/C][C] 16.86[/C][C]-0.859[/C][/ROW]
[ROW][C]18[/C][C] 16[/C][C] 16.52[/C][C]-0.5197[/C][/ROW]
[ROW][C]19[/C][C] 16[/C][C] 16.18[/C][C]-0.1804[/C][/ROW]
[ROW][C]20[/C][C] 10[/C][C] 16.41[/C][C]-6.413[/C][/ROW]
[ROW][C]21[/C][C] 19[/C][C] 16.63[/C][C] 2.374[/C][/ROW]
[ROW][C]22[/C][C] 19[/C][C] 16.63[/C][C] 2.374[/C][/ROW]
[ROW][C]23[/C][C] 16[/C][C] 16.84[/C][C]-0.8397[/C][/ROW]
[ROW][C]24[/C][C] 15[/C][C] 16.18[/C][C]-1.18[/C][/ROW]
[ROW][C]25[/C][C] 18[/C][C] 15.97[/C][C] 2.033[/C][/ROW]
[ROW][C]26[/C][C] 17[/C][C] 16.31[/C][C] 0.6937[/C][/ROW]
[ROW][C]27[/C][C] 19[/C][C] 16.05[/C][C] 2.946[/C][/ROW]
[ROW][C]28[/C][C] 17[/C][C] 16.86[/C][C] 0.141[/C][/ROW]
[ROW][C]29[/C][C] 19[/C][C] 16.31[/C][C] 2.694[/C][/ROW]
[ROW][C]30[/C][C] 20[/C][C] 16.86[/C][C] 3.141[/C][/ROW]
[ROW][C]31[/C][C] 5[/C][C] 16.31[/C][C]-11.31[/C][/ROW]
[ROW][C]32[/C][C] 19[/C][C] 15.84[/C][C] 3.159[/C][/ROW]
[ROW][C]33[/C][C] 16[/C][C] 16.52[/C][C]-0.5197[/C][/ROW]
[ROW][C]34[/C][C] 15[/C][C] 16.39[/C][C]-1.394[/C][/ROW]
[ROW][C]35[/C][C] 16[/C][C] 16.31[/C][C]-0.3063[/C][/ROW]
[ROW][C]36[/C][C] 18[/C][C] 16.31[/C][C] 1.694[/C][/ROW]
[ROW][C]37[/C][C] 16[/C][C] 16.31[/C][C]-0.3063[/C][/ROW]
[ROW][C]38[/C][C] 15[/C][C] 16.54[/C][C]-1.539[/C][/ROW]
[ROW][C]39[/C][C] 17[/C][C] 16.63[/C][C] 0.3737[/C][/ROW]
[ROW][C]40[/C][C] 20[/C][C] 16.97[/C][C] 3.034[/C][/ROW]
[ROW][C]41[/C][C] 19[/C][C] 16.54[/C][C] 2.461[/C][/ROW]
[ROW][C]42[/C][C] 7[/C][C] 16.63[/C][C]-9.626[/C][/ROW]
[ROW][C]43[/C][C] 13[/C][C] 16.63[/C][C]-3.626[/C][/ROW]
[ROW][C]44[/C][C] 16[/C][C] 15.97[/C][C] 0.03299[/C][/ROW]
[ROW][C]45[/C][C] 16[/C][C] 16.63[/C][C]-0.6263[/C][/ROW]
[ROW][C]46[/C][C] 18[/C][C] 16.31[/C][C] 1.694[/C][/ROW]
[ROW][C]47[/C][C] 18[/C][C] 16.65[/C][C] 1.354[/C][/ROW]
[ROW][C]48[/C][C] 16[/C][C] 16.65[/C][C]-0.6456[/C][/ROW]
[ROW][C]49[/C][C] 17[/C][C] 16.31[/C][C] 0.6937[/C][/ROW]
[ROW][C]50[/C][C] 19[/C][C] 16.52[/C][C] 2.48[/C][/ROW]
[ROW][C]51[/C][C] 16[/C][C] 16.52[/C][C]-0.5197[/C][/ROW]
[ROW][C]52[/C][C] 19[/C][C] 16.07[/C][C] 2.926[/C][/ROW]
[ROW][C]53[/C][C] 13[/C][C] 15.97[/C][C]-2.967[/C][/ROW]
[ROW][C]54[/C][C] 16[/C][C] 16.31[/C][C]-0.3063[/C][/ROW]
[ROW][C]55[/C][C] 13[/C][C] 16.63[/C][C]-3.626[/C][/ROW]
[ROW][C]56[/C][C] 12[/C][C] 17.39[/C][C]-5.392[/C][/ROW]
[ROW][C]57[/C][C] 17[/C][C] 15.63[/C][C] 1.372[/C][/ROW]
[ROW][C]58[/C][C] 17[/C][C] 16.52[/C][C] 0.4803[/C][/ROW]
[ROW][C]59[/C][C] 17[/C][C] 16.18[/C][C] 0.8196[/C][/ROW]
[ROW][C]60[/C][C] 16[/C][C] 16.41[/C][C]-0.413[/C][/ROW]
[ROW][C]61[/C][C] 16[/C][C] 16.73[/C][C]-0.733[/C][/ROW]
[ROW][C]62[/C][C] 14[/C][C] 16.63[/C][C]-2.626[/C][/ROW]
[ROW][C]63[/C][C] 16[/C][C] 16.63[/C][C]-0.6263[/C][/ROW]
[ROW][C]64[/C][C] 13[/C][C] 16.97[/C][C]-3.966[/C][/ROW]
[ROW][C]65[/C][C] 16[/C][C] 16.18[/C][C]-0.1804[/C][/ROW]
[ROW][C]66[/C][C] 14[/C][C] 16.18[/C][C]-2.18[/C][/ROW]
[ROW][C]67[/C][C] 20[/C][C] 16.63[/C][C] 3.374[/C][/ROW]
[ROW][C]68[/C][C] 12[/C][C] 16.73[/C][C]-4.733[/C][/ROW]
[ROW][C]69[/C][C] 13[/C][C] 16.2[/C][C]-3.2[/C][/ROW]
[ROW][C]70[/C][C] 18[/C][C] 16.84[/C][C] 1.16[/C][/ROW]
[ROW][C]71[/C][C] 14[/C][C] 16.29[/C][C]-2.287[/C][/ROW]
[ROW][C]72[/C][C] 19[/C][C] 16.52[/C][C] 2.48[/C][/ROW]
[ROW][C]73[/C][C] 18[/C][C] 16.18[/C][C] 1.82[/C][/ROW]
[ROW][C]74[/C][C] 14[/C][C] 16.18[/C][C]-2.18[/C][/ROW]
[ROW][C]75[/C][C] 18[/C][C] 16.73[/C][C] 1.267[/C][/ROW]
[ROW][C]76[/C][C] 19[/C][C] 16.52[/C][C] 2.48[/C][/ROW]
[ROW][C]77[/C][C] 15[/C][C] 16.39[/C][C]-1.394[/C][/ROW]
[ROW][C]78[/C][C] 14[/C][C] 16.52[/C][C]-2.52[/C][/ROW]
[ROW][C]79[/C][C] 17[/C][C] 16.31[/C][C] 0.6937[/C][/ROW]
[ROW][C]80[/C][C] 19[/C][C] 16.52[/C][C] 2.48[/C][/ROW]
[ROW][C]81[/C][C] 13[/C][C] 16.86[/C][C]-3.859[/C][/ROW]
[ROW][C]82[/C][C] 19[/C][C] 16.86[/C][C] 2.141[/C][/ROW]
[ROW][C]83[/C][C] 18[/C][C] 16.73[/C][C] 1.267[/C][/ROW]
[ROW][C]84[/C][C] 20[/C][C] 16.39[/C][C] 3.606[/C][/ROW]
[ROW][C]85[/C][C] 15[/C][C] 16.07[/C][C]-1.074[/C][/ROW]
[ROW][C]86[/C][C] 15[/C][C] 16.41[/C][C]-1.413[/C][/ROW]
[ROW][C]87[/C][C] 15[/C][C] 16.31[/C][C]-1.306[/C][/ROW]
[ROW][C]88[/C][C] 20[/C][C] 16.73[/C][C] 3.267[/C][/ROW]
[ROW][C]89[/C][C] 15[/C][C] 16.63[/C][C]-1.626[/C][/ROW]
[ROW][C]90[/C][C] 19[/C][C] 16.31[/C][C] 2.694[/C][/ROW]
[ROW][C]91[/C][C] 18[/C][C] 16.39[/C][C] 1.606[/C][/ROW]
[ROW][C]92[/C][C] 18[/C][C] 16.63[/C][C] 1.374[/C][/ROW]
[ROW][C]93[/C][C] 15[/C][C] 16.97[/C][C]-1.966[/C][/ROW]
[ROW][C]94[/C][C] 20[/C][C] 16.86[/C][C] 3.141[/C][/ROW]
[ROW][C]95[/C][C] 17[/C][C] 16.52[/C][C] 0.4803[/C][/ROW]
[ROW][C]96[/C][C] 12[/C][C] 16.18[/C][C]-4.18[/C][/ROW]
[ROW][C]97[/C][C] 18[/C][C] 16.86[/C][C] 1.141[/C][/ROW]
[ROW][C]98[/C][C] 19[/C][C] 16.63[/C][C] 2.374[/C][/ROW]
[ROW][C]99[/C][C] 20[/C][C] 17.29[/C][C] 2.714[/C][/ROW]
[ROW][C]100[/C][C] 17[/C][C] 17.07[/C][C]-0.07231[/C][/ROW]
[ROW][C]101[/C][C] 15[/C][C] 16.31[/C][C]-1.306[/C][/ROW]
[ROW][C]102[/C][C] 16[/C][C] 16.63[/C][C]-0.6263[/C][/ROW]
[ROW][C]103[/C][C] 18[/C][C] 16.41[/C][C] 1.587[/C][/ROW]
[ROW][C]104[/C][C] 18[/C][C] 16.52[/C][C] 1.48[/C][/ROW]
[ROW][C]105[/C][C] 14[/C][C] 16.61[/C][C]-2.607[/C][/ROW]
[ROW][C]106[/C][C] 15[/C][C] 16.52[/C][C]-1.52[/C][/ROW]
[ROW][C]107[/C][C] 12[/C][C] 16.31[/C][C]-4.306[/C][/ROW]
[ROW][C]108[/C][C] 17[/C][C] 16.39[/C][C] 0.6063[/C][/ROW]
[ROW][C]109[/C][C] 14[/C][C] 16.63[/C][C]-2.626[/C][/ROW]
[ROW][C]110[/C][C] 18[/C][C] 16.18[/C][C] 1.82[/C][/ROW]
[ROW][C]111[/C][C] 17[/C][C] 16.84[/C][C] 0.1603[/C][/ROW]
[ROW][C]112[/C][C] 17[/C][C] 16.86[/C][C] 0.141[/C][/ROW]
[ROW][C]113[/C][C] 20[/C][C] 16.65[/C][C] 3.354[/C][/ROW]
[ROW][C]114[/C][C] 16[/C][C] 16.2[/C][C]-0.1997[/C][/ROW]
[ROW][C]115[/C][C] 14[/C][C] 16.31[/C][C]-2.306[/C][/ROW]
[ROW][C]116[/C][C] 15[/C][C] 16.07[/C][C]-1.074[/C][/ROW]
[ROW][C]117[/C][C] 18[/C][C] 16.31[/C][C] 1.694[/C][/ROW]
[ROW][C]118[/C][C] 20[/C][C] 16.63[/C][C] 3.374[/C][/ROW]
[ROW][C]119[/C][C] 17[/C][C] 16.52[/C][C] 0.4803[/C][/ROW]
[ROW][C]120[/C][C] 17[/C][C] 16.29[/C][C] 0.713[/C][/ROW]
[ROW][C]121[/C][C] 17[/C][C] 16.84[/C][C] 0.1603[/C][/ROW]
[ROW][C]122[/C][C] 17[/C][C] 17.27[/C][C]-0.2663[/C][/ROW]
[ROW][C]123[/C][C] 15[/C][C] 15.97[/C][C]-0.967[/C][/ROW]
[ROW][C]124[/C][C] 17[/C][C] 16.2[/C][C] 0.8003[/C][/ROW]
[ROW][C]125[/C][C] 18[/C][C] 16.39[/C][C] 1.606[/C][/ROW]
[ROW][C]126[/C][C] 17[/C][C] 16.31[/C][C] 0.6937[/C][/ROW]
[ROW][C]127[/C][C] 20[/C][C] 17.07[/C][C] 2.928[/C][/ROW]
[ROW][C]128[/C][C] 15[/C][C] 15.63[/C][C]-0.6277[/C][/ROW]
[ROW][C]129[/C][C] 16[/C][C] 16.29[/C][C]-0.287[/C][/ROW]
[ROW][C]130[/C][C] 15[/C][C] 16.52[/C][C]-1.52[/C][/ROW]
[ROW][C]131[/C][C] 18[/C][C] 16.65[/C][C] 1.354[/C][/ROW]
[ROW][C]132[/C][C] 15[/C][C] 16.52[/C][C]-1.52[/C][/ROW]
[ROW][C]133[/C][C] 18[/C][C] 17.07[/C][C] 0.9277[/C][/ROW]
[ROW][C]134[/C][C] 20[/C][C] 16.63[/C][C] 3.374[/C][/ROW]
[ROW][C]135[/C][C] 19[/C][C] 16.31[/C][C] 2.694[/C][/ROW]
[ROW][C]136[/C][C] 14[/C][C] 15.97[/C][C]-1.967[/C][/ROW]
[ROW][C]137[/C][C] 16[/C][C] 16.52[/C][C]-0.5197[/C][/ROW]
[ROW][C]138[/C][C] 15[/C][C] 16.63[/C][C]-1.626[/C][/ROW]
[ROW][C]139[/C][C] 17[/C][C] 16.52[/C][C] 0.4803[/C][/ROW]
[ROW][C]140[/C][C] 18[/C][C] 16.41[/C][C] 1.587[/C][/ROW]
[ROW][C]141[/C][C] 20[/C][C] 17.07[/C][C] 2.928[/C][/ROW]
[ROW][C]142[/C][C] 17[/C][C] 16.63[/C][C] 0.3737[/C][/ROW]
[ROW][C]143[/C][C] 18[/C][C] 16.73[/C][C] 1.267[/C][/ROW]
[ROW][C]144[/C][C] 15[/C][C] 16.29[/C][C]-1.287[/C][/ROW]
[ROW][C]145[/C][C] 16[/C][C] 16.52[/C][C]-0.5197[/C][/ROW]
[ROW][C]146[/C][C] 11[/C][C] 16.41[/C][C]-5.413[/C][/ROW]
[ROW][C]147[/C][C] 15[/C][C] 16.2[/C][C]-1.2[/C][/ROW]
[ROW][C]148[/C][C] 18[/C][C] 15.86[/C][C] 2.14[/C][/ROW]
[ROW][C]149[/C][C] 17[/C][C] 16.41[/C][C] 0.587[/C][/ROW]
[ROW][C]150[/C][C] 16[/C][C] 16.65[/C][C]-0.6456[/C][/ROW]
[ROW][C]151[/C][C] 12[/C][C] 16.52[/C][C]-4.52[/C][/ROW]
[ROW][C]152[/C][C] 19[/C][C] 16.16[/C][C] 2.839[/C][/ROW]
[ROW][C]153[/C][C] 18[/C][C] 16.31[/C][C] 1.694[/C][/ROW]
[ROW][C]154[/C][C] 15[/C][C] 16.41[/C][C]-1.413[/C][/ROW]
[ROW][C]155[/C][C] 17[/C][C] 16.31[/C][C] 0.6937[/C][/ROW]
[ROW][C]156[/C][C] 19[/C][C] 16.73[/C][C] 2.267[/C][/ROW]
[ROW][C]157[/C][C] 18[/C][C] 16.97[/C][C] 1.034[/C][/ROW]
[ROW][C]158[/C][C] 19[/C][C] 16.86[/C][C] 2.141[/C][/ROW]
[ROW][C]159[/C][C] 16[/C][C] 16.5[/C][C]-0.5004[/C][/ROW]
[ROW][C]160[/C][C] 16[/C][C] 16.52[/C][C]-0.5197[/C][/ROW]
[ROW][C]161[/C][C] 16[/C][C] 16.52[/C][C]-0.5197[/C][/ROW]
[ROW][C]162[/C][C] 14[/C][C] 15.95[/C][C]-1.948[/C][/ROW]
[/TABLE]
Source: https://freestatistics.org/blog/index.php?pk=&T=4

Globally Unique Identifier (entire table): ba.freestatistics.org/blog/index.php?pk=&T=4

As an alternative you can also use a QR Code:  

The GUIDs for individual cells are displayed in the table below:

Multiple Linear Regression - Actuals, Interpolation, and Residuals
Time or IndexActualsInterpolationForecastResidualsPrediction Error
1 14 16.63-2.626
2 19 17.18 1.821
3 17 16.52 0.4803
4 17 16.18 0.8196
5 15 16.84-1.84
6 20 16.07 3.926
7 15 16.29-1.287
8 19 16.07 2.926
9 15 16.31-1.306
10 15 16.73-1.733
11 19 16.52 2.48
12 20 16.31 3.694
13 18 16.18 1.82
14 15 16.52-1.52
15 14 16.29-2.287
16 20 16.29 3.713
17 16 16.86-0.859
18 16 16.52-0.5197
19 16 16.18-0.1804
20 10 16.41-6.413
21 19 16.63 2.374
22 19 16.63 2.374
23 16 16.84-0.8397
24 15 16.18-1.18
25 18 15.97 2.033
26 17 16.31 0.6937
27 19 16.05 2.946
28 17 16.86 0.141
29 19 16.31 2.694
30 20 16.86 3.141
31 5 16.31-11.31
32 19 15.84 3.159
33 16 16.52-0.5197
34 15 16.39-1.394
35 16 16.31-0.3063
36 18 16.31 1.694
37 16 16.31-0.3063
38 15 16.54-1.539
39 17 16.63 0.3737
40 20 16.97 3.034
41 19 16.54 2.461
42 7 16.63-9.626
43 13 16.63-3.626
44 16 15.97 0.03299
45 16 16.63-0.6263
46 18 16.31 1.694
47 18 16.65 1.354
48 16 16.65-0.6456
49 17 16.31 0.6937
50 19 16.52 2.48
51 16 16.52-0.5197
52 19 16.07 2.926
53 13 15.97-2.967
54 16 16.31-0.3063
55 13 16.63-3.626
56 12 17.39-5.392
57 17 15.63 1.372
58 17 16.52 0.4803
59 17 16.18 0.8196
60 16 16.41-0.413
61 16 16.73-0.733
62 14 16.63-2.626
63 16 16.63-0.6263
64 13 16.97-3.966
65 16 16.18-0.1804
66 14 16.18-2.18
67 20 16.63 3.374
68 12 16.73-4.733
69 13 16.2-3.2
70 18 16.84 1.16
71 14 16.29-2.287
72 19 16.52 2.48
73 18 16.18 1.82
74 14 16.18-2.18
75 18 16.73 1.267
76 19 16.52 2.48
77 15 16.39-1.394
78 14 16.52-2.52
79 17 16.31 0.6937
80 19 16.52 2.48
81 13 16.86-3.859
82 19 16.86 2.141
83 18 16.73 1.267
84 20 16.39 3.606
85 15 16.07-1.074
86 15 16.41-1.413
87 15 16.31-1.306
88 20 16.73 3.267
89 15 16.63-1.626
90 19 16.31 2.694
91 18 16.39 1.606
92 18 16.63 1.374
93 15 16.97-1.966
94 20 16.86 3.141
95 17 16.52 0.4803
96 12 16.18-4.18
97 18 16.86 1.141
98 19 16.63 2.374
99 20 17.29 2.714
100 17 17.07-0.07231
101 15 16.31-1.306
102 16 16.63-0.6263
103 18 16.41 1.587
104 18 16.52 1.48
105 14 16.61-2.607
106 15 16.52-1.52
107 12 16.31-4.306
108 17 16.39 0.6063
109 14 16.63-2.626
110 18 16.18 1.82
111 17 16.84 0.1603
112 17 16.86 0.141
113 20 16.65 3.354
114 16 16.2-0.1997
115 14 16.31-2.306
116 15 16.07-1.074
117 18 16.31 1.694
118 20 16.63 3.374
119 17 16.52 0.4803
120 17 16.29 0.713
121 17 16.84 0.1603
122 17 17.27-0.2663
123 15 15.97-0.967
124 17 16.2 0.8003
125 18 16.39 1.606
126 17 16.31 0.6937
127 20 17.07 2.928
128 15 15.63-0.6277
129 16 16.29-0.287
130 15 16.52-1.52
131 18 16.65 1.354
132 15 16.52-1.52
133 18 17.07 0.9277
134 20 16.63 3.374
135 19 16.31 2.694
136 14 15.97-1.967
137 16 16.52-0.5197
138 15 16.63-1.626
139 17 16.52 0.4803
140 18 16.41 1.587
141 20 17.07 2.928
142 17 16.63 0.3737
143 18 16.73 1.267
144 15 16.29-1.287
145 16 16.52-0.5197
146 11 16.41-5.413
147 15 16.2-1.2
148 18 15.86 2.14
149 17 16.41 0.587
150 16 16.65-0.6456
151 12 16.52-4.52
152 19 16.16 2.839
153 18 16.31 1.694
154 15 16.41-1.413
155 17 16.31 0.6937
156 19 16.73 2.267
157 18 16.97 1.034
158 19 16.86 2.141
159 16 16.5-0.5004
160 16 16.52-0.5197
161 16 16.52-0.5197
162 14 15.95-1.948


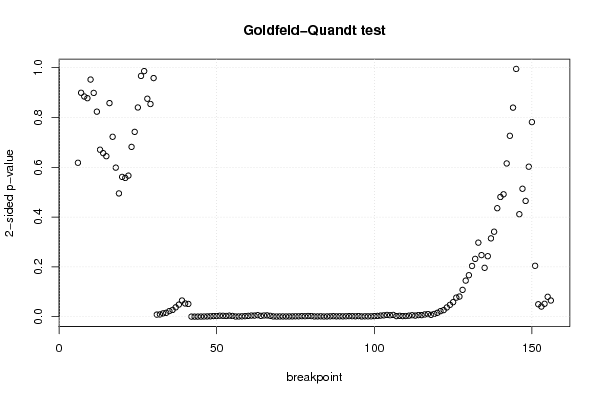
Goldfeld-Quandt test for Heteroskedasticity
p-valuesAlternative Hypothesis
breakpoint indexgreater2-sidedless
6 0.6909 0.6182 0.3091
7 0.5503 0.8993 0.4497
8 0.4422 0.8844 0.5578
9 0.5612 0.8775 0.4388
10 0.4762 0.9524 0.5238
11 0.4494 0.8987 0.5506
12 0.4117 0.8235 0.5883
13 0.3353 0.6706 0.6647
14 0.3284 0.6569 0.6716
15 0.3223 0.6446 0.6777
16 0.4289 0.8578 0.5711
17 0.3613 0.7226 0.6387
18 0.2993 0.5987 0.7007
19 0.2476 0.4951 0.7524
20 0.7193 0.5614 0.2807
21 0.7214 0.5573 0.2786
22 0.7167 0.5666 0.2833
23 0.659 0.682 0.341
24 0.6289 0.7423 0.3711
25 0.5799 0.8402 0.4201
26 0.5166 0.9669 0.4834
27 0.4932 0.9864 0.5068
28 0.4377 0.8753 0.5623
29 0.4271 0.8541 0.5729
30 0.4791 0.9583 0.5209
31 0.9957 0.008564 0.004282
32 0.9954 0.0092 0.0046
33 0.9933 0.01344 0.006718
34 0.9921 0.01578 0.00789
35 0.9887 0.0226 0.0113
36 0.9864 0.02716 0.01358
37 0.9811 0.03772 0.01886
38 0.9757 0.04864 0.02432
39 0.9674 0.06517 0.03259
40 0.9734 0.05328 0.02664
41 0.9744 0.05129 0.02564
42 0.9998 0.0004335 0.0002167
43 0.9999 0.0002968 0.0001484
44 0.9998 0.0004664 0.0002332
45 0.9996 0.0007195 0.0003597
46 0.9995 0.0009343 0.0004671
47 0.9994 0.001245 0.0006226
48 0.9991 0.001844 0.0009222
49 0.9987 0.002694 0.001347
50 0.9986 0.002735 0.001367
51 0.998 0.003963 0.001982
52 0.9981 0.003727 0.001864
53 0.9985 0.002939 0.001469
54 0.9979 0.004254 0.002127
55 0.9985 0.002998 0.001499
56 0.9996 0.0008994 0.0004497
57 0.9994 0.001123 0.0005614
58 0.9992 0.001643 0.0008216
59 0.9988 0.002302 0.001151
60 0.9983 0.003334 0.001667
61 0.9977 0.004632 0.002316
62 0.9977 0.00454 0.00227
63 0.9968 0.006316 0.003158
64 0.9983 0.003483 0.001742
65 0.9975 0.004957 0.002479
66 0.9973 0.005363 0.002681
67 0.9982 0.003599 0.0018
68 0.9994 0.001208 0.0006038
69 0.9996 0.000855 0.0004275
70 0.9995 0.001093 0.0005465
71 0.9994 0.001155 0.0005777
72 0.9994 0.001104 0.0005522
73 0.9994 0.001261 0.0006304
74 0.9993 0.001377 0.0006883
75 0.9991 0.001777 0.0008883
76 0.9991 0.001707 0.0008536
77 0.9989 0.002218 0.001109
78 0.999 0.002073 0.001037
79 0.9985 0.002921 0.00146
80 0.9986 0.002812 0.001406
81 0.9994 0.001217 0.0006085
82 0.9993 0.001332 0.000666
83 0.9991 0.001757 0.0008787
84 0.9995 0.0009491 0.0004745
85 0.9993 0.001329 0.0006647
86 0.9992 0.001698 0.0008488
87 0.9989 0.002219 0.00111
88 0.9992 0.001588 0.0007938
89 0.9991 0.00186 0.0009302
90 0.9992 0.001591 0.0007955
91 0.9991 0.001886 0.0009429
92 0.9988 0.002469 0.001235
93 0.9989 0.002191 0.001095
94 0.9991 0.001811 0.0009057
95 0.9987 0.002661 0.001331
96 0.9994 0.001175 0.0005873
97 0.9992 0.00167 0.0008349
98 0.9991 0.001701 0.0008506
99 0.9991 0.001743 0.0008713
100 0.9988 0.002472 0.001236
101 0.9984 0.003238 0.001619
102 0.9977 0.004539 0.00227
103 0.9972 0.005604 0.002802
104 0.9964 0.007122 0.003561
105 0.997 0.006065 0.003033
106 0.9964 0.007217 0.003608
107 0.9988 0.002477 0.001238
108 0.9982 0.003641 0.00182
109 0.9987 0.00264 0.00132
110 0.9986 0.002868 0.001434
111 0.9979 0.004245 0.002123
112 0.997 0.006062 0.003031
113 0.9978 0.00449 0.002245
114 0.9966 0.006745 0.003373
115 0.9968 0.006448 0.003224
116 0.9955 0.009059 0.004529
117 0.9946 0.01081 0.005403
118 0.9963 0.007464 0.003732
119 0.9944 0.0111 0.005552
120 0.9922 0.01558 0.007789
121 0.9888 0.02237 0.01119
122 0.9867 0.02651 0.01326
123 0.9814 0.03719 0.0186
124 0.9761 0.04776 0.02388
125 0.9708 0.05836 0.02918
126 0.9617 0.07664 0.03832
127 0.9595 0.08103 0.04052
128 0.9461 0.1078 0.05391
129 0.9275 0.145 0.07252
130 0.9167 0.1667 0.08335
131 0.8981 0.2037 0.1019
132 0.8839 0.2322 0.1161
133 0.8513 0.2974 0.1487
134 0.8763 0.2474 0.1237
135 0.9018 0.1963 0.09817
136 0.8785 0.2431 0.1215
137 0.8427 0.3147 0.1573
138 0.8294 0.3413 0.1706
139 0.7821 0.4357 0.2179
140 0.7595 0.4809 0.2405
141 0.7542 0.4917 0.2458
142 0.6923 0.6155 0.3077
143 0.6367 0.7265 0.3633
144 0.5802 0.8396 0.4198
145 0.5025 0.995 0.4975
146 0.7942 0.4117 0.2058
147 0.7431 0.5139 0.2569
148 0.7675 0.465 0.2325
149 0.6988 0.6024 0.3012
150 0.6092 0.7816 0.3908
151 0.8978 0.2045 0.1022
152 0.975 0.05005 0.02503
153 0.9796 0.04084 0.02042
154 0.974 0.05191 0.02595
155 0.96 0.08002 0.04001
156 0.9674 0.0651 0.03255

\begin{tabular}{lllllllll}
\hline
Goldfeld-Quandt test for Heteroskedasticity \tabularnewline
p-values & Alternative Hypothesis \tabularnewline
breakpoint index & greater & 2-sided & less \tabularnewline
6 &  0.6909 &  0.6182 &  0.3091 \tabularnewline
7 &  0.5503 &  0.8993 &  0.4497 \tabularnewline
8 &  0.4422 &  0.8844 &  0.5578 \tabularnewline
9 &  0.5612 &  0.8775 &  0.4388 \tabularnewline
10 &  0.4762 &  0.9524 &  0.5238 \tabularnewline
11 &  0.4494 &  0.8987 &  0.5506 \tabularnewline
12 &  0.4117 &  0.8235 &  0.5883 \tabularnewline
13 &  0.3353 &  0.6706 &  0.6647 \tabularnewline
14 &  0.3284 &  0.6569 &  0.6716 \tabularnewline
15 &  0.3223 &  0.6446 &  0.6777 \tabularnewline
16 &  0.4289 &  0.8578 &  0.5711 \tabularnewline
17 &  0.3613 &  0.7226 &  0.6387 \tabularnewline
18 &  0.2993 &  0.5987 &  0.7007 \tabularnewline
19 &  0.2476 &  0.4951 &  0.7524 \tabularnewline
20 &  0.7193 &  0.5614 &  0.2807 \tabularnewline
21 &  0.7214 &  0.5573 &  0.2786 \tabularnewline
22 &  0.7167 &  0.5666 &  0.2833 \tabularnewline
23 &  0.659 &  0.682 &  0.341 \tabularnewline
24 &  0.6289 &  0.7423 &  0.3711 \tabularnewline
25 &  0.5799 &  0.8402 &  0.4201 \tabularnewline
26 &  0.5166 &  0.9669 &  0.4834 \tabularnewline
27 &  0.4932 &  0.9864 &  0.5068 \tabularnewline
28 &  0.4377 &  0.8753 &  0.5623 \tabularnewline
29 &  0.4271 &  0.8541 &  0.5729 \tabularnewline
30 &  0.4791 &  0.9583 &  0.5209 \tabularnewline
31 &  0.9957 &  0.008564 &  0.004282 \tabularnewline
32 &  0.9954 &  0.0092 &  0.0046 \tabularnewline
33 &  0.9933 &  0.01344 &  0.006718 \tabularnewline
34 &  0.9921 &  0.01578 &  0.00789 \tabularnewline
35 &  0.9887 &  0.0226 &  0.0113 \tabularnewline
36 &  0.9864 &  0.02716 &  0.01358 \tabularnewline
37 &  0.9811 &  0.03772 &  0.01886 \tabularnewline
38 &  0.9757 &  0.04864 &  0.02432 \tabularnewline
39 &  0.9674 &  0.06517 &  0.03259 \tabularnewline
40 &  0.9734 &  0.05328 &  0.02664 \tabularnewline
41 &  0.9744 &  0.05129 &  0.02564 \tabularnewline
42 &  0.9998 &  0.0004335 &  0.0002167 \tabularnewline
43 &  0.9999 &  0.0002968 &  0.0001484 \tabularnewline
44 &  0.9998 &  0.0004664 &  0.0002332 \tabularnewline
45 &  0.9996 &  0.0007195 &  0.0003597 \tabularnewline
46 &  0.9995 &  0.0009343 &  0.0004671 \tabularnewline
47 &  0.9994 &  0.001245 &  0.0006226 \tabularnewline
48 &  0.9991 &  0.001844 &  0.0009222 \tabularnewline
49 &  0.9987 &  0.002694 &  0.001347 \tabularnewline
50 &  0.9986 &  0.002735 &  0.001367 \tabularnewline
51 &  0.998 &  0.003963 &  0.001982 \tabularnewline
52 &  0.9981 &  0.003727 &  0.001864 \tabularnewline
53 &  0.9985 &  0.002939 &  0.001469 \tabularnewline
54 &  0.9979 &  0.004254 &  0.002127 \tabularnewline
55 &  0.9985 &  0.002998 &  0.001499 \tabularnewline
56 &  0.9996 &  0.0008994 &  0.0004497 \tabularnewline
57 &  0.9994 &  0.001123 &  0.0005614 \tabularnewline
58 &  0.9992 &  0.001643 &  0.0008216 \tabularnewline
59 &  0.9988 &  0.002302 &  0.001151 \tabularnewline
60 &  0.9983 &  0.003334 &  0.001667 \tabularnewline
61 &  0.9977 &  0.004632 &  0.002316 \tabularnewline
62 &  0.9977 &  0.00454 &  0.00227 \tabularnewline
63 &  0.9968 &  0.006316 &  0.003158 \tabularnewline
64 &  0.9983 &  0.003483 &  0.001742 \tabularnewline
65 &  0.9975 &  0.004957 &  0.002479 \tabularnewline
66 &  0.9973 &  0.005363 &  0.002681 \tabularnewline
67 &  0.9982 &  0.003599 &  0.0018 \tabularnewline
68 &  0.9994 &  0.001208 &  0.0006038 \tabularnewline
69 &  0.9996 &  0.000855 &  0.0004275 \tabularnewline
70 &  0.9995 &  0.001093 &  0.0005465 \tabularnewline
71 &  0.9994 &  0.001155 &  0.0005777 \tabularnewline
72 &  0.9994 &  0.001104 &  0.0005522 \tabularnewline
73 &  0.9994 &  0.001261 &  0.0006304 \tabularnewline
74 &  0.9993 &  0.001377 &  0.0006883 \tabularnewline
75 &  0.9991 &  0.001777 &  0.0008883 \tabularnewline
76 &  0.9991 &  0.001707 &  0.0008536 \tabularnewline
77 &  0.9989 &  0.002218 &  0.001109 \tabularnewline
78 &  0.999 &  0.002073 &  0.001037 \tabularnewline
79 &  0.9985 &  0.002921 &  0.00146 \tabularnewline
80 &  0.9986 &  0.002812 &  0.001406 \tabularnewline
81 &  0.9994 &  0.001217 &  0.0006085 \tabularnewline
82 &  0.9993 &  0.001332 &  0.000666 \tabularnewline
83 &  0.9991 &  0.001757 &  0.0008787 \tabularnewline
84 &  0.9995 &  0.0009491 &  0.0004745 \tabularnewline
85 &  0.9993 &  0.001329 &  0.0006647 \tabularnewline
86 &  0.9992 &  0.001698 &  0.0008488 \tabularnewline
87 &  0.9989 &  0.002219 &  0.00111 \tabularnewline
88 &  0.9992 &  0.001588 &  0.0007938 \tabularnewline
89 &  0.9991 &  0.00186 &  0.0009302 \tabularnewline
90 &  0.9992 &  0.001591 &  0.0007955 \tabularnewline
91 &  0.9991 &  0.001886 &  0.0009429 \tabularnewline
92 &  0.9988 &  0.002469 &  0.001235 \tabularnewline
93 &  0.9989 &  0.002191 &  0.001095 \tabularnewline
94 &  0.9991 &  0.001811 &  0.0009057 \tabularnewline
95 &  0.9987 &  0.002661 &  0.001331 \tabularnewline
96 &  0.9994 &  0.001175 &  0.0005873 \tabularnewline
97 &  0.9992 &  0.00167 &  0.0008349 \tabularnewline
98 &  0.9991 &  0.001701 &  0.0008506 \tabularnewline
99 &  0.9991 &  0.001743 &  0.0008713 \tabularnewline
100 &  0.9988 &  0.002472 &  0.001236 \tabularnewline
101 &  0.9984 &  0.003238 &  0.001619 \tabularnewline
102 &  0.9977 &  0.004539 &  0.00227 \tabularnewline
103 &  0.9972 &  0.005604 &  0.002802 \tabularnewline
104 &  0.9964 &  0.007122 &  0.003561 \tabularnewline
105 &  0.997 &  0.006065 &  0.003033 \tabularnewline
106 &  0.9964 &  0.007217 &  0.003608 \tabularnewline
107 &  0.9988 &  0.002477 &  0.001238 \tabularnewline
108 &  0.9982 &  0.003641 &  0.00182 \tabularnewline
109 &  0.9987 &  0.00264 &  0.00132 \tabularnewline
110 &  0.9986 &  0.002868 &  0.001434 \tabularnewline
111 &  0.9979 &  0.004245 &  0.002123 \tabularnewline
112 &  0.997 &  0.006062 &  0.003031 \tabularnewline
113 &  0.9978 &  0.00449 &  0.002245 \tabularnewline
114 &  0.9966 &  0.006745 &  0.003373 \tabularnewline
115 &  0.9968 &  0.006448 &  0.003224 \tabularnewline
116 &  0.9955 &  0.009059 &  0.004529 \tabularnewline
117 &  0.9946 &  0.01081 &  0.005403 \tabularnewline
118 &  0.9963 &  0.007464 &  0.003732 \tabularnewline
119 &  0.9944 &  0.0111 &  0.005552 \tabularnewline
120 &  0.9922 &  0.01558 &  0.007789 \tabularnewline
121 &  0.9888 &  0.02237 &  0.01119 \tabularnewline
122 &  0.9867 &  0.02651 &  0.01326 \tabularnewline
123 &  0.9814 &  0.03719 &  0.0186 \tabularnewline
124 &  0.9761 &  0.04776 &  0.02388 \tabularnewline
125 &  0.9708 &  0.05836 &  0.02918 \tabularnewline
126 &  0.9617 &  0.07664 &  0.03832 \tabularnewline
127 &  0.9595 &  0.08103 &  0.04052 \tabularnewline
128 &  0.9461 &  0.1078 &  0.05391 \tabularnewline
129 &  0.9275 &  0.145 &  0.07252 \tabularnewline
130 &  0.9167 &  0.1667 &  0.08335 \tabularnewline
131 &  0.8981 &  0.2037 &  0.1019 \tabularnewline
132 &  0.8839 &  0.2322 &  0.1161 \tabularnewline
133 &  0.8513 &  0.2974 &  0.1487 \tabularnewline
134 &  0.8763 &  0.2474 &  0.1237 \tabularnewline
135 &  0.9018 &  0.1963 &  0.09817 \tabularnewline
136 &  0.8785 &  0.2431 &  0.1215 \tabularnewline
137 &  0.8427 &  0.3147 &  0.1573 \tabularnewline
138 &  0.8294 &  0.3413 &  0.1706 \tabularnewline
139 &  0.7821 &  0.4357 &  0.2179 \tabularnewline
140 &  0.7595 &  0.4809 &  0.2405 \tabularnewline
141 &  0.7542 &  0.4917 &  0.2458 \tabularnewline
142 &  0.6923 &  0.6155 &  0.3077 \tabularnewline
143 &  0.6367 &  0.7265 &  0.3633 \tabularnewline
144 &  0.5802 &  0.8396 &  0.4198 \tabularnewline
145 &  0.5025 &  0.995 &  0.4975 \tabularnewline
146 &  0.7942 &  0.4117 &  0.2058 \tabularnewline
147 &  0.7431 &  0.5139 &  0.2569 \tabularnewline
148 &  0.7675 &  0.465 &  0.2325 \tabularnewline
149 &  0.6988 &  0.6024 &  0.3012 \tabularnewline
150 &  0.6092 &  0.7816 &  0.3908 \tabularnewline
151 &  0.8978 &  0.2045 &  0.1022 \tabularnewline
152 &  0.975 &  0.05005 &  0.02503 \tabularnewline
153 &  0.9796 &  0.04084 &  0.02042 \tabularnewline
154 &  0.974 &  0.05191 &  0.02595 \tabularnewline
155 &  0.96 &  0.08002 &  0.04001 \tabularnewline
156 &  0.9674 &  0.0651 &  0.03255 \tabularnewline
\hline
\end{tabular}
%Source: https://freestatistics.org/blog/index.php?pk=&T=5

[TABLE]
[ROW][C]Goldfeld-Quandt test for Heteroskedasticity[/C][/ROW]
[ROW][C]p-values[/C][C]Alternative Hypothesis[/C][/ROW]
[ROW][C]breakpoint index[/C][C]greater[/C][C]2-sided[/C][C]less[/C][/ROW]
[ROW][C]6[/C][C] 0.6909[/C][C] 0.6182[/C][C] 0.3091[/C][/ROW]
[ROW][C]7[/C][C] 0.5503[/C][C] 0.8993[/C][C] 0.4497[/C][/ROW]
[ROW][C]8[/C][C] 0.4422[/C][C] 0.8844[/C][C] 0.5578[/C][/ROW]
[ROW][C]9[/C][C] 0.5612[/C][C] 0.8775[/C][C] 0.4388[/C][/ROW]
[ROW][C]10[/C][C] 0.4762[/C][C] 0.9524[/C][C] 0.5238[/C][/ROW]
[ROW][C]11[/C][C] 0.4494[/C][C] 0.8987[/C][C] 0.5506[/C][/ROW]
[ROW][C]12[/C][C] 0.4117[/C][C] 0.8235[/C][C] 0.5883[/C][/ROW]
[ROW][C]13[/C][C] 0.3353[/C][C] 0.6706[/C][C] 0.6647[/C][/ROW]
[ROW][C]14[/C][C] 0.3284[/C][C] 0.6569[/C][C] 0.6716[/C][/ROW]
[ROW][C]15[/C][C] 0.3223[/C][C] 0.6446[/C][C] 0.6777[/C][/ROW]
[ROW][C]16[/C][C] 0.4289[/C][C] 0.8578[/C][C] 0.5711[/C][/ROW]
[ROW][C]17[/C][C] 0.3613[/C][C] 0.7226[/C][C] 0.6387[/C][/ROW]
[ROW][C]18[/C][C] 0.2993[/C][C] 0.5987[/C][C] 0.7007[/C][/ROW]
[ROW][C]19[/C][C] 0.2476[/C][C] 0.4951[/C][C] 0.7524[/C][/ROW]
[ROW][C]20[/C][C] 0.7193[/C][C] 0.5614[/C][C] 0.2807[/C][/ROW]
[ROW][C]21[/C][C] 0.7214[/C][C] 0.5573[/C][C] 0.2786[/C][/ROW]
[ROW][C]22[/C][C] 0.7167[/C][C] 0.5666[/C][C] 0.2833[/C][/ROW]
[ROW][C]23[/C][C] 0.659[/C][C] 0.682[/C][C] 0.341[/C][/ROW]
[ROW][C]24[/C][C] 0.6289[/C][C] 0.7423[/C][C] 0.3711[/C][/ROW]
[ROW][C]25[/C][C] 0.5799[/C][C] 0.8402[/C][C] 0.4201[/C][/ROW]
[ROW][C]26[/C][C] 0.5166[/C][C] 0.9669[/C][C] 0.4834[/C][/ROW]
[ROW][C]27[/C][C] 0.4932[/C][C] 0.9864[/C][C] 0.5068[/C][/ROW]
[ROW][C]28[/C][C] 0.4377[/C][C] 0.8753[/C][C] 0.5623[/C][/ROW]
[ROW][C]29[/C][C] 0.4271[/C][C] 0.8541[/C][C] 0.5729[/C][/ROW]
[ROW][C]30[/C][C] 0.4791[/C][C] 0.9583[/C][C] 0.5209[/C][/ROW]
[ROW][C]31[/C][C] 0.9957[/C][C] 0.008564[/C][C] 0.004282[/C][/ROW]
[ROW][C]32[/C][C] 0.9954[/C][C] 0.0092[/C][C] 0.0046[/C][/ROW]
[ROW][C]33[/C][C] 0.9933[/C][C] 0.01344[/C][C] 0.006718[/C][/ROW]
[ROW][C]34[/C][C] 0.9921[/C][C] 0.01578[/C][C] 0.00789[/C][/ROW]
[ROW][C]35[/C][C] 0.9887[/C][C] 0.0226[/C][C] 0.0113[/C][/ROW]
[ROW][C]36[/C][C] 0.9864[/C][C] 0.02716[/C][C] 0.01358[/C][/ROW]
[ROW][C]37[/C][C] 0.9811[/C][C] 0.03772[/C][C] 0.01886[/C][/ROW]
[ROW][C]38[/C][C] 0.9757[/C][C] 0.04864[/C][C] 0.02432[/C][/ROW]
[ROW][C]39[/C][C] 0.9674[/C][C] 0.06517[/C][C] 0.03259[/C][/ROW]
[ROW][C]40[/C][C] 0.9734[/C][C] 0.05328[/C][C] 0.02664[/C][/ROW]
[ROW][C]41[/C][C] 0.9744[/C][C] 0.05129[/C][C] 0.02564[/C][/ROW]
[ROW][C]42[/C][C] 0.9998[/C][C] 0.0004335[/C][C] 0.0002167[/C][/ROW]
[ROW][C]43[/C][C] 0.9999[/C][C] 0.0002968[/C][C] 0.0001484[/C][/ROW]
[ROW][C]44[/C][C] 0.9998[/C][C] 0.0004664[/C][C] 0.0002332[/C][/ROW]
[ROW][C]45[/C][C] 0.9996[/C][C] 0.0007195[/C][C] 0.0003597[/C][/ROW]
[ROW][C]46[/C][C] 0.9995[/C][C] 0.0009343[/C][C] 0.0004671[/C][/ROW]
[ROW][C]47[/C][C] 0.9994[/C][C] 0.001245[/C][C] 0.0006226[/C][/ROW]
[ROW][C]48[/C][C] 0.9991[/C][C] 0.001844[/C][C] 0.0009222[/C][/ROW]
[ROW][C]49[/C][C] 0.9987[/C][C] 0.002694[/C][C] 0.001347[/C][/ROW]
[ROW][C]50[/C][C] 0.9986[/C][C] 0.002735[/C][C] 0.001367[/C][/ROW]
[ROW][C]51[/C][C] 0.998[/C][C] 0.003963[/C][C] 0.001982[/C][/ROW]
[ROW][C]52[/C][C] 0.9981[/C][C] 0.003727[/C][C] 0.001864[/C][/ROW]
[ROW][C]53[/C][C] 0.9985[/C][C] 0.002939[/C][C] 0.001469[/C][/ROW]
[ROW][C]54[/C][C] 0.9979[/C][C] 0.004254[/C][C] 0.002127[/C][/ROW]
[ROW][C]55[/C][C] 0.9985[/C][C] 0.002998[/C][C] 0.001499[/C][/ROW]
[ROW][C]56[/C][C] 0.9996[/C][C] 0.0008994[/C][C] 0.0004497[/C][/ROW]
[ROW][C]57[/C][C] 0.9994[/C][C] 0.001123[/C][C] 0.0005614[/C][/ROW]
[ROW][C]58[/C][C] 0.9992[/C][C] 0.001643[/C][C] 0.0008216[/C][/ROW]
[ROW][C]59[/C][C] 0.9988[/C][C] 0.002302[/C][C] 0.001151[/C][/ROW]
[ROW][C]60[/C][C] 0.9983[/C][C] 0.003334[/C][C] 0.001667[/C][/ROW]
[ROW][C]61[/C][C] 0.9977[/C][C] 0.004632[/C][C] 0.002316[/C][/ROW]
[ROW][C]62[/C][C] 0.9977[/C][C] 0.00454[/C][C] 0.00227[/C][/ROW]
[ROW][C]63[/C][C] 0.9968[/C][C] 0.006316[/C][C] 0.003158[/C][/ROW]
[ROW][C]64[/C][C] 0.9983[/C][C] 0.003483[/C][C] 0.001742[/C][/ROW]
[ROW][C]65[/C][C] 0.9975[/C][C] 0.004957[/C][C] 0.002479[/C][/ROW]
[ROW][C]66[/C][C] 0.9973[/C][C] 0.005363[/C][C] 0.002681[/C][/ROW]
[ROW][C]67[/C][C] 0.9982[/C][C] 0.003599[/C][C] 0.0018[/C][/ROW]
[ROW][C]68[/C][C] 0.9994[/C][C] 0.001208[/C][C] 0.0006038[/C][/ROW]
[ROW][C]69[/C][C] 0.9996[/C][C] 0.000855[/C][C] 0.0004275[/C][/ROW]
[ROW][C]70[/C][C] 0.9995[/C][C] 0.001093[/C][C] 0.0005465[/C][/ROW]
[ROW][C]71[/C][C] 0.9994[/C][C] 0.001155[/C][C] 0.0005777[/C][/ROW]
[ROW][C]72[/C][C] 0.9994[/C][C] 0.001104[/C][C] 0.0005522[/C][/ROW]
[ROW][C]73[/C][C] 0.9994[/C][C] 0.001261[/C][C] 0.0006304[/C][/ROW]
[ROW][C]74[/C][C] 0.9993[/C][C] 0.001377[/C][C] 0.0006883[/C][/ROW]
[ROW][C]75[/C][C] 0.9991[/C][C] 0.001777[/C][C] 0.0008883[/C][/ROW]
[ROW][C]76[/C][C] 0.9991[/C][C] 0.001707[/C][C] 0.0008536[/C][/ROW]
[ROW][C]77[/C][C] 0.9989[/C][C] 0.002218[/C][C] 0.001109[/C][/ROW]
[ROW][C]78[/C][C] 0.999[/C][C] 0.002073[/C][C] 0.001037[/C][/ROW]
[ROW][C]79[/C][C] 0.9985[/C][C] 0.002921[/C][C] 0.00146[/C][/ROW]
[ROW][C]80[/C][C] 0.9986[/C][C] 0.002812[/C][C] 0.001406[/C][/ROW]
[ROW][C]81[/C][C] 0.9994[/C][C] 0.001217[/C][C] 0.0006085[/C][/ROW]
[ROW][C]82[/C][C] 0.9993[/C][C] 0.001332[/C][C] 0.000666[/C][/ROW]
[ROW][C]83[/C][C] 0.9991[/C][C] 0.001757[/C][C] 0.0008787[/C][/ROW]
[ROW][C]84[/C][C] 0.9995[/C][C] 0.0009491[/C][C] 0.0004745[/C][/ROW]
[ROW][C]85[/C][C] 0.9993[/C][C] 0.001329[/C][C] 0.0006647[/C][/ROW]
[ROW][C]86[/C][C] 0.9992[/C][C] 0.001698[/C][C] 0.0008488[/C][/ROW]
[ROW][C]87[/C][C] 0.9989[/C][C] 0.002219[/C][C] 0.00111[/C][/ROW]
[ROW][C]88[/C][C] 0.9992[/C][C] 0.001588[/C][C] 0.0007938[/C][/ROW]
[ROW][C]89[/C][C] 0.9991[/C][C] 0.00186[/C][C] 0.0009302[/C][/ROW]
[ROW][C]90[/C][C] 0.9992[/C][C] 0.001591[/C][C] 0.0007955[/C][/ROW]
[ROW][C]91[/C][C] 0.9991[/C][C] 0.001886[/C][C] 0.0009429[/C][/ROW]
[ROW][C]92[/C][C] 0.9988[/C][C] 0.002469[/C][C] 0.001235[/C][/ROW]
[ROW][C]93[/C][C] 0.9989[/C][C] 0.002191[/C][C] 0.001095[/C][/ROW]
[ROW][C]94[/C][C] 0.9991[/C][C] 0.001811[/C][C] 0.0009057[/C][/ROW]
[ROW][C]95[/C][C] 0.9987[/C][C] 0.002661[/C][C] 0.001331[/C][/ROW]
[ROW][C]96[/C][C] 0.9994[/C][C] 0.001175[/C][C] 0.0005873[/C][/ROW]
[ROW][C]97[/C][C] 0.9992[/C][C] 0.00167[/C][C] 0.0008349[/C][/ROW]
[ROW][C]98[/C][C] 0.9991[/C][C] 0.001701[/C][C] 0.0008506[/C][/ROW]
[ROW][C]99[/C][C] 0.9991[/C][C] 0.001743[/C][C] 0.0008713[/C][/ROW]
[ROW][C]100[/C][C] 0.9988[/C][C] 0.002472[/C][C] 0.001236[/C][/ROW]
[ROW][C]101[/C][C] 0.9984[/C][C] 0.003238[/C][C] 0.001619[/C][/ROW]
[ROW][C]102[/C][C] 0.9977[/C][C] 0.004539[/C][C] 0.00227[/C][/ROW]
[ROW][C]103[/C][C] 0.9972[/C][C] 0.005604[/C][C] 0.002802[/C][/ROW]
[ROW][C]104[/C][C] 0.9964[/C][C] 0.007122[/C][C] 0.003561[/C][/ROW]
[ROW][C]105[/C][C] 0.997[/C][C] 0.006065[/C][C] 0.003033[/C][/ROW]
[ROW][C]106[/C][C] 0.9964[/C][C] 0.007217[/C][C] 0.003608[/C][/ROW]
[ROW][C]107[/C][C] 0.9988[/C][C] 0.002477[/C][C] 0.001238[/C][/ROW]
[ROW][C]108[/C][C] 0.9982[/C][C] 0.003641[/C][C] 0.00182[/C][/ROW]
[ROW][C]109[/C][C] 0.9987[/C][C] 0.00264[/C][C] 0.00132[/C][/ROW]
[ROW][C]110[/C][C] 0.9986[/C][C] 0.002868[/C][C] 0.001434[/C][/ROW]
[ROW][C]111[/C][C] 0.9979[/C][C] 0.004245[/C][C] 0.002123[/C][/ROW]
[ROW][C]112[/C][C] 0.997[/C][C] 0.006062[/C][C] 0.003031[/C][/ROW]
[ROW][C]113[/C][C] 0.9978[/C][C] 0.00449[/C][C] 0.002245[/C][/ROW]
[ROW][C]114[/C][C] 0.9966[/C][C] 0.006745[/C][C] 0.003373[/C][/ROW]
[ROW][C]115[/C][C] 0.9968[/C][C] 0.006448[/C][C] 0.003224[/C][/ROW]
[ROW][C]116[/C][C] 0.9955[/C][C] 0.009059[/C][C] 0.004529[/C][/ROW]
[ROW][C]117[/C][C] 0.9946[/C][C] 0.01081[/C][C] 0.005403[/C][/ROW]
[ROW][C]118[/C][C] 0.9963[/C][C] 0.007464[/C][C] 0.003732[/C][/ROW]
[ROW][C]119[/C][C] 0.9944[/C][C] 0.0111[/C][C] 0.005552[/C][/ROW]
[ROW][C]120[/C][C] 0.9922[/C][C] 0.01558[/C][C] 0.007789[/C][/ROW]
[ROW][C]121[/C][C] 0.9888[/C][C] 0.02237[/C][C] 0.01119[/C][/ROW]
[ROW][C]122[/C][C] 0.9867[/C][C] 0.02651[/C][C] 0.01326[/C][/ROW]
[ROW][C]123[/C][C] 0.9814[/C][C] 0.03719[/C][C] 0.0186[/C][/ROW]
[ROW][C]124[/C][C] 0.9761[/C][C] 0.04776[/C][C] 0.02388[/C][/ROW]
[ROW][C]125[/C][C] 0.9708[/C][C] 0.05836[/C][C] 0.02918[/C][/ROW]
[ROW][C]126[/C][C] 0.9617[/C][C] 0.07664[/C][C] 0.03832[/C][/ROW]
[ROW][C]127[/C][C] 0.9595[/C][C] 0.08103[/C][C] 0.04052[/C][/ROW]
[ROW][C]128[/C][C] 0.9461[/C][C] 0.1078[/C][C] 0.05391[/C][/ROW]
[ROW][C]129[/C][C] 0.9275[/C][C] 0.145[/C][C] 0.07252[/C][/ROW]
[ROW][C]130[/C][C] 0.9167[/C][C] 0.1667[/C][C] 0.08335[/C][/ROW]
[ROW][C]131[/C][C] 0.8981[/C][C] 0.2037[/C][C] 0.1019[/C][/ROW]
[ROW][C]132[/C][C] 0.8839[/C][C] 0.2322[/C][C] 0.1161[/C][/ROW]
[ROW][C]133[/C][C] 0.8513[/C][C] 0.2974[/C][C] 0.1487[/C][/ROW]
[ROW][C]134[/C][C] 0.8763[/C][C] 0.2474[/C][C] 0.1237[/C][/ROW]
[ROW][C]135[/C][C] 0.9018[/C][C] 0.1963[/C][C] 0.09817[/C][/ROW]
[ROW][C]136[/C][C] 0.8785[/C][C] 0.2431[/C][C] 0.1215[/C][/ROW]
[ROW][C]137[/C][C] 0.8427[/C][C] 0.3147[/C][C] 0.1573[/C][/ROW]
[ROW][C]138[/C][C] 0.8294[/C][C] 0.3413[/C][C] 0.1706[/C][/ROW]
[ROW][C]139[/C][C] 0.7821[/C][C] 0.4357[/C][C] 0.2179[/C][/ROW]
[ROW][C]140[/C][C] 0.7595[/C][C] 0.4809[/C][C] 0.2405[/C][/ROW]
[ROW][C]141[/C][C] 0.7542[/C][C] 0.4917[/C][C] 0.2458[/C][/ROW]
[ROW][C]142[/C][C] 0.6923[/C][C] 0.6155[/C][C] 0.3077[/C][/ROW]
[ROW][C]143[/C][C] 0.6367[/C][C] 0.7265[/C][C] 0.3633[/C][/ROW]
[ROW][C]144[/C][C] 0.5802[/C][C] 0.8396[/C][C] 0.4198[/C][/ROW]
[ROW][C]145[/C][C] 0.5025[/C][C] 0.995[/C][C] 0.4975[/C][/ROW]
[ROW][C]146[/C][C] 0.7942[/C][C] 0.4117[/C][C] 0.2058[/C][/ROW]
[ROW][C]147[/C][C] 0.7431[/C][C] 0.5139[/C][C] 0.2569[/C][/ROW]
[ROW][C]148[/C][C] 0.7675[/C][C] 0.465[/C][C] 0.2325[/C][/ROW]
[ROW][C]149[/C][C] 0.6988[/C][C] 0.6024[/C][C] 0.3012[/C][/ROW]
[ROW][C]150[/C][C] 0.6092[/C][C] 0.7816[/C][C] 0.3908[/C][/ROW]
[ROW][C]151[/C][C] 0.8978[/C][C] 0.2045[/C][C] 0.1022[/C][/ROW]
[ROW][C]152[/C][C] 0.975[/C][C] 0.05005[/C][C] 0.02503[/C][/ROW]
[ROW][C]153[/C][C] 0.9796[/C][C] 0.04084[/C][C] 0.02042[/C][/ROW]
[ROW][C]154[/C][C] 0.974[/C][C] 0.05191[/C][C] 0.02595[/C][/ROW]
[ROW][C]155[/C][C] 0.96[/C][C] 0.08002[/C][C] 0.04001[/C][/ROW]
[ROW][C]156[/C][C] 0.9674[/C][C] 0.0651[/C][C] 0.03255[/C][/ROW]
[/TABLE]
Source: https://freestatistics.org/blog/index.php?pk=&T=5

Globally Unique Identifier (entire table): ba.freestatistics.org/blog/index.php?pk=&T=5

As an alternative you can also use a QR Code:  

The GUIDs for individual cells are displayed in the table below:

Goldfeld-Quandt test for Heteroskedasticity
p-valuesAlternative Hypothesis
breakpoint indexgreater2-sidedless
6 0.6909 0.6182 0.3091
7 0.5503 0.8993 0.4497
8 0.4422 0.8844 0.5578
9 0.5612 0.8775 0.4388
10 0.4762 0.9524 0.5238
11 0.4494 0.8987 0.5506
12 0.4117 0.8235 0.5883
13 0.3353 0.6706 0.6647
14 0.3284 0.6569 0.6716
15 0.3223 0.6446 0.6777
16 0.4289 0.8578 0.5711
17 0.3613 0.7226 0.6387
18 0.2993 0.5987 0.7007
19 0.2476 0.4951 0.7524
20 0.7193 0.5614 0.2807
21 0.7214 0.5573 0.2786
22 0.7167 0.5666 0.2833
23 0.659 0.682 0.341
24 0.6289 0.7423 0.3711
25 0.5799 0.8402 0.4201
26 0.5166 0.9669 0.4834
27 0.4932 0.9864 0.5068
28 0.4377 0.8753 0.5623
29 0.4271 0.8541 0.5729
30 0.4791 0.9583 0.5209
31 0.9957 0.008564 0.004282
32 0.9954 0.0092 0.0046
33 0.9933 0.01344 0.006718
34 0.9921 0.01578 0.00789
35 0.9887 0.0226 0.0113
36 0.9864 0.02716 0.01358
37 0.9811 0.03772 0.01886
38 0.9757 0.04864 0.02432
39 0.9674 0.06517 0.03259
40 0.9734 0.05328 0.02664
41 0.9744 0.05129 0.02564
42 0.9998 0.0004335 0.0002167
43 0.9999 0.0002968 0.0001484
44 0.9998 0.0004664 0.0002332
45 0.9996 0.0007195 0.0003597
46 0.9995 0.0009343 0.0004671
47 0.9994 0.001245 0.0006226
48 0.9991 0.001844 0.0009222
49 0.9987 0.002694 0.001347
50 0.9986 0.002735 0.001367
51 0.998 0.003963 0.001982
52 0.9981 0.003727 0.001864
53 0.9985 0.002939 0.001469
54 0.9979 0.004254 0.002127
55 0.9985 0.002998 0.001499
56 0.9996 0.0008994 0.0004497
57 0.9994 0.001123 0.0005614
58 0.9992 0.001643 0.0008216
59 0.9988 0.002302 0.001151
60 0.9983 0.003334 0.001667
61 0.9977 0.004632 0.002316
62 0.9977 0.00454 0.00227
63 0.9968 0.006316 0.003158
64 0.9983 0.003483 0.001742
65 0.9975 0.004957 0.002479
66 0.9973 0.005363 0.002681
67 0.9982 0.003599 0.0018
68 0.9994 0.001208 0.0006038
69 0.9996 0.000855 0.0004275
70 0.9995 0.001093 0.0005465
71 0.9994 0.001155 0.0005777
72 0.9994 0.001104 0.0005522
73 0.9994 0.001261 0.0006304
74 0.9993 0.001377 0.0006883
75 0.9991 0.001777 0.0008883
76 0.9991 0.001707 0.0008536
77 0.9989 0.002218 0.001109
78 0.999 0.002073 0.001037
79 0.9985 0.002921 0.00146
80 0.9986 0.002812 0.001406
81 0.9994 0.001217 0.0006085
82 0.9993 0.001332 0.000666
83 0.9991 0.001757 0.0008787
84 0.9995 0.0009491 0.0004745
85 0.9993 0.001329 0.0006647
86 0.9992 0.001698 0.0008488
87 0.9989 0.002219 0.00111
88 0.9992 0.001588 0.0007938
89 0.9991 0.00186 0.0009302
90 0.9992 0.001591 0.0007955
91 0.9991 0.001886 0.0009429
92 0.9988 0.002469 0.001235
93 0.9989 0.002191 0.001095
94 0.9991 0.001811 0.0009057
95 0.9987 0.002661 0.001331
96 0.9994 0.001175 0.0005873
97 0.9992 0.00167 0.0008349
98 0.9991 0.001701 0.0008506
99 0.9991 0.001743 0.0008713
100 0.9988 0.002472 0.001236
101 0.9984 0.003238 0.001619
102 0.9977 0.004539 0.00227
103 0.9972 0.005604 0.002802
104 0.9964 0.007122 0.003561
105 0.997 0.006065 0.003033
106 0.9964 0.007217 0.003608
107 0.9988 0.002477 0.001238
108 0.9982 0.003641 0.00182
109 0.9987 0.00264 0.00132
110 0.9986 0.002868 0.001434
111 0.9979 0.004245 0.002123
112 0.997 0.006062 0.003031
113 0.9978 0.00449 0.002245
114 0.9966 0.006745 0.003373
115 0.9968 0.006448 0.003224
116 0.9955 0.009059 0.004529
117 0.9946 0.01081 0.005403
118 0.9963 0.007464 0.003732
119 0.9944 0.0111 0.005552
120 0.9922 0.01558 0.007789
121 0.9888 0.02237 0.01119
122 0.9867 0.02651 0.01326
123 0.9814 0.03719 0.0186
124 0.9761 0.04776 0.02388
125 0.9708 0.05836 0.02918
126 0.9617 0.07664 0.03832
127 0.9595 0.08103 0.04052
128 0.9461 0.1078 0.05391
129 0.9275 0.145 0.07252
130 0.9167 0.1667 0.08335
131 0.8981 0.2037 0.1019
132 0.8839 0.2322 0.1161
133 0.8513 0.2974 0.1487
134 0.8763 0.2474 0.1237
135 0.9018 0.1963 0.09817
136 0.8785 0.2431 0.1215
137 0.8427 0.3147 0.1573
138 0.8294 0.3413 0.1706
139 0.7821 0.4357 0.2179
140 0.7595 0.4809 0.2405
141 0.7542 0.4917 0.2458
142 0.6923 0.6155 0.3077
143 0.6367 0.7265 0.3633
144 0.5802 0.8396 0.4198
145 0.5025 0.995 0.4975
146 0.7942 0.4117 0.2058
147 0.7431 0.5139 0.2569
148 0.7675 0.465 0.2325
149 0.6988 0.6024 0.3012
150 0.6092 0.7816 0.3908
151 0.8978 0.2045 0.1022
152 0.975 0.05005 0.02503
153 0.9796 0.04084 0.02042
154 0.974 0.05191 0.02595
155 0.96 0.08002 0.04001
156 0.9674 0.0651 0.03255


Meta Analysis of Goldfeld-Quandt test for Heteroskedasticity
Description# significant tests% significant testsOK/NOK
1% type I error level78 0.5166NOK
5% type I error level920.609272NOK
10% type I error level1020.675497NOK

\begin{tabular}{lllllllll}
\hline
Meta Analysis of Goldfeld-Quandt test for Heteroskedasticity \tabularnewline
Description & # significant tests & % significant tests & OK/NOK \tabularnewline
1% type I error level & 78 &  0.5166 & NOK \tabularnewline
5% type I error level & 92 & 0.609272 & NOK \tabularnewline
10% type I error level & 102 & 0.675497 & NOK \tabularnewline
\hline
\end{tabular}
%Source: https://freestatistics.org/blog/index.php?pk=&T=6

[TABLE]
[ROW][C]Meta Analysis of Goldfeld-Quandt test for Heteroskedasticity[/C][/ROW]
[ROW][C]Description[/C][C]# significant tests[/C][C]% significant tests[/C][C]OK/NOK[/C][/ROW]
[ROW][C]1% type I error level[/C][C]78[/C][C] 0.5166[/C][C]NOK[/C][/ROW]
[ROW][C]5% type I error level[/C][C]92[/C][C]0.609272[/C][C]NOK[/C][/ROW]
[ROW][C]10% type I error level[/C][C]102[/C][C]0.675497[/C][C]NOK[/C][/ROW]
[/TABLE]
Source: https://freestatistics.org/blog/index.php?pk=&T=6

Globally Unique Identifier (entire table): ba.freestatistics.org/blog/index.php?pk=&T=6

As an alternative you can also use a QR Code:  

The GUIDs for individual cells are displayed in the table below:

Meta Analysis of Goldfeld-Quandt test for Heteroskedasticity
Description# significant tests% significant testsOK/NOK
1% type I error level78 0.5166NOK
5% type I error level920.609272NOK
10% type I error level1020.675497NOK


Ramsey RESET F-Test for powers (2 and 3) of fitted values
> reset_test_fitted
	RESET test
data:  mylm
RESET = 0.79204, df1 = 2, df2 = 157, p-value = 0.4547
Ramsey RESET F-Test for powers (2 and 3) of regressors
> reset_test_regressors
	RESET test
data:  mylm
RESET = 1.2856, df1 = 4, df2 = 155, p-value = 0.278
Ramsey RESET F-Test for powers (2 and 3) of principal components
> reset_test_principal_components
	RESET test
data:  mylm
RESET = 0.27641, df1 = 2, df2 = 157, p-value = 0.7589

\begin{tabular}{lllllllll}
\hline
Ramsey RESET F-Test for powers (2 and 3) of fitted values \tabularnewline
> reset_test_fitted
	RESET test
data:  mylm
RESET = 0.79204, df1 = 2, df2 = 157, p-value = 0.4547
\tabularnewline Ramsey RESET F-Test for powers (2 and 3) of regressors \tabularnewline
> reset_test_regressors
	RESET test
data:  mylm
RESET = 1.2856, df1 = 4, df2 = 155, p-value = 0.278
\tabularnewline Ramsey RESET F-Test for powers (2 and 3) of principal components \tabularnewline
> reset_test_principal_components
	RESET test
data:  mylm
RESET = 0.27641, df1 = 2, df2 = 157, p-value = 0.7589
\tabularnewline \hline \end{tabular} %Source: https://freestatistics.org/blog/index.php?pk=&T=7

[TABLE]
[ROW][C]Ramsey RESET F-Test for powers (2 and 3) of fitted values[/C][/ROW]
[ROW][C]
> reset_test_fitted
	RESET test
data:  mylm
RESET = 0.79204, df1 = 2, df2 = 157, p-value = 0.4547
[/C][/ROW] [ROW][C]Ramsey RESET F-Test for powers (2 and 3) of regressors[/C][/ROW] [ROW][C]
> reset_test_regressors
	RESET test
data:  mylm
RESET = 1.2856, df1 = 4, df2 = 155, p-value = 0.278
[/C][/ROW] [ROW][C]Ramsey RESET F-Test for powers (2 and 3) of principal components[/C][/ROW] [ROW][C]
> reset_test_principal_components
	RESET test
data:  mylm
RESET = 0.27641, df1 = 2, df2 = 157, p-value = 0.7589
[/C][/ROW] [/TABLE] Source: https://freestatistics.org/blog/index.php?pk=&T=7

Globally Unique Identifier (entire table): ba.freestatistics.org/blog/index.php?pk=&T=7

As an alternative you can also use a QR Code:  

The GUIDs for individual cells are displayed in the table below:

Ramsey RESET F-Test for powers (2 and 3) of fitted values
> reset_test_fitted
	RESET test
data:  mylm
RESET = 0.79204, df1 = 2, df2 = 157, p-value = 0.4547
Ramsey RESET F-Test for powers (2 and 3) of regressors
> reset_test_regressors
	RESET test
data:  mylm
RESET = 1.2856, df1 = 4, df2 = 155, p-value = 0.278
Ramsey RESET F-Test for powers (2 and 3) of principal components
> reset_test_principal_components
	RESET test
data:  mylm
RESET = 0.27641, df1 = 2, df2 = 157, p-value = 0.7589


Variance Inflation Factors (Multicollinearity)
> vif
Bevr_Leeftijd        SKEOU1 
     1.000133      1.000133 

\begin{tabular}{lllllllll}
\hline
Variance Inflation Factors (Multicollinearity) \tabularnewline
> vif
Bevr_Leeftijd        SKEOU1 
     1.000133      1.000133 
\tabularnewline \hline \end{tabular} %Source: https://freestatistics.org/blog/index.php?pk=&T=8

[TABLE]
[ROW][C]Variance Inflation Factors (Multicollinearity)[/C][/ROW]
[ROW][C]
> vif
Bevr_Leeftijd        SKEOU1 
     1.000133      1.000133 
[/C][/ROW] [/TABLE] Source: https://freestatistics.org/blog/index.php?pk=&T=8

Globally Unique Identifier (entire table): ba.freestatistics.org/blog/index.php?pk=&T=8

As an alternative you can also use a QR Code:  

The GUIDs for individual cells are displayed in the table below:

Variance Inflation Factors (Multicollinearity)
> vif
Bevr_Leeftijd        SKEOU1 
     1.000133      1.000133 


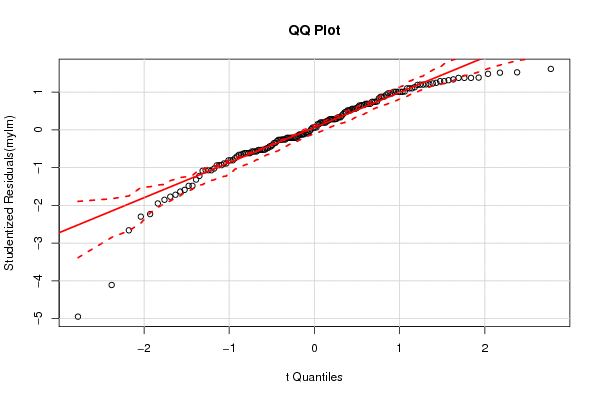
Parameters (Session):
par1 = two.sided12DefaultDefault11212121212111 ; par2 = 0.95112DoubleSingleDoubleDoubleDouble22Do not include Seasonal Dummies ; par3 = 000Pearson Chi-Squaredadditiveadditiveadditiveadditiveadditive0.990.99No Linear Trend ; par4 = 01121212121212two.sidedtwo.sided ; par5 = 1212unpairedunpaired ; par6 = White NoiseWhite Noise00 ; par7 = 0.950.95 ;
Parameters (R input):
par1 = 1 ; par2 = Do not include Seasonal Dummies ; par3 = No Linear Trend ; par4 = ; par5 = ;
R code (references can be found in the software module):
library(lattice)
library(lmtest)
library(car)
library(MASS)
n25 <- 25 #minimum number of obs. for Goldfeld-Quandt test
mywarning <- ''
par1 <- as.numeric(par1)
if(is.na(par1)) {
par1 <- 1
mywarning = 'Warning: you did not specify the column number of the endogenous series! The first column was selected by default.'
}
if (par4=='') par4 <- 0
par4 <- as.numeric(par4)
if (par5=='') par5 <- 0
par5 <- as.numeric(par5)
x <- na.omit(t(y))
k <- length(x[1,])
n <- length(x[,1])
x1 <- cbind(x[,par1], x[,1:k!=par1])
mycolnames <- c(colnames(x)[par1], colnames(x)[1:k!=par1])
colnames(x1) <- mycolnames #colnames(x)[par1]
x <- x1
if (par3 == 'First Differences'){
(n <- n -1)
x2 <- array(0, dim=c(n,k), dimnames=list(1:n, paste('(1-B)',colnames(x),sep='')))
for (i in 1:n) {
for (j in 1:k) {
x2[i,j] <- x[i+1,j] - x[i,j]
}
}
x <- x2
}
if (par3 == 'Seasonal Differences (s=12)'){
(n <- n - 12)
x2 <- array(0, dim=c(n,k), dimnames=list(1:n, paste('(1-B12)',colnames(x),sep='')))
for (i in 1:n) {
for (j in 1:k) {
x2[i,j] <- x[i+12,j] - x[i,j]
}
}
x <- x2
}
if (par3 == 'First and Seasonal Differences (s=12)'){
(n <- n -1)
x2 <- array(0, dim=c(n,k), dimnames=list(1:n, paste('(1-B)',colnames(x),sep='')))
for (i in 1:n) {
for (j in 1:k) {
x2[i,j] <- x[i+1,j] - x[i,j]
}
}
x <- x2
(n <- n - 12)
x2 <- array(0, dim=c(n,k), dimnames=list(1:n, paste('(1-B12)',colnames(x),sep='')))
for (i in 1:n) {
for (j in 1:k) {
x2[i,j] <- x[i+12,j] - x[i,j]
}
}
x <- x2
}
if(par4 > 0) {
x2 <- array(0, dim=c(n-par4,par4), dimnames=list(1:(n-par4), paste(colnames(x)[par1],'(t-',1:par4,')',sep='')))
for (i in 1:(n-par4)) {
for (j in 1:par4) {
x2[i,j] <- x[i+par4-j,par1]
}
}
x <- cbind(x[(par4+1):n,], x2)
n <- n - par4
}
if(par5 > 0) {
x2 <- array(0, dim=c(n-par5*12,par5), dimnames=list(1:(n-par5*12), paste(colnames(x)[par1],'(t-',1:par5,'s)',sep='')))
for (i in 1:(n-par5*12)) {
for (j in 1:par5) {
x2[i,j] <- x[i+par5*12-j*12,par1]
}
}
x <- cbind(x[(par5*12+1):n,], x2)
n <- n - par5*12
}
if (par2 == 'Include Monthly Dummies'){
x2 <- array(0, dim=c(n,11), dimnames=list(1:n, paste('M', seq(1:11), sep ='')))
for (i in 1:11){
x2[seq(i,n,12),i] <- 1
}
x <- cbind(x, x2)
}
if (par2 == 'Include Quarterly Dummies'){
x2 <- array(0, dim=c(n,3), dimnames=list(1:n, paste('Q', seq(1:3), sep ='')))
for (i in 1:3){
x2[seq(i,n,4),i] <- 1
}
x <- cbind(x, x2)
}
(k <- length(x[n,]))
if (par3 == 'Linear Trend'){
x <- cbind(x, c(1:n))
colnames(x)[k+1] <- 't'
}
print(x)
(k <- length(x[n,]))
head(x)
df <- as.data.frame(x)
(mylm <- lm(df))
(mysum <- summary(mylm))
if (n > n25) {
kp3 <- k + 3
nmkm3 <- n - k - 3
gqarr <- array(NA, dim=c(nmkm3-kp3+1,3))
numgqtests <- 0
numsignificant1 <- 0
numsignificant5 <- 0
numsignificant10 <- 0
for (mypoint in kp3:nmkm3) {
j <- 0
numgqtests <- numgqtests + 1
for (myalt in c('greater', 'two.sided', 'less')) {
j <- j + 1
gqarr[mypoint-kp3+1,j] <- gqtest(mylm, point=mypoint, alternative=myalt)$p.value
}
if (gqarr[mypoint-kp3+1,2] < 0.01) numsignificant1 <- numsignificant1 + 1
if (gqarr[mypoint-kp3+1,2] < 0.05) numsignificant5 <- numsignificant5 + 1
if (gqarr[mypoint-kp3+1,2] < 0.10) numsignificant10 <- numsignificant10 + 1
}
gqarr
}
bitmap(file='test0.png')
plot(x[,1], type='l', main='Actuals and Interpolation', ylab='value of Actuals and Interpolation (dots)', xlab='time or index')
points(x[,1]-mysum$resid)
grid()
dev.off()
bitmap(file='test1.png')
plot(mysum$resid, type='b', pch=19, main='Residuals', ylab='value of Residuals', xlab='time or index')
grid()
dev.off()
bitmap(file='test2.png')
sresid <- studres(mylm)
hist(sresid, freq=FALSE, main='Distribution of Studentized Residuals')
xfit<-seq(min(sresid),max(sresid),length=40)
yfit<-dnorm(xfit)
lines(xfit, yfit)
grid()
dev.off()
bitmap(file='test3.png')
densityplot(~mysum$resid,col='black',main='Residual Density Plot', xlab='values of Residuals')
dev.off()
bitmap(file='test4.png')
qqPlot(mylm, main='QQ Plot')
grid()
dev.off()
(myerror <- as.ts(mysum$resid))
bitmap(file='test5.png')
dum <- cbind(lag(myerror,k=1),myerror)
dum
dum1 <- dum[2:length(myerror),]
dum1
z <- as.data.frame(dum1)
print(z)
plot(z,main=paste('Residual Lag plot, lowess, and regression line'), ylab='values of Residuals', xlab='lagged values of Residuals')
lines(lowess(z))
abline(lm(z))
grid()
dev.off()
bitmap(file='test6.png')
acf(mysum$resid, lag.max=length(mysum$resid)/2, main='Residual Autocorrelation Function')
grid()
dev.off()
bitmap(file='test7.png')
pacf(mysum$resid, lag.max=length(mysum$resid)/2, main='Residual Partial Autocorrelation Function')
grid()
dev.off()
bitmap(file='test8.png')
opar <- par(mfrow = c(2,2), oma = c(0, 0, 1.1, 0))
plot(mylm, las = 1, sub='Residual Diagnostics')
par(opar)
dev.off()
if (n > n25) {
bitmap(file='test9.png')
plot(kp3:nmkm3,gqarr[,2], main='Goldfeld-Quandt test',ylab='2-sided p-value',xlab='breakpoint')
grid()
dev.off()
}
load(file='createtable')
a<-table.start()
a<-table.row.start(a)
a<-table.element(a, 'Multiple Linear Regression - Estimated Regression Equation', 1, TRUE)
a<-table.row.end(a)
myeq <- colnames(x)[1]
myeq <- paste(myeq, '[t] = ', sep='')
for (i in 1:k){
if (mysum$coefficients[i,1] > 0) myeq <- paste(myeq, '+', '')
myeq <- paste(myeq, signif(mysum$coefficients[i,1],6), sep=' ')
if (rownames(mysum$coefficients)[i] != '(Intercept)') {
myeq <- paste(myeq, rownames(mysum$coefficients)[i], sep='')
if (rownames(mysum$coefficients)[i] != 't') myeq <- paste(myeq, '[t]', sep='')
}
}
myeq <- paste(myeq, ' + e[t]')
a<-table.row.start(a)
a<-table.element(a, myeq)
a<-table.row.end(a)
a<-table.row.start(a)
a<-table.element(a, mywarning)
a<-table.row.end(a)
a<-table.end(a)
table.save(a,file='mytable1.tab')
a<-table.start()
a<-table.row.start(a)
a<-table.element(a,'Multiple Linear Regression - Ordinary Least Squares', 6, TRUE)
a<-table.row.end(a)
a<-table.row.start(a)
a<-table.element(a,'Variable',header=TRUE)
a<-table.element(a,'Parameter',header=TRUE)
a<-table.element(a,'S.D.',header=TRUE)
a<-table.element(a,'T-STAT
H0: parameter = 0',header=TRUE)
a<-table.element(a,'2-tail p-value',header=TRUE)
a<-table.element(a,'1-tail p-value',header=TRUE)
a<-table.row.end(a)
for (i in 1:k){
a<-table.row.start(a)
a<-table.element(a,rownames(mysum$coefficients)[i],header=TRUE)
a<-table.element(a,formatC(signif(mysum$coefficients[i,1],5),format='g',flag='+'))
a<-table.element(a,formatC(signif(mysum$coefficients[i,2],5),format='g',flag=' '))
a<-table.element(a,formatC(signif(mysum$coefficients[i,3],4),format='e',flag='+'))
a<-table.element(a,formatC(signif(mysum$coefficients[i,4],4),format='g',flag=' '))
a<-table.element(a,formatC(signif(mysum$coefficients[i,4]/2,4),format='g',flag=' '))
a<-table.row.end(a)
}
a<-table.end(a)
table.save(a,file='mytable2.tab')
a<-table.start()
a<-table.row.start(a)
a<-table.element(a, 'Multiple Linear Regression - Regression Statistics', 2, TRUE)
a<-table.row.end(a)
a<-table.row.start(a)
a<-table.element(a, 'Multiple R',1,TRUE)
a<-table.element(a,formatC(signif(sqrt(mysum$r.squared),6),format='g',flag=' '))
a<-table.row.end(a)
a<-table.row.start(a)
a<-table.element(a, 'R-squared',1,TRUE)
a<-table.element(a,formatC(signif(mysum$r.squared,6),format='g',flag=' '))
a<-table.row.end(a)
a<-table.row.start(a)
a<-table.element(a, 'Adjusted R-squared',1,TRUE)
a<-table.element(a,formatC(signif(mysum$adj.r.squared,6),format='g',flag=' '))
a<-table.row.end(a)
a<-table.row.start(a)
a<-table.element(a, 'F-TEST (value)',1,TRUE)
a<-table.element(a,formatC(signif(mysum$fstatistic[1],6),format='g',flag=' '))
a<-table.row.end(a)
a<-table.row.start(a)
a<-table.element(a, 'F-TEST (DF numerator)',1,TRUE)
a<-table.element(a, signif(mysum$fstatistic[2],6))
a<-table.row.end(a)
a<-table.row.start(a)
a<-table.element(a, 'F-TEST (DF denominator)',1,TRUE)
a<-table.element(a, signif(mysum$fstatistic[3],6))
a<-table.row.end(a)
a<-table.row.start(a)
a<-table.element(a, 'p-value',1,TRUE)
a<-table.element(a,formatC(signif(1-pf(mysum$fstatistic[1],mysum$fstatistic[2],mysum$fstatistic[3]),6),format='g',flag=' '))
a<-table.row.end(a)
a<-table.row.start(a)
a<-table.element(a, 'Multiple Linear Regression - Residual Statistics', 2, TRUE)
a<-table.row.end(a)
a<-table.row.start(a)
a<-table.element(a, 'Residual Standard Deviation',1,TRUE)
a<-table.element(a,formatC(signif(mysum$sigma,6),format='g',flag=' '))
a<-table.row.end(a)
a<-table.row.start(a)
a<-table.element(a, 'Sum Squared Residuals',1,TRUE)
a<-table.element(a,formatC(signif(sum(myerror*myerror),6),format='g',flag=' '))
a<-table.row.end(a)
a<-table.end(a)
table.save(a,file='mytable3.tab')
myr <- as.numeric(mysum$resid)
myr
if(n < 200) {
a<-table.start()
a<-table.row.start(a)
a<-table.element(a, 'Multiple Linear Regression - Actuals, Interpolation, and Residuals', 4, TRUE)
a<-table.row.end(a)
a<-table.row.start(a)
a<-table.element(a, 'Time or Index', 1, TRUE)
a<-table.element(a, 'Actuals', 1, TRUE)
a<-table.element(a, 'Interpolation
Forecast', 1, TRUE)
a<-table.element(a, 'Residuals
Prediction Error', 1, TRUE)
a<-table.row.end(a)
for (i in 1:n) {
a<-table.row.start(a)
a<-table.element(a,i, 1, TRUE)
a<-table.element(a,formatC(signif(x[i],6),format='g',flag=' '))
a<-table.element(a,formatC(signif(x[i]-mysum$resid[i],6),format='g',flag=' '))
a<-table.element(a,formatC(signif(mysum$resid[i],6),format='g',flag=' '))
a<-table.row.end(a)
}
a<-table.end(a)
table.save(a,file='mytable4.tab')
if (n > n25) {
a<-table.start()
a<-table.row.start(a)
a<-table.element(a,'Goldfeld-Quandt test for Heteroskedasticity',4,TRUE)
a<-table.row.end(a)
a<-table.row.start(a)
a<-table.element(a,'p-values',header=TRUE)
a<-table.element(a,'Alternative Hypothesis',3,header=TRUE)
a<-table.row.end(a)
a<-table.row.start(a)
a<-table.element(a,'breakpoint index',header=TRUE)
a<-table.element(a,'greater',header=TRUE)
a<-table.element(a,'2-sided',header=TRUE)
a<-table.element(a,'less',header=TRUE)
a<-table.row.end(a)
for (mypoint in kp3:nmkm3) {
a<-table.row.start(a)
a<-table.element(a,mypoint,header=TRUE)
a<-table.element(a,formatC(signif(gqarr[mypoint-kp3+1,1],6),format='g',flag=' '))
a<-table.element(a,formatC(signif(gqarr[mypoint-kp3+1,2],6),format='g',flag=' '))
a<-table.element(a,formatC(signif(gqarr[mypoint-kp3+1,3],6),format='g',flag=' '))
a<-table.row.end(a)
}
a<-table.end(a)
table.save(a,file='mytable5.tab')
a<-table.start()
a<-table.row.start(a)
a<-table.element(a,'Meta Analysis of Goldfeld-Quandt test for Heteroskedasticity',4,TRUE)
a<-table.row.end(a)
a<-table.row.start(a)
a<-table.element(a,'Description',header=TRUE)
a<-table.element(a,'# significant tests',header=TRUE)
a<-table.element(a,'% significant tests',header=TRUE)
a<-table.element(a,'OK/NOK',header=TRUE)
a<-table.row.end(a)
a<-table.row.start(a)
a<-table.element(a,'1% type I error level',header=TRUE)
a<-table.element(a,signif(numsignificant1,6))
a<-table.element(a,formatC(signif(numsignificant1/numgqtests,6),format='g',flag=' '))
if (numsignificant1/numgqtests < 0.01) dum <- 'OK' else dum <- 'NOK'
a<-table.element(a,dum)
a<-table.row.end(a)
a<-table.row.start(a)
a<-table.element(a,'5% type I error level',header=TRUE)
a<-table.element(a,signif(numsignificant5,6))
a<-table.element(a,signif(numsignificant5/numgqtests,6))
if (numsignificant5/numgqtests < 0.05) dum <- 'OK' else dum <- 'NOK'
a<-table.element(a,dum)
a<-table.row.end(a)
a<-table.row.start(a)
a<-table.element(a,'10% type I error level',header=TRUE)
a<-table.element(a,signif(numsignificant10,6))
a<-table.element(a,signif(numsignificant10/numgqtests,6))
if (numsignificant10/numgqtests < 0.1) dum <- 'OK' else dum <- 'NOK'
a<-table.element(a,dum)
a<-table.row.end(a)
a<-table.end(a)
table.save(a,file='mytable6.tab')
}
}
a<-table.start()
a<-table.row.start(a)
a<-table.element(a,'Ramsey RESET F-Test for powers (2 and 3) of fitted values',1,TRUE)
a<-table.row.end(a)
a<-table.row.start(a)
reset_test_fitted <- resettest(mylm,power=2:3,type='fitted')
a<-table.element(a,paste('
',RC.texteval('reset_test_fitted'),'
',sep=''))
a<-table.row.end(a)
a<-table.row.start(a)
a<-table.element(a,'Ramsey RESET F-Test for powers (2 and 3) of regressors',1,TRUE)
a<-table.row.end(a)
a<-table.row.start(a)
reset_test_regressors <- resettest(mylm,power=2:3,type='regressor')
a<-table.element(a,paste('
',RC.texteval('reset_test_regressors'),'
',sep=''))
a<-table.row.end(a)
a<-table.row.start(a)
a<-table.element(a,'Ramsey RESET F-Test for powers (2 and 3) of principal components',1,TRUE)
a<-table.row.end(a)
a<-table.row.start(a)
reset_test_principal_components <- resettest(mylm,power=2:3,type='princomp')
a<-table.element(a,paste('
',RC.texteval('reset_test_principal_components'),'
',sep=''))
a<-table.row.end(a)
a<-table.end(a)
table.save(a,file='mytable8.tab')
a<-table.start()
a<-table.row.start(a)
a<-table.element(a,'Variance Inflation Factors (Multicollinearity)',1,TRUE)
a<-table.row.end(a)
a<-table.row.start(a)
vif <- vif(mylm)
a<-table.element(a,paste('
',RC.texteval('vif'),'
',sep=''))
a<-table.row.end(a)
a<-table.end(a)
table.save(a,file='mytable9.tab')