Free Statistics

of Irreproducible Research!

Author's title

Author*The author of this computation has been verified*
R Software Modulerwasp_concentration.wasp
Title produced by softwareConcentration and Inequality
Date of computationMon, 23 Jan 2017 10:43:14 +0100
Cite this page as followsStatistical Computations at FreeStatistics.org, Office for Research Development and Education, URL https://freestatistics.org/blog/index.php?v=date/2017/Jan/23/t1485164642a9pj9abdcoika4o.htm/, Retrieved Wed, 15 May 2024 13:35:56 +0000
Statistical Computations at FreeStatistics.org, Office for Research Development and Education, URL https://freestatistics.org/blog/index.php?pk=304604, Retrieved Wed, 15 May 2024 13:35:56 +0000
QR Codes:

Original text written by user:
IsPrivate?No (this computation is public)
User-defined keywords
Estimated Impact76
Family? (F = Feedback message, R = changed R code, M = changed R Module, P = changed Parameters, D = changed Data)
-       [Concentration and Inequality] [] [2017-01-23 09:43:14] [31f35a84f393bb723d2a4e693b992cea] [Current]
Feedback Forum

Post a new message
Dataseries X:
10.24
10.89
9
12.25
13.69
7.29
12.96
12.25
14.44
11.56
13.69
12.25
7.84
14.44
18.49
10.89
12.96
12.96
10.89
7.84


Summary of computational transaction
Raw Input view raw input (R code)
Raw Outputview raw output of R engine
Computing time1 seconds
R ServerBig Analytics Cloud Computing Center

\begin{tabular}{lllllllll}
\hline
Summary of computational transaction \tabularnewline
Raw Input view raw input (R code)  \tabularnewline
Raw Outputview raw output of R engine  \tabularnewline
Computing time1 seconds \tabularnewline
R ServerBig Analytics Cloud Computing Center \tabularnewline
\hline
\end{tabular}
%Source: https://freestatistics.org/blog/index.php?pk=304604&T=0

[TABLE]
[ROW]
Summary of computational transaction[/C][/ROW] [ROW]Raw Input[/C] view raw input (R code) [/C][/ROW] [ROW]Raw Output[/C]view raw output of R engine [/C][/ROW] [ROW]Computing time[/C]1 seconds[/C][/ROW] [ROW]R Server[/C]Big Analytics Cloud Computing Center[/C][/ROW] [/TABLE] Source: https://freestatistics.org/blog/index.php?pk=304604&T=0

Globally Unique Identifier (entire table): ba.freestatistics.org/blog/index.php?pk=304604&T=0

As an alternative you can also use a QR Code:  

The GUIDs for individual cells are displayed in the table below:

Summary of computational transaction
Raw Input view raw input (R code)
Raw Outputview raw output of R engine
Computing time1 seconds
R ServerBig Analytics Cloud Computing Center


Concentration - Ungrouped Data
MeasureValue
Number of Categories20
Maximum Entropy2.99573227355399
Entropy2.97152951189369
Normalised Entropy0.991920919678315
Max. Entropy - Entropy0.0242027616603058
Theil Entropy Index0.0242027616603058
Exponential Index0.0512249012876498
Herfindahl0.0524065628722538
Normalised Herfindahl0.00253322407605663
Rosenbluth0.0568194359803644
Gini0.120019424035132
Concentration0.126336235826455
Ricci-Schutz (Pietra)0.0849970441685668
Atkinson0.0122118064352671
Kolm2.47926745393143
Coefficient of Variation0.219388371262189
Squared Coefficient of Variation0.048131257445076

\begin{tabular}{lllllllll}
\hline
Concentration - Ungrouped Data \tabularnewline
Measure & Value \tabularnewline
Number of Categories & 20 \tabularnewline
Maximum Entropy & 2.99573227355399 \tabularnewline
Entropy & 2.97152951189369 \tabularnewline
Normalised Entropy & 0.991920919678315 \tabularnewline
Max. Entropy - Entropy & 0.0242027616603058 \tabularnewline
Theil Entropy Index & 0.0242027616603058 \tabularnewline
Exponential Index & 0.0512249012876498 \tabularnewline
Herfindahl & 0.0524065628722538 \tabularnewline
Normalised Herfindahl & 0.00253322407605663 \tabularnewline
Rosenbluth & 0.0568194359803644 \tabularnewline
Gini & 0.120019424035132 \tabularnewline
Concentration & 0.126336235826455 \tabularnewline
Ricci-Schutz (Pietra) & 0.0849970441685668 \tabularnewline
Atkinson & 0.0122118064352671 \tabularnewline
Kolm & 2.47926745393143 \tabularnewline
Coefficient of Variation & 0.219388371262189 \tabularnewline
Squared Coefficient of Variation & 0.048131257445076 \tabularnewline
\hline
\end{tabular}
%Source: https://freestatistics.org/blog/index.php?pk=304604&T=1

[TABLE]
[ROW][C]Concentration - Ungrouped Data[/C][/ROW]
[ROW][C]Measure[/C][C]Value[/C][/ROW]
[ROW][C]Number of Categories[/C][C]20[/C][/ROW]
[ROW][C]Maximum Entropy[/C][C]2.99573227355399[/C][/ROW]
[ROW][C]Entropy[/C][C]2.97152951189369[/C][/ROW]
[ROW][C]Normalised Entropy[/C][C]0.991920919678315[/C][/ROW]
[ROW][C]Max. Entropy - Entropy[/C][C]0.0242027616603058[/C][/ROW]
[ROW][C]Theil Entropy Index[/C][C]0.0242027616603058[/C][/ROW]
[ROW][C]Exponential Index[/C][C]0.0512249012876498[/C][/ROW]
[ROW][C]Herfindahl[/C][C]0.0524065628722538[/C][/ROW]
[ROW][C]Normalised Herfindahl[/C][C]0.00253322407605663[/C][/ROW]
[ROW][C]Rosenbluth[/C][C]0.0568194359803644[/C][/ROW]
[ROW][C]Gini[/C][C]0.120019424035132[/C][/ROW]
[ROW][C]Concentration[/C][C]0.126336235826455[/C][/ROW]
[ROW][C]Ricci-Schutz (Pietra)[/C][C]0.0849970441685668[/C][/ROW]
[ROW][C]Atkinson[/C][C]0.0122118064352671[/C][/ROW]
[ROW][C]Kolm[/C][C]2.47926745393143[/C][/ROW]
[ROW][C]Coefficient of Variation[/C][C]0.219388371262189[/C][/ROW]
[ROW][C]Squared Coefficient of Variation[/C][C]0.048131257445076[/C][/ROW]
[/TABLE]
Source: https://freestatistics.org/blog/index.php?pk=304604&T=1

Globally Unique Identifier (entire table): ba.freestatistics.org/blog/index.php?pk=304604&T=1

As an alternative you can also use a QR Code:  

The GUIDs for individual cells are displayed in the table below:

Concentration - Ungrouped Data
MeasureValue
Number of Categories20
Maximum Entropy2.99573227355399
Entropy2.97152951189369
Normalised Entropy0.991920919678315
Max. Entropy - Entropy0.0242027616603058
Theil Entropy Index0.0242027616603058
Exponential Index0.0512249012876498
Herfindahl0.0524065628722538
Normalised Herfindahl0.00253322407605663
Rosenbluth0.0568194359803644
Gini0.120019424035132
Concentration0.126336235826455
Ricci-Schutz (Pietra)0.0849970441685668
Atkinson0.0122118064352671
Kolm2.47926745393143
Coefficient of Variation0.219388371262189
Squared Coefficient of Variation0.048131257445076


Parameters (Session):
Parameters (R input):
R code (references can be found in the software module):
library(ineq)
my_minimum <- min(x)
if(my_minimum < 0) {
stop('Negative values are not allowed.')
}
myLength <- length(x)
myMaximumEntropy <- log(myLength)
mySum <- sum(x)
myProportion <- x/mySum
myEntropy <- -sum(myProportion * log(myProportion))
myNormalizedEntropy <- myEntropy / myMaximumEntropy
myDifference <- myMaximumEntropy - myEntropy
myTheilEntropyIndex <- entropy(x,parameter=1,na.rm=T)
myExponentialIndex <- exp(-myEntropy)
myHerfindahlMeasure <- sum(myProportion^2)
myHerfindahl <- conc(x,type='Herfindahl',na.rm=T)
myRosenbluth <- conc(x,type='Rosenbluth',na.rm=T)
myNormalizedHerfindahlMeasure <- (myHerfindahlMeasure - 1/myLength) / (1 - 1/myLength)
myGini <- Gini(x,na.rm=T)
myConcentrationCoefficient <- myLength/(myLength -1)*myGini
myRS <- RS(x,na.rm=T)
myAtkinson <- Atkinson(x,na.rm=T)
myKolm <- Kolm(x,na.rm=T)
myCoefficientOfVariation <- var.coeff(x,square=F,na.rm=T)
mySquaredCoefficientOfVariation <- var.coeff(x,square=T,na.rm=T)
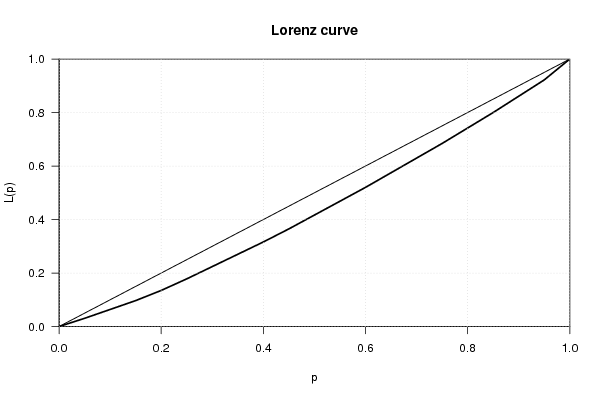
bitmap(file='plot1.png')
plot(Lc(x))
grid()
dev.off()
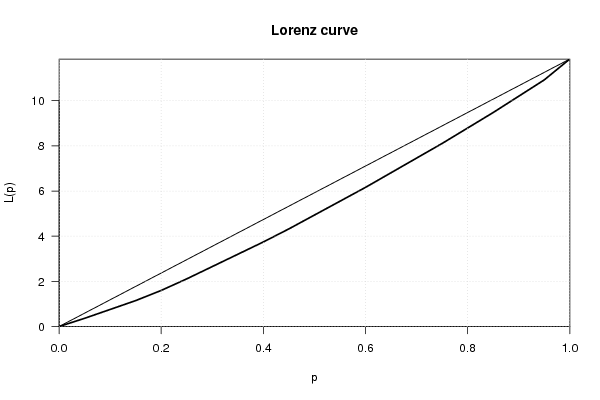
bitmap(file='plot2.png')
plot(Lc(x),general=T)
grid()
dev.off()
load(file='createtable')
a<-table.start()
a<-table.row.start(a)
a<-table.element(a,'Concentration - Ungrouped Data',2,TRUE)
a<-table.row.end(a)
a<-table.row.start(a)
a<-table.element(a,'Measure',header=TRUE)
a<-table.element(a,'Value',header=TRUE)
a<-table.row.end(a)
a<-table.row.start(a)
a<-table.element(a,'Number of Categories',header=F)
a<-table.element(a,myLength,header=F)
a<-table.row.end(a)
a<-table.row.start(a)
a<-table.element(a,'Maximum Entropy',header=F)
a<-table.element(a,myMaximumEntropy,header=F)
a<-table.row.end(a)
a<-table.row.start(a)
a<-table.element(a,'Entropy',header=F)
a<-table.element(a,myEntropy,header=F)
a<-table.row.end(a)
a<-table.row.start(a)
a<-table.element(a,'Normalised Entropy',header=F)
a<-table.element(a,myNormalizedEntropy,header=F)
a<-table.row.end(a)
a<-table.row.start(a)
a<-table.element(a,'Max. Entropy - Entropy',header=F)
a<-table.element(a,myDifference,header=F)
a<-table.row.end(a)
a<-table.row.start(a)
a<-table.element(a,'Theil Entropy Index',header=F)
a<-table.element(a,myTheilEntropyIndex,header=F)
a<-table.row.end(a)
a<-table.row.start(a)
a<-table.element(a,'Exponential Index',header=F)
a<-table.element(a,myExponentialIndex,header=F)
a<-table.row.end(a)
a<-table.row.start(a)
a<-table.element(a,'Herfindahl',header=F)
a<-table.element(a,myHerfindahl,header=F)
a<-table.row.end(a)
a<-table.row.start(a)
a<-table.element(a,'Normalised Herfindahl',header=F)
a<-table.element(a,myNormalizedHerfindahlMeasure,header=F)
a<-table.row.end(a)
a<-table.row.start(a)
a<-table.element(a,'Rosenbluth',header=F)
a<-table.element(a,myRosenbluth,header=F)
a<-table.row.end(a)
a<-table.row.start(a)
a<-table.element(a,'Gini',header=F)
a<-table.element(a,myGini,header=F)
a<-table.row.end(a)
a<-table.row.start(a)
a<-table.element(a,'Concentration',header=F)
a<-table.element(a,myConcentrationCoefficient,header=F)
a<-table.row.end(a)
a<-table.row.start(a)
a<-table.element(a,'Ricci-Schutz (Pietra)',header=F)
a<-table.element(a,myRS,header=F)
a<-table.row.end(a)
a<-table.row.start(a)
a<-table.element(a,'Atkinson',header=F)
a<-table.element(a,myAtkinson,header=F)
a<-table.row.end(a)
a<-table.row.start(a)
a<-table.element(a,'Kolm',header=F)
a<-table.element(a,myKolm,header=F)
a<-table.row.end(a)
a<-table.row.start(a)
a<-table.element(a,'Coefficient of Variation',header=F)
a<-table.element(a,myCoefficientOfVariation,header=F)
a<-table.row.end(a)
a<-table.row.start(a)
a<-table.element(a,'Squared Coefficient of Variation',header=F)
a<-table.element(a,mySquaredCoefficientOfVariation,header=F)
a<-table.row.end(a)
a<-table.end(a)
table.save(a,file='mytable.tab')