Free Statistics

of Irreproducible Research!

Author's title

Author*The author of this computation has been verified*
R Software Modulerwasp_multipleregression.wasp
Title produced by softwareMultiple Regression
Date of computationMon, 23 Jan 2017 10:36:48 +0100
Cite this page as followsStatistical Computations at FreeStatistics.org, Office for Research Development and Education, URL https://freestatistics.org/blog/index.php?v=date/2017/Jan/23/t1485164482tzt1gcjfyhdbbky.htm/, Retrieved Wed, 15 May 2024 02:55:59 +0000
Statistical Computations at FreeStatistics.org, Office for Research Development and Education, URL https://freestatistics.org/blog/index.php?pk=304564, Retrieved Wed, 15 May 2024 02:55:59 +0000
QR Codes:

Original text written by user:
IsPrivate?No (this computation is public)
User-defined keywords
Estimated Impact86
Family? (F = Feedback message, R = changed R code, M = changed R Module, P = changed Parameters, D = changed Data)
-       [Multiple Regression] [Vraag 11] [2017-01-23 09:36:48] [3146b6c9a81fba6ba78c11f749c05198] [Current]
Feedback Forum

Post a new message
Dataseries X:
14 22 4
19 24 5
17 21 4
17 21 3
15 24 4
20 20 3
15 22 3
19 20 3
15 19 4
15 23 4
19 21 4
NA 19 4
20 19 4
18 21 3
15 21 4
14 22 3
20 22 3
NA 19 NA
16 21 5
16 21 4
16 21 3
10 20 4
19 22 4
19 22 4
16 24 4
15 21 3
18 19 3
17 19 4
19 23 2
17 21 5
NA 21 4
19 19 4
20 21 5
5 19 4
19 21 2
16 21 4
15 23 3
16 19 4
18 19 4
16 19 4
15 18 5
17 22 4
NA 18 3
20 22 5
19 18 5
7 22 4
13 22 4
16 19 3
16 22 4
NA 25 2
18 19 4
18 19 5
16 19 5
17 19 4
19 21 4
16 21 4
19 20 3
13 19 3
16 19 4
13 22 4
12 26 5
17 19 2
17 21 4
17 21 3
16 20 4
16 23 4
14 22 4
16 22 4
13 22 5
16 21 3
14 21 3
20 22 4
12 23 4
13 18 4
18 24 4
14 22 3
19 21 4
18 21 3
14 21 3
18 23 4
19 21 4
15 23 3
14 21 4
17 19 4
19 21 4
13 21 5
19 21 5
18 23 4
20 23 3
15 20 3
15 20 4
15 19 4
20 23 4
15 22 4
19 19 4
18 23 3
18 22 4
15 22 5
20 21 5
17 21 4
12 21 3
18 21 5
19 22 4
20 25 5
NA 21 3
17 23 5
15 19 4
16 22 4
18 20 4
18 21 4
14 25 3
15 21 4
12 19 4
17 23 3
14 22 4
18 21 3
17 24 4
17 21 5
20 19 5
16 18 4
14 19 4
15 20 3
18 19 4
20 22 4
17 21 4
17 22 3
17 24 4
17 28 4
15 19 3
17 18 4
18 23 3
17 19 4
20 23 5
15 19 2
16 22 3
15 21 4
18 19 5
11 22 NA
15 21 4
18 23 5
20 22 4
19 19 4
14 19 3
16 21 4
15 22 4
17 21 4
18 20 4
20 23 5
17 22 4
18 23 4
15 22 3
16 21 4
11 20 4
15 18 4
18 18 3
17 20 4
16 19 5
12 21 4
19 24 2
18 19 4
15 20 4
17 19 4
19 23 4
18 22 5
19 21 5
16 24 3
16 21 4
16 21 4
14 22 2


Summary of computational transaction
Raw Input view raw input (R code)
Raw Outputview raw output of R engine
Computing time8 seconds
R ServerBig Analytics Cloud Computing Center

\begin{tabular}{lllllllll}
\hline
Summary of computational transaction \tabularnewline
Raw Input view raw input (R code)  \tabularnewline
Raw Outputview raw output of R engine  \tabularnewline
Computing time8 seconds \tabularnewline
R ServerBig Analytics Cloud Computing Center \tabularnewline
\hline
\end{tabular}
%Source: https://freestatistics.org/blog/index.php?pk=304564&T=0

[TABLE]
[ROW]
Summary of computational transaction[/C][/ROW] [ROW]Raw Input[/C] view raw input (R code) [/C][/ROW] [ROW]Raw Output[/C]view raw output of R engine [/C][/ROW] [ROW]Computing time[/C]8 seconds[/C][/ROW] [ROW]R Server[/C]Big Analytics Cloud Computing Center[/C][/ROW] [/TABLE] Source: https://freestatistics.org/blog/index.php?pk=304564&T=0

Globally Unique Identifier (entire table): ba.freestatistics.org/blog/index.php?pk=304564&T=0

As an alternative you can also use a QR Code:  

The GUIDs for individual cells are displayed in the table below:

Summary of computational transaction
Raw Input view raw input (R code)
Raw Outputview raw output of R engine
Computing time8 seconds
R ServerBig Analytics Cloud Computing Center


Multiple Linear Regression - Estimated Regression Equation
ITHSUM[t] = + 17.5662 + 0.13258Bevr_Leeftijd[t] + 0.448847SKEOU1[t] -0.0709055`ITHSUM(t-1)`[t] -0.120619`ITHSUM(t-2)`[t] -0.0806693`ITHSUM(t-3)`[t] -0.0465023`ITHSUM(t-4)`[t] -0.0320619`ITHSUM(t-5)`[t] -0.0430093`ITHSUM(t-6)`[t] + 0.000148374`ITHSUM(t-7)`[t] + 0.0453525`ITHSUM(t-8)`[t] -0.0250929`ITHSUM(t-9)`[t] -0.0462852`ITHSUM(t-10)`[t] + 0.168037`ITHSUM(t-11)`[t] -0.0917857`ITHSUM(t-12)`[t] + e[t]

\begin{tabular}{lllllllll}
\hline
Multiple Linear Regression - Estimated Regression Equation \tabularnewline
ITHSUM[t] =  +  17.5662 +  0.13258Bevr_Leeftijd[t] +  0.448847SKEOU1[t] -0.0709055`ITHSUM(t-1)`[t] -0.120619`ITHSUM(t-2)`[t] -0.0806693`ITHSUM(t-3)`[t] -0.0465023`ITHSUM(t-4)`[t] -0.0320619`ITHSUM(t-5)`[t] -0.0430093`ITHSUM(t-6)`[t] +  0.000148374`ITHSUM(t-7)`[t] +  0.0453525`ITHSUM(t-8)`[t] -0.0250929`ITHSUM(t-9)`[t] -0.0462852`ITHSUM(t-10)`[t] +  0.168037`ITHSUM(t-11)`[t] -0.0917857`ITHSUM(t-12)`[t]  + e[t] \tabularnewline
 \tabularnewline
\hline
\end{tabular}
%Source: https://freestatistics.org/blog/index.php?pk=304564&T=1

[TABLE]
[ROW][C]Multiple Linear Regression - Estimated Regression Equation[/C][/ROW]
[ROW][C]ITHSUM[t] =  +  17.5662 +  0.13258Bevr_Leeftijd[t] +  0.448847SKEOU1[t] -0.0709055`ITHSUM(t-1)`[t] -0.120619`ITHSUM(t-2)`[t] -0.0806693`ITHSUM(t-3)`[t] -0.0465023`ITHSUM(t-4)`[t] -0.0320619`ITHSUM(t-5)`[t] -0.0430093`ITHSUM(t-6)`[t] +  0.000148374`ITHSUM(t-7)`[t] +  0.0453525`ITHSUM(t-8)`[t] -0.0250929`ITHSUM(t-9)`[t] -0.0462852`ITHSUM(t-10)`[t] +  0.168037`ITHSUM(t-11)`[t] -0.0917857`ITHSUM(t-12)`[t]  + e[t][/C][/ROW]
[ROW][C][/C][/ROW]
[/TABLE]
Source: https://freestatistics.org/blog/index.php?pk=304564&T=1

Globally Unique Identifier (entire table): ba.freestatistics.org/blog/index.php?pk=304564&T=1

As an alternative you can also use a QR Code:  

The GUIDs for individual cells are displayed in the table below:

Multiple Linear Regression - Estimated Regression Equation
ITHSUM[t] = + 17.5662 + 0.13258Bevr_Leeftijd[t] + 0.448847SKEOU1[t] -0.0709055`ITHSUM(t-1)`[t] -0.120619`ITHSUM(t-2)`[t] -0.0806693`ITHSUM(t-3)`[t] -0.0465023`ITHSUM(t-4)`[t] -0.0320619`ITHSUM(t-5)`[t] -0.0430093`ITHSUM(t-6)`[t] + 0.000148374`ITHSUM(t-7)`[t] + 0.0453525`ITHSUM(t-8)`[t] -0.0250929`ITHSUM(t-9)`[t] -0.0462852`ITHSUM(t-10)`[t] + 0.168037`ITHSUM(t-11)`[t] -0.0917857`ITHSUM(t-12)`[t] + e[t]


Multiple Linear Regression - Ordinary Least Squares
VariableParameterS.D.T-STATH0: parameter = 02-tail p-value1-tail p-value
(Intercept)+17.57 6.347+2.7680e+00 0.006439 0.00322
Bevr_Leeftijd+0.1326 0.1191+1.1140e+00 0.2674 0.1337
SKEOU1+0.4489 0.2852+1.5740e+00 0.1179 0.05895
`ITHSUM(t-1)`-0.0709 0.085-8.3410e-01 0.4057 0.2028
`ITHSUM(t-2)`-0.1206 0.08259-1.4600e+00 0.1465 0.07325
`ITHSUM(t-3)`-0.08067 0.08333-9.6810e-01 0.3347 0.1674
`ITHSUM(t-4)`-0.0465 0.08407-5.5310e-01 0.5811 0.2905
`ITHSUM(t-5)`-0.03206 0.08383-3.8250e-01 0.7027 0.3514
`ITHSUM(t-6)`-0.04301 0.08366-5.1410e-01 0.608 0.304
`ITHSUM(t-7)`+0.0001484 0.08399+1.7670e-03 0.9986 0.4993
`ITHSUM(t-8)`+0.04535 0.08337+5.4400e-01 0.5873 0.2937
`ITHSUM(t-9)`-0.02509 0.08386-2.9920e-01 0.7652 0.3826
`ITHSUM(t-10)`-0.04628 0.08352-5.5420e-01 0.5804 0.2902
`ITHSUM(t-11)`+0.168 0.08312+2.0220e+00 0.04519 0.02259
`ITHSUM(t-12)`-0.09179 0.08401-1.0930e+00 0.2765 0.1383

\begin{tabular}{lllllllll}
\hline
Multiple Linear Regression - Ordinary Least Squares \tabularnewline
Variable & Parameter & S.D. & T-STATH0: parameter = 0 & 2-tail p-value & 1-tail p-value \tabularnewline
(Intercept) & +17.57 &  6.347 & +2.7680e+00 &  0.006439 &  0.00322 \tabularnewline
Bevr_Leeftijd & +0.1326 &  0.1191 & +1.1140e+00 &  0.2674 &  0.1337 \tabularnewline
SKEOU1 & +0.4489 &  0.2852 & +1.5740e+00 &  0.1179 &  0.05895 \tabularnewline
`ITHSUM(t-1)` & -0.0709 &  0.085 & -8.3410e-01 &  0.4057 &  0.2028 \tabularnewline
`ITHSUM(t-2)` & -0.1206 &  0.08259 & -1.4600e+00 &  0.1465 &  0.07325 \tabularnewline
`ITHSUM(t-3)` & -0.08067 &  0.08333 & -9.6810e-01 &  0.3347 &  0.1674 \tabularnewline
`ITHSUM(t-4)` & -0.0465 &  0.08407 & -5.5310e-01 &  0.5811 &  0.2905 \tabularnewline
`ITHSUM(t-5)` & -0.03206 &  0.08383 & -3.8250e-01 &  0.7027 &  0.3514 \tabularnewline
`ITHSUM(t-6)` & -0.04301 &  0.08366 & -5.1410e-01 &  0.608 &  0.304 \tabularnewline
`ITHSUM(t-7)` & +0.0001484 &  0.08399 & +1.7670e-03 &  0.9986 &  0.4993 \tabularnewline
`ITHSUM(t-8)` & +0.04535 &  0.08337 & +5.4400e-01 &  0.5873 &  0.2937 \tabularnewline
`ITHSUM(t-9)` & -0.02509 &  0.08386 & -2.9920e-01 &  0.7652 &  0.3826 \tabularnewline
`ITHSUM(t-10)` & -0.04628 &  0.08352 & -5.5420e-01 &  0.5804 &  0.2902 \tabularnewline
`ITHSUM(t-11)` & +0.168 &  0.08312 & +2.0220e+00 &  0.04519 &  0.02259 \tabularnewline
`ITHSUM(t-12)` & -0.09179 &  0.08401 & -1.0930e+00 &  0.2765 &  0.1383 \tabularnewline
\hline
\end{tabular}
%Source: https://freestatistics.org/blog/index.php?pk=304564&T=2

[TABLE]
[ROW][C]Multiple Linear Regression - Ordinary Least Squares[/C][/ROW]
[ROW][C]Variable[/C][C]Parameter[/C][C]S.D.[/C][C]T-STATH0: parameter = 0[/C][C]2-tail p-value[/C][C]1-tail p-value[/C][/ROW]
[ROW][C](Intercept)[/C][C]+17.57[/C][C] 6.347[/C][C]+2.7680e+00[/C][C] 0.006439[/C][C] 0.00322[/C][/ROW]
[ROW][C]Bevr_Leeftijd[/C][C]+0.1326[/C][C] 0.1191[/C][C]+1.1140e+00[/C][C] 0.2674[/C][C] 0.1337[/C][/ROW]
[ROW][C]SKEOU1[/C][C]+0.4489[/C][C] 0.2852[/C][C]+1.5740e+00[/C][C] 0.1179[/C][C] 0.05895[/C][/ROW]
[ROW][C]`ITHSUM(t-1)`[/C][C]-0.0709[/C][C] 0.085[/C][C]-8.3410e-01[/C][C] 0.4057[/C][C] 0.2028[/C][/ROW]
[ROW][C]`ITHSUM(t-2)`[/C][C]-0.1206[/C][C] 0.08259[/C][C]-1.4600e+00[/C][C] 0.1465[/C][C] 0.07325[/C][/ROW]
[ROW][C]`ITHSUM(t-3)`[/C][C]-0.08067[/C][C] 0.08333[/C][C]-9.6810e-01[/C][C] 0.3347[/C][C] 0.1674[/C][/ROW]
[ROW][C]`ITHSUM(t-4)`[/C][C]-0.0465[/C][C] 0.08407[/C][C]-5.5310e-01[/C][C] 0.5811[/C][C] 0.2905[/C][/ROW]
[ROW][C]`ITHSUM(t-5)`[/C][C]-0.03206[/C][C] 0.08383[/C][C]-3.8250e-01[/C][C] 0.7027[/C][C] 0.3514[/C][/ROW]
[ROW][C]`ITHSUM(t-6)`[/C][C]-0.04301[/C][C] 0.08366[/C][C]-5.1410e-01[/C][C] 0.608[/C][C] 0.304[/C][/ROW]
[ROW][C]`ITHSUM(t-7)`[/C][C]+0.0001484[/C][C] 0.08399[/C][C]+1.7670e-03[/C][C] 0.9986[/C][C] 0.4993[/C][/ROW]
[ROW][C]`ITHSUM(t-8)`[/C][C]+0.04535[/C][C] 0.08337[/C][C]+5.4400e-01[/C][C] 0.5873[/C][C] 0.2937[/C][/ROW]
[ROW][C]`ITHSUM(t-9)`[/C][C]-0.02509[/C][C] 0.08386[/C][C]-2.9920e-01[/C][C] 0.7652[/C][C] 0.3826[/C][/ROW]
[ROW][C]`ITHSUM(t-10)`[/C][C]-0.04628[/C][C] 0.08352[/C][C]-5.5420e-01[/C][C] 0.5804[/C][C] 0.2902[/C][/ROW]
[ROW][C]`ITHSUM(t-11)`[/C][C]+0.168[/C][C] 0.08312[/C][C]+2.0220e+00[/C][C] 0.04519[/C][C] 0.02259[/C][/ROW]
[ROW][C]`ITHSUM(t-12)`[/C][C]-0.09179[/C][C] 0.08401[/C][C]-1.0930e+00[/C][C] 0.2765[/C][C] 0.1383[/C][/ROW]
[/TABLE]
Source: https://freestatistics.org/blog/index.php?pk=304564&T=2

Globally Unique Identifier (entire table): ba.freestatistics.org/blog/index.php?pk=304564&T=2

As an alternative you can also use a QR Code:  

The GUIDs for individual cells are displayed in the table below:

Multiple Linear Regression - Ordinary Least Squares
VariableParameterS.D.T-STATH0: parameter = 02-tail p-value1-tail p-value
(Intercept)+17.57 6.347+2.7680e+00 0.006439 0.00322
Bevr_Leeftijd+0.1326 0.1191+1.1140e+00 0.2674 0.1337
SKEOU1+0.4489 0.2852+1.5740e+00 0.1179 0.05895
`ITHSUM(t-1)`-0.0709 0.085-8.3410e-01 0.4057 0.2028
`ITHSUM(t-2)`-0.1206 0.08259-1.4600e+00 0.1465 0.07325
`ITHSUM(t-3)`-0.08067 0.08333-9.6810e-01 0.3347 0.1674
`ITHSUM(t-4)`-0.0465 0.08407-5.5310e-01 0.5811 0.2905
`ITHSUM(t-5)`-0.03206 0.08383-3.8250e-01 0.7027 0.3514
`ITHSUM(t-6)`-0.04301 0.08366-5.1410e-01 0.608 0.304
`ITHSUM(t-7)`+0.0001484 0.08399+1.7670e-03 0.9986 0.4993
`ITHSUM(t-8)`+0.04535 0.08337+5.4400e-01 0.5873 0.2937
`ITHSUM(t-9)`-0.02509 0.08386-2.9920e-01 0.7652 0.3826
`ITHSUM(t-10)`-0.04628 0.08352-5.5420e-01 0.5804 0.2902
`ITHSUM(t-11)`+0.168 0.08312+2.0220e+00 0.04519 0.02259
`ITHSUM(t-12)`-0.09179 0.08401-1.0930e+00 0.2765 0.1383


Multiple Linear Regression - Regression Statistics
Multiple R 0.307
R-squared 0.09423
Adjusted R-squared 0.0002974
F-TEST (value) 1.003
F-TEST (DF numerator)14
F-TEST (DF denominator)135
p-value 0.4539
Multiple Linear Regression - Residual Statistics
Residual Standard Deviation 2.488
Sum Squared Residuals 835.9

\begin{tabular}{lllllllll}
\hline
Multiple Linear Regression - Regression Statistics \tabularnewline
Multiple R &  0.307 \tabularnewline
R-squared &  0.09423 \tabularnewline
Adjusted R-squared &  0.0002974 \tabularnewline
F-TEST (value) &  1.003 \tabularnewline
F-TEST (DF numerator) & 14 \tabularnewline
F-TEST (DF denominator) & 135 \tabularnewline
p-value &  0.4539 \tabularnewline
Multiple Linear Regression - Residual Statistics \tabularnewline
Residual Standard Deviation &  2.488 \tabularnewline
Sum Squared Residuals &  835.9 \tabularnewline
\hline
\end{tabular}
%Source: https://freestatistics.org/blog/index.php?pk=304564&T=3

[TABLE]
[ROW][C]Multiple Linear Regression - Regression Statistics[/C][/ROW]
[ROW][C]Multiple R[/C][C] 0.307[/C][/ROW]
[ROW][C]R-squared[/C][C] 0.09423[/C][/ROW]
[ROW][C]Adjusted R-squared[/C][C] 0.0002974[/C][/ROW]
[ROW][C]F-TEST (value)[/C][C] 1.003[/C][/ROW]
[ROW][C]F-TEST (DF numerator)[/C][C]14[/C][/ROW]
[ROW][C]F-TEST (DF denominator)[/C][C]135[/C][/ROW]
[ROW][C]p-value[/C][C] 0.4539[/C][/ROW]
[ROW][C]Multiple Linear Regression - Residual Statistics[/C][/ROW]
[ROW][C]Residual Standard Deviation[/C][C] 2.488[/C][/ROW]
[ROW][C]Sum Squared Residuals[/C][C] 835.9[/C][/ROW]
[/TABLE]
Source: https://freestatistics.org/blog/index.php?pk=304564&T=3

Globally Unique Identifier (entire table): ba.freestatistics.org/blog/index.php?pk=304564&T=3

As an alternative you can also use a QR Code:  

The GUIDs for individual cells are displayed in the table below:

Multiple Linear Regression - Regression Statistics
Multiple R 0.307
R-squared 0.09423
Adjusted R-squared 0.0002974
F-TEST (value) 1.003
F-TEST (DF numerator)14
F-TEST (DF denominator)135
p-value 0.4539
Multiple Linear Regression - Residual Statistics
Residual Standard Deviation 2.488
Sum Squared Residuals 835.9


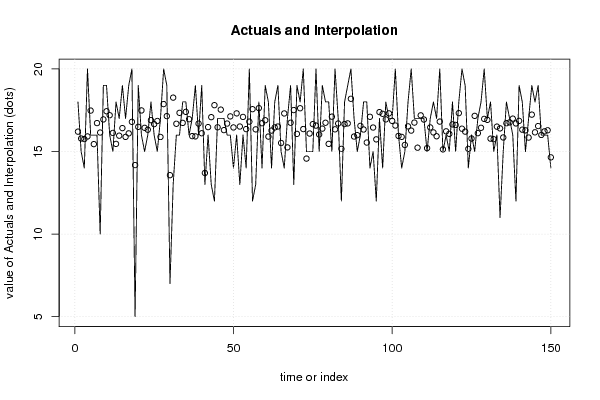
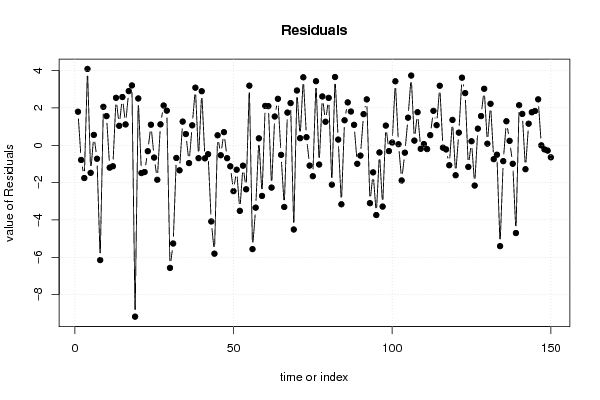
Multiple Linear Regression - Actuals, Interpolation, and Residuals
Time or IndexActualsInterpolationForecastResidualsPrediction Error
1 18 16.2 1.797
2 15 15.79-0.7874
3 14 15.76-1.755
4 20 15.91 4.087
5 16 17.48-1.478
6 16 15.45 0.5532
7 16 16.72-0.7229
8 10 16.15-6.149
9 19 16.94 2.058
10 19 17.44 1.562
11 16 17.2-1.198
12 15 16.12-1.125
13 18 15.46 2.54
14 17 15.96 1.042
15 19 16.42 2.583
16 17 15.88 1.116
17 19 16.1 2.901
18 20 16.8 3.204
19 5 14.18-9.18
20 19 16.49 2.506
21 16 17.49-1.487
22 15 16.43-1.435
23 16 16.32-0.32
24 18 16.9 1.1
25 16 16.66-0.6592
26 15 16.85-1.849
27 17 15.88 1.119
28 20 17.87 2.128
29 19 17.15 1.855
30 7 13.57-6.569
31 13 18.26-5.262
32 16 16.68-0.6803
33 16 17.34-1.343
34 18 16.73 1.267
35 18 17.4 0.6005
36 16 16.95-0.9548
37 17 15.93 1.067
38 19 15.92 3.083
39 16 16.69-0.6923
40 19 16.11 2.894
41 13 13.7-0.7017
42 16 16.48-0.4786
43 13 17.08-4.081
44 12 17.81-5.807
45 17 16.47 0.5333
46 17 17.54-0.5357
47 17 16.3 0.7024
48 16 16.69-0.6937
49 16 17.13-1.127
50 14 16.46-2.457
51 16 17.31-1.311
52 13 16.51-3.514
53 16 17.09-1.094
54 14 16.36-2.359
55 20 16.81 3.191
56 12 17.56-5.564
57 13 16.34-3.342
58 18 17.63 0.3707
59 14 16.71-2.714
60 19 16.89 2.106
61 18 15.9 2.096
62 14 16.27-2.268
63 18 16.46 1.54
64 19 16.51 2.486
65 15 15.52-0.5154
66 14 17.31-3.306
67 17 15.25 1.749
68 19 16.74 2.258
69 13 17.51-4.512
70 19 16.07 2.933
71 18 17.62 0.3792
72 20 16.36 3.64
73 15 14.57 0.4297
74 15 16.09-1.089
75 15 16.66-1.658
76 20 16.57 3.431
77 15 16.03-1.032
78 19 16.39 2.614
79 18 16.74 1.258
80 18 15.46 2.537
81 15 17.11-2.11
82 20 16.34 3.656
83 17 16.7 0.3039
84 12 15.16-3.161
85 18 16.66 1.338
86 19 16.7 2.296
87 20 18.19 1.806
88 17 15.91 1.093
89 15 15.99-0.9915
90 16 16.55-0.5549
91 18 16.33 1.666
92 18 15.54 2.456
93 14 17.1-3.101
94 15 16.45-1.452
95 12 15.74-3.737
96 17 17.39-0.3854
97 14 17.28-3.284
98 18 16.95 1.053
99 17 17.31-0.3102
100 17 16.85 0.1453
101 20 16.57 3.427
102 16 15.94 0.05534
103 14 15.89-1.887
104 15 15.4-0.3967
105 18 16.52 1.477
106 20 16.27 3.733
107 17 16.75 0.2487
108 17 15.23 1.768
109 17 17.19-0.1898
110 17 16.94 0.06229
111 15 15.2-0.2047
112 17 16.46 0.5418
113 18 16.16 1.843
114 17 15.92 1.075
115 20 16.81 3.188
116 15 15.13-0.1287
117 16 16.22-0.2236
118 15 16.07-1.07
119 18 16.64 1.358
120 15 16.61-1.606
121 18 17.32 0.6759
122 20 16.38 3.619
123 19 16.2 2.795
124 14 15.16-1.159
125 16 15.79 0.214
126 15 17.16-2.158
127 17 16.11 0.8896
128 18 16.44 1.564
129 20 16.97 3.025
130 17 16.92 0.08316
131 18 15.78 2.221
132 15 15.74-0.7448
133 16 16.51-0.5071
134 11 16.4-5.402
135 15 15.85-0.8511
136 18 16.71 1.286
137 17 16.76 0.2359
138 16 16.99-0.9917
139 12 16.7-4.701
140 19 16.86 2.145
141 18 16.32 1.679
142 15 16.28-1.283
143 17 15.85 1.154
144 19 17.23 1.767
145 18 16.16 1.836
146 19 16.54 2.458
147 16 16-0.004538
148 16 16.22-0.2209
149 16 16.29-0.2859
150 14 14.65-0.6473

\begin{tabular}{lllllllll}
\hline
Multiple Linear Regression - Actuals, Interpolation, and Residuals \tabularnewline
Time or Index & Actuals & InterpolationForecast & ResidualsPrediction Error \tabularnewline
1 &  18 &  16.2 &  1.797 \tabularnewline
2 &  15 &  15.79 & -0.7874 \tabularnewline
3 &  14 &  15.76 & -1.755 \tabularnewline
4 &  20 &  15.91 &  4.087 \tabularnewline
5 &  16 &  17.48 & -1.478 \tabularnewline
6 &  16 &  15.45 &  0.5532 \tabularnewline
7 &  16 &  16.72 & -0.7229 \tabularnewline
8 &  10 &  16.15 & -6.149 \tabularnewline
9 &  19 &  16.94 &  2.058 \tabularnewline
10 &  19 &  17.44 &  1.562 \tabularnewline
11 &  16 &  17.2 & -1.198 \tabularnewline
12 &  15 &  16.12 & -1.125 \tabularnewline
13 &  18 &  15.46 &  2.54 \tabularnewline
14 &  17 &  15.96 &  1.042 \tabularnewline
15 &  19 &  16.42 &  2.583 \tabularnewline
16 &  17 &  15.88 &  1.116 \tabularnewline
17 &  19 &  16.1 &  2.901 \tabularnewline
18 &  20 &  16.8 &  3.204 \tabularnewline
19 &  5 &  14.18 & -9.18 \tabularnewline
20 &  19 &  16.49 &  2.506 \tabularnewline
21 &  16 &  17.49 & -1.487 \tabularnewline
22 &  15 &  16.43 & -1.435 \tabularnewline
23 &  16 &  16.32 & -0.32 \tabularnewline
24 &  18 &  16.9 &  1.1 \tabularnewline
25 &  16 &  16.66 & -0.6592 \tabularnewline
26 &  15 &  16.85 & -1.849 \tabularnewline
27 &  17 &  15.88 &  1.119 \tabularnewline
28 &  20 &  17.87 &  2.128 \tabularnewline
29 &  19 &  17.15 &  1.855 \tabularnewline
30 &  7 &  13.57 & -6.569 \tabularnewline
31 &  13 &  18.26 & -5.262 \tabularnewline
32 &  16 &  16.68 & -0.6803 \tabularnewline
33 &  16 &  17.34 & -1.343 \tabularnewline
34 &  18 &  16.73 &  1.267 \tabularnewline
35 &  18 &  17.4 &  0.6005 \tabularnewline
36 &  16 &  16.95 & -0.9548 \tabularnewline
37 &  17 &  15.93 &  1.067 \tabularnewline
38 &  19 &  15.92 &  3.083 \tabularnewline
39 &  16 &  16.69 & -0.6923 \tabularnewline
40 &  19 &  16.11 &  2.894 \tabularnewline
41 &  13 &  13.7 & -0.7017 \tabularnewline
42 &  16 &  16.48 & -0.4786 \tabularnewline
43 &  13 &  17.08 & -4.081 \tabularnewline
44 &  12 &  17.81 & -5.807 \tabularnewline
45 &  17 &  16.47 &  0.5333 \tabularnewline
46 &  17 &  17.54 & -0.5357 \tabularnewline
47 &  17 &  16.3 &  0.7024 \tabularnewline
48 &  16 &  16.69 & -0.6937 \tabularnewline
49 &  16 &  17.13 & -1.127 \tabularnewline
50 &  14 &  16.46 & -2.457 \tabularnewline
51 &  16 &  17.31 & -1.311 \tabularnewline
52 &  13 &  16.51 & -3.514 \tabularnewline
53 &  16 &  17.09 & -1.094 \tabularnewline
54 &  14 &  16.36 & -2.359 \tabularnewline
55 &  20 &  16.81 &  3.191 \tabularnewline
56 &  12 &  17.56 & -5.564 \tabularnewline
57 &  13 &  16.34 & -3.342 \tabularnewline
58 &  18 &  17.63 &  0.3707 \tabularnewline
59 &  14 &  16.71 & -2.714 \tabularnewline
60 &  19 &  16.89 &  2.106 \tabularnewline
61 &  18 &  15.9 &  2.096 \tabularnewline
62 &  14 &  16.27 & -2.268 \tabularnewline
63 &  18 &  16.46 &  1.54 \tabularnewline
64 &  19 &  16.51 &  2.486 \tabularnewline
65 &  15 &  15.52 & -0.5154 \tabularnewline
66 &  14 &  17.31 & -3.306 \tabularnewline
67 &  17 &  15.25 &  1.749 \tabularnewline
68 &  19 &  16.74 &  2.258 \tabularnewline
69 &  13 &  17.51 & -4.512 \tabularnewline
70 &  19 &  16.07 &  2.933 \tabularnewline
71 &  18 &  17.62 &  0.3792 \tabularnewline
72 &  20 &  16.36 &  3.64 \tabularnewline
73 &  15 &  14.57 &  0.4297 \tabularnewline
74 &  15 &  16.09 & -1.089 \tabularnewline
75 &  15 &  16.66 & -1.658 \tabularnewline
76 &  20 &  16.57 &  3.431 \tabularnewline
77 &  15 &  16.03 & -1.032 \tabularnewline
78 &  19 &  16.39 &  2.614 \tabularnewline
79 &  18 &  16.74 &  1.258 \tabularnewline
80 &  18 &  15.46 &  2.537 \tabularnewline
81 &  15 &  17.11 & -2.11 \tabularnewline
82 &  20 &  16.34 &  3.656 \tabularnewline
83 &  17 &  16.7 &  0.3039 \tabularnewline
84 &  12 &  15.16 & -3.161 \tabularnewline
85 &  18 &  16.66 &  1.338 \tabularnewline
86 &  19 &  16.7 &  2.296 \tabularnewline
87 &  20 &  18.19 &  1.806 \tabularnewline
88 &  17 &  15.91 &  1.093 \tabularnewline
89 &  15 &  15.99 & -0.9915 \tabularnewline
90 &  16 &  16.55 & -0.5549 \tabularnewline
91 &  18 &  16.33 &  1.666 \tabularnewline
92 &  18 &  15.54 &  2.456 \tabularnewline
93 &  14 &  17.1 & -3.101 \tabularnewline
94 &  15 &  16.45 & -1.452 \tabularnewline
95 &  12 &  15.74 & -3.737 \tabularnewline
96 &  17 &  17.39 & -0.3854 \tabularnewline
97 &  14 &  17.28 & -3.284 \tabularnewline
98 &  18 &  16.95 &  1.053 \tabularnewline
99 &  17 &  17.31 & -0.3102 \tabularnewline
100 &  17 &  16.85 &  0.1453 \tabularnewline
101 &  20 &  16.57 &  3.427 \tabularnewline
102 &  16 &  15.94 &  0.05534 \tabularnewline
103 &  14 &  15.89 & -1.887 \tabularnewline
104 &  15 &  15.4 & -0.3967 \tabularnewline
105 &  18 &  16.52 &  1.477 \tabularnewline
106 &  20 &  16.27 &  3.733 \tabularnewline
107 &  17 &  16.75 &  0.2487 \tabularnewline
108 &  17 &  15.23 &  1.768 \tabularnewline
109 &  17 &  17.19 & -0.1898 \tabularnewline
110 &  17 &  16.94 &  0.06229 \tabularnewline
111 &  15 &  15.2 & -0.2047 \tabularnewline
112 &  17 &  16.46 &  0.5418 \tabularnewline
113 &  18 &  16.16 &  1.843 \tabularnewline
114 &  17 &  15.92 &  1.075 \tabularnewline
115 &  20 &  16.81 &  3.188 \tabularnewline
116 &  15 &  15.13 & -0.1287 \tabularnewline
117 &  16 &  16.22 & -0.2236 \tabularnewline
118 &  15 &  16.07 & -1.07 \tabularnewline
119 &  18 &  16.64 &  1.358 \tabularnewline
120 &  15 &  16.61 & -1.606 \tabularnewline
121 &  18 &  17.32 &  0.6759 \tabularnewline
122 &  20 &  16.38 &  3.619 \tabularnewline
123 &  19 &  16.2 &  2.795 \tabularnewline
124 &  14 &  15.16 & -1.159 \tabularnewline
125 &  16 &  15.79 &  0.214 \tabularnewline
126 &  15 &  17.16 & -2.158 \tabularnewline
127 &  17 &  16.11 &  0.8896 \tabularnewline
128 &  18 &  16.44 &  1.564 \tabularnewline
129 &  20 &  16.97 &  3.025 \tabularnewline
130 &  17 &  16.92 &  0.08316 \tabularnewline
131 &  18 &  15.78 &  2.221 \tabularnewline
132 &  15 &  15.74 & -0.7448 \tabularnewline
133 &  16 &  16.51 & -0.5071 \tabularnewline
134 &  11 &  16.4 & -5.402 \tabularnewline
135 &  15 &  15.85 & -0.8511 \tabularnewline
136 &  18 &  16.71 &  1.286 \tabularnewline
137 &  17 &  16.76 &  0.2359 \tabularnewline
138 &  16 &  16.99 & -0.9917 \tabularnewline
139 &  12 &  16.7 & -4.701 \tabularnewline
140 &  19 &  16.86 &  2.145 \tabularnewline
141 &  18 &  16.32 &  1.679 \tabularnewline
142 &  15 &  16.28 & -1.283 \tabularnewline
143 &  17 &  15.85 &  1.154 \tabularnewline
144 &  19 &  17.23 &  1.767 \tabularnewline
145 &  18 &  16.16 &  1.836 \tabularnewline
146 &  19 &  16.54 &  2.458 \tabularnewline
147 &  16 &  16 & -0.004538 \tabularnewline
148 &  16 &  16.22 & -0.2209 \tabularnewline
149 &  16 &  16.29 & -0.2859 \tabularnewline
150 &  14 &  14.65 & -0.6473 \tabularnewline
\hline
\end{tabular}
%Source: https://freestatistics.org/blog/index.php?pk=304564&T=4

[TABLE]
[ROW][C]Multiple Linear Regression - Actuals, Interpolation, and Residuals[/C][/ROW]
[ROW][C]Time or Index[/C][C]Actuals[/C][C]InterpolationForecast[/C][C]ResidualsPrediction Error[/C][/ROW]
[ROW][C]1[/C][C] 18[/C][C] 16.2[/C][C] 1.797[/C][/ROW]
[ROW][C]2[/C][C] 15[/C][C] 15.79[/C][C]-0.7874[/C][/ROW]
[ROW][C]3[/C][C] 14[/C][C] 15.76[/C][C]-1.755[/C][/ROW]
[ROW][C]4[/C][C] 20[/C][C] 15.91[/C][C] 4.087[/C][/ROW]
[ROW][C]5[/C][C] 16[/C][C] 17.48[/C][C]-1.478[/C][/ROW]
[ROW][C]6[/C][C] 16[/C][C] 15.45[/C][C] 0.5532[/C][/ROW]
[ROW][C]7[/C][C] 16[/C][C] 16.72[/C][C]-0.7229[/C][/ROW]
[ROW][C]8[/C][C] 10[/C][C] 16.15[/C][C]-6.149[/C][/ROW]
[ROW][C]9[/C][C] 19[/C][C] 16.94[/C][C] 2.058[/C][/ROW]
[ROW][C]10[/C][C] 19[/C][C] 17.44[/C][C] 1.562[/C][/ROW]
[ROW][C]11[/C][C] 16[/C][C] 17.2[/C][C]-1.198[/C][/ROW]
[ROW][C]12[/C][C] 15[/C][C] 16.12[/C][C]-1.125[/C][/ROW]
[ROW][C]13[/C][C] 18[/C][C] 15.46[/C][C] 2.54[/C][/ROW]
[ROW][C]14[/C][C] 17[/C][C] 15.96[/C][C] 1.042[/C][/ROW]
[ROW][C]15[/C][C] 19[/C][C] 16.42[/C][C] 2.583[/C][/ROW]
[ROW][C]16[/C][C] 17[/C][C] 15.88[/C][C] 1.116[/C][/ROW]
[ROW][C]17[/C][C] 19[/C][C] 16.1[/C][C] 2.901[/C][/ROW]
[ROW][C]18[/C][C] 20[/C][C] 16.8[/C][C] 3.204[/C][/ROW]
[ROW][C]19[/C][C] 5[/C][C] 14.18[/C][C]-9.18[/C][/ROW]
[ROW][C]20[/C][C] 19[/C][C] 16.49[/C][C] 2.506[/C][/ROW]
[ROW][C]21[/C][C] 16[/C][C] 17.49[/C][C]-1.487[/C][/ROW]
[ROW][C]22[/C][C] 15[/C][C] 16.43[/C][C]-1.435[/C][/ROW]
[ROW][C]23[/C][C] 16[/C][C] 16.32[/C][C]-0.32[/C][/ROW]
[ROW][C]24[/C][C] 18[/C][C] 16.9[/C][C] 1.1[/C][/ROW]
[ROW][C]25[/C][C] 16[/C][C] 16.66[/C][C]-0.6592[/C][/ROW]
[ROW][C]26[/C][C] 15[/C][C] 16.85[/C][C]-1.849[/C][/ROW]
[ROW][C]27[/C][C] 17[/C][C] 15.88[/C][C] 1.119[/C][/ROW]
[ROW][C]28[/C][C] 20[/C][C] 17.87[/C][C] 2.128[/C][/ROW]
[ROW][C]29[/C][C] 19[/C][C] 17.15[/C][C] 1.855[/C][/ROW]
[ROW][C]30[/C][C] 7[/C][C] 13.57[/C][C]-6.569[/C][/ROW]
[ROW][C]31[/C][C] 13[/C][C] 18.26[/C][C]-5.262[/C][/ROW]
[ROW][C]32[/C][C] 16[/C][C] 16.68[/C][C]-0.6803[/C][/ROW]
[ROW][C]33[/C][C] 16[/C][C] 17.34[/C][C]-1.343[/C][/ROW]
[ROW][C]34[/C][C] 18[/C][C] 16.73[/C][C] 1.267[/C][/ROW]
[ROW][C]35[/C][C] 18[/C][C] 17.4[/C][C] 0.6005[/C][/ROW]
[ROW][C]36[/C][C] 16[/C][C] 16.95[/C][C]-0.9548[/C][/ROW]
[ROW][C]37[/C][C] 17[/C][C] 15.93[/C][C] 1.067[/C][/ROW]
[ROW][C]38[/C][C] 19[/C][C] 15.92[/C][C] 3.083[/C][/ROW]
[ROW][C]39[/C][C] 16[/C][C] 16.69[/C][C]-0.6923[/C][/ROW]
[ROW][C]40[/C][C] 19[/C][C] 16.11[/C][C] 2.894[/C][/ROW]
[ROW][C]41[/C][C] 13[/C][C] 13.7[/C][C]-0.7017[/C][/ROW]
[ROW][C]42[/C][C] 16[/C][C] 16.48[/C][C]-0.4786[/C][/ROW]
[ROW][C]43[/C][C] 13[/C][C] 17.08[/C][C]-4.081[/C][/ROW]
[ROW][C]44[/C][C] 12[/C][C] 17.81[/C][C]-5.807[/C][/ROW]
[ROW][C]45[/C][C] 17[/C][C] 16.47[/C][C] 0.5333[/C][/ROW]
[ROW][C]46[/C][C] 17[/C][C] 17.54[/C][C]-0.5357[/C][/ROW]
[ROW][C]47[/C][C] 17[/C][C] 16.3[/C][C] 0.7024[/C][/ROW]
[ROW][C]48[/C][C] 16[/C][C] 16.69[/C][C]-0.6937[/C][/ROW]
[ROW][C]49[/C][C] 16[/C][C] 17.13[/C][C]-1.127[/C][/ROW]
[ROW][C]50[/C][C] 14[/C][C] 16.46[/C][C]-2.457[/C][/ROW]
[ROW][C]51[/C][C] 16[/C][C] 17.31[/C][C]-1.311[/C][/ROW]
[ROW][C]52[/C][C] 13[/C][C] 16.51[/C][C]-3.514[/C][/ROW]
[ROW][C]53[/C][C] 16[/C][C] 17.09[/C][C]-1.094[/C][/ROW]
[ROW][C]54[/C][C] 14[/C][C] 16.36[/C][C]-2.359[/C][/ROW]
[ROW][C]55[/C][C] 20[/C][C] 16.81[/C][C] 3.191[/C][/ROW]
[ROW][C]56[/C][C] 12[/C][C] 17.56[/C][C]-5.564[/C][/ROW]
[ROW][C]57[/C][C] 13[/C][C] 16.34[/C][C]-3.342[/C][/ROW]
[ROW][C]58[/C][C] 18[/C][C] 17.63[/C][C] 0.3707[/C][/ROW]
[ROW][C]59[/C][C] 14[/C][C] 16.71[/C][C]-2.714[/C][/ROW]
[ROW][C]60[/C][C] 19[/C][C] 16.89[/C][C] 2.106[/C][/ROW]
[ROW][C]61[/C][C] 18[/C][C] 15.9[/C][C] 2.096[/C][/ROW]
[ROW][C]62[/C][C] 14[/C][C] 16.27[/C][C]-2.268[/C][/ROW]
[ROW][C]63[/C][C] 18[/C][C] 16.46[/C][C] 1.54[/C][/ROW]
[ROW][C]64[/C][C] 19[/C][C] 16.51[/C][C] 2.486[/C][/ROW]
[ROW][C]65[/C][C] 15[/C][C] 15.52[/C][C]-0.5154[/C][/ROW]
[ROW][C]66[/C][C] 14[/C][C] 17.31[/C][C]-3.306[/C][/ROW]
[ROW][C]67[/C][C] 17[/C][C] 15.25[/C][C] 1.749[/C][/ROW]
[ROW][C]68[/C][C] 19[/C][C] 16.74[/C][C] 2.258[/C][/ROW]
[ROW][C]69[/C][C] 13[/C][C] 17.51[/C][C]-4.512[/C][/ROW]
[ROW][C]70[/C][C] 19[/C][C] 16.07[/C][C] 2.933[/C][/ROW]
[ROW][C]71[/C][C] 18[/C][C] 17.62[/C][C] 0.3792[/C][/ROW]
[ROW][C]72[/C][C] 20[/C][C] 16.36[/C][C] 3.64[/C][/ROW]
[ROW][C]73[/C][C] 15[/C][C] 14.57[/C][C] 0.4297[/C][/ROW]
[ROW][C]74[/C][C] 15[/C][C] 16.09[/C][C]-1.089[/C][/ROW]
[ROW][C]75[/C][C] 15[/C][C] 16.66[/C][C]-1.658[/C][/ROW]
[ROW][C]76[/C][C] 20[/C][C] 16.57[/C][C] 3.431[/C][/ROW]
[ROW][C]77[/C][C] 15[/C][C] 16.03[/C][C]-1.032[/C][/ROW]
[ROW][C]78[/C][C] 19[/C][C] 16.39[/C][C] 2.614[/C][/ROW]
[ROW][C]79[/C][C] 18[/C][C] 16.74[/C][C] 1.258[/C][/ROW]
[ROW][C]80[/C][C] 18[/C][C] 15.46[/C][C] 2.537[/C][/ROW]
[ROW][C]81[/C][C] 15[/C][C] 17.11[/C][C]-2.11[/C][/ROW]
[ROW][C]82[/C][C] 20[/C][C] 16.34[/C][C] 3.656[/C][/ROW]
[ROW][C]83[/C][C] 17[/C][C] 16.7[/C][C] 0.3039[/C][/ROW]
[ROW][C]84[/C][C] 12[/C][C] 15.16[/C][C]-3.161[/C][/ROW]
[ROW][C]85[/C][C] 18[/C][C] 16.66[/C][C] 1.338[/C][/ROW]
[ROW][C]86[/C][C] 19[/C][C] 16.7[/C][C] 2.296[/C][/ROW]
[ROW][C]87[/C][C] 20[/C][C] 18.19[/C][C] 1.806[/C][/ROW]
[ROW][C]88[/C][C] 17[/C][C] 15.91[/C][C] 1.093[/C][/ROW]
[ROW][C]89[/C][C] 15[/C][C] 15.99[/C][C]-0.9915[/C][/ROW]
[ROW][C]90[/C][C] 16[/C][C] 16.55[/C][C]-0.5549[/C][/ROW]
[ROW][C]91[/C][C] 18[/C][C] 16.33[/C][C] 1.666[/C][/ROW]
[ROW][C]92[/C][C] 18[/C][C] 15.54[/C][C] 2.456[/C][/ROW]
[ROW][C]93[/C][C] 14[/C][C] 17.1[/C][C]-3.101[/C][/ROW]
[ROW][C]94[/C][C] 15[/C][C] 16.45[/C][C]-1.452[/C][/ROW]
[ROW][C]95[/C][C] 12[/C][C] 15.74[/C][C]-3.737[/C][/ROW]
[ROW][C]96[/C][C] 17[/C][C] 17.39[/C][C]-0.3854[/C][/ROW]
[ROW][C]97[/C][C] 14[/C][C] 17.28[/C][C]-3.284[/C][/ROW]
[ROW][C]98[/C][C] 18[/C][C] 16.95[/C][C] 1.053[/C][/ROW]
[ROW][C]99[/C][C] 17[/C][C] 17.31[/C][C]-0.3102[/C][/ROW]
[ROW][C]100[/C][C] 17[/C][C] 16.85[/C][C] 0.1453[/C][/ROW]
[ROW][C]101[/C][C] 20[/C][C] 16.57[/C][C] 3.427[/C][/ROW]
[ROW][C]102[/C][C] 16[/C][C] 15.94[/C][C] 0.05534[/C][/ROW]
[ROW][C]103[/C][C] 14[/C][C] 15.89[/C][C]-1.887[/C][/ROW]
[ROW][C]104[/C][C] 15[/C][C] 15.4[/C][C]-0.3967[/C][/ROW]
[ROW][C]105[/C][C] 18[/C][C] 16.52[/C][C] 1.477[/C][/ROW]
[ROW][C]106[/C][C] 20[/C][C] 16.27[/C][C] 3.733[/C][/ROW]
[ROW][C]107[/C][C] 17[/C][C] 16.75[/C][C] 0.2487[/C][/ROW]
[ROW][C]108[/C][C] 17[/C][C] 15.23[/C][C] 1.768[/C][/ROW]
[ROW][C]109[/C][C] 17[/C][C] 17.19[/C][C]-0.1898[/C][/ROW]
[ROW][C]110[/C][C] 17[/C][C] 16.94[/C][C] 0.06229[/C][/ROW]
[ROW][C]111[/C][C] 15[/C][C] 15.2[/C][C]-0.2047[/C][/ROW]
[ROW][C]112[/C][C] 17[/C][C] 16.46[/C][C] 0.5418[/C][/ROW]
[ROW][C]113[/C][C] 18[/C][C] 16.16[/C][C] 1.843[/C][/ROW]
[ROW][C]114[/C][C] 17[/C][C] 15.92[/C][C] 1.075[/C][/ROW]
[ROW][C]115[/C][C] 20[/C][C] 16.81[/C][C] 3.188[/C][/ROW]
[ROW][C]116[/C][C] 15[/C][C] 15.13[/C][C]-0.1287[/C][/ROW]
[ROW][C]117[/C][C] 16[/C][C] 16.22[/C][C]-0.2236[/C][/ROW]
[ROW][C]118[/C][C] 15[/C][C] 16.07[/C][C]-1.07[/C][/ROW]
[ROW][C]119[/C][C] 18[/C][C] 16.64[/C][C] 1.358[/C][/ROW]
[ROW][C]120[/C][C] 15[/C][C] 16.61[/C][C]-1.606[/C][/ROW]
[ROW][C]121[/C][C] 18[/C][C] 17.32[/C][C] 0.6759[/C][/ROW]
[ROW][C]122[/C][C] 20[/C][C] 16.38[/C][C] 3.619[/C][/ROW]
[ROW][C]123[/C][C] 19[/C][C] 16.2[/C][C] 2.795[/C][/ROW]
[ROW][C]124[/C][C] 14[/C][C] 15.16[/C][C]-1.159[/C][/ROW]
[ROW][C]125[/C][C] 16[/C][C] 15.79[/C][C] 0.214[/C][/ROW]
[ROW][C]126[/C][C] 15[/C][C] 17.16[/C][C]-2.158[/C][/ROW]
[ROW][C]127[/C][C] 17[/C][C] 16.11[/C][C] 0.8896[/C][/ROW]
[ROW][C]128[/C][C] 18[/C][C] 16.44[/C][C] 1.564[/C][/ROW]
[ROW][C]129[/C][C] 20[/C][C] 16.97[/C][C] 3.025[/C][/ROW]
[ROW][C]130[/C][C] 17[/C][C] 16.92[/C][C] 0.08316[/C][/ROW]
[ROW][C]131[/C][C] 18[/C][C] 15.78[/C][C] 2.221[/C][/ROW]
[ROW][C]132[/C][C] 15[/C][C] 15.74[/C][C]-0.7448[/C][/ROW]
[ROW][C]133[/C][C] 16[/C][C] 16.51[/C][C]-0.5071[/C][/ROW]
[ROW][C]134[/C][C] 11[/C][C] 16.4[/C][C]-5.402[/C][/ROW]
[ROW][C]135[/C][C] 15[/C][C] 15.85[/C][C]-0.8511[/C][/ROW]
[ROW][C]136[/C][C] 18[/C][C] 16.71[/C][C] 1.286[/C][/ROW]
[ROW][C]137[/C][C] 17[/C][C] 16.76[/C][C] 0.2359[/C][/ROW]
[ROW][C]138[/C][C] 16[/C][C] 16.99[/C][C]-0.9917[/C][/ROW]
[ROW][C]139[/C][C] 12[/C][C] 16.7[/C][C]-4.701[/C][/ROW]
[ROW][C]140[/C][C] 19[/C][C] 16.86[/C][C] 2.145[/C][/ROW]
[ROW][C]141[/C][C] 18[/C][C] 16.32[/C][C] 1.679[/C][/ROW]
[ROW][C]142[/C][C] 15[/C][C] 16.28[/C][C]-1.283[/C][/ROW]
[ROW][C]143[/C][C] 17[/C][C] 15.85[/C][C] 1.154[/C][/ROW]
[ROW][C]144[/C][C] 19[/C][C] 17.23[/C][C] 1.767[/C][/ROW]
[ROW][C]145[/C][C] 18[/C][C] 16.16[/C][C] 1.836[/C][/ROW]
[ROW][C]146[/C][C] 19[/C][C] 16.54[/C][C] 2.458[/C][/ROW]
[ROW][C]147[/C][C] 16[/C][C] 16[/C][C]-0.004538[/C][/ROW]
[ROW][C]148[/C][C] 16[/C][C] 16.22[/C][C]-0.2209[/C][/ROW]
[ROW][C]149[/C][C] 16[/C][C] 16.29[/C][C]-0.2859[/C][/ROW]
[ROW][C]150[/C][C] 14[/C][C] 14.65[/C][C]-0.6473[/C][/ROW]
[/TABLE]
Source: https://freestatistics.org/blog/index.php?pk=304564&T=4

Globally Unique Identifier (entire table): ba.freestatistics.org/blog/index.php?pk=304564&T=4

As an alternative you can also use a QR Code:  

The GUIDs for individual cells are displayed in the table below:

Multiple Linear Regression - Actuals, Interpolation, and Residuals
Time or IndexActualsInterpolationForecastResidualsPrediction Error
1 18 16.2 1.797
2 15 15.79-0.7874
3 14 15.76-1.755
4 20 15.91 4.087
5 16 17.48-1.478
6 16 15.45 0.5532
7 16 16.72-0.7229
8 10 16.15-6.149
9 19 16.94 2.058
10 19 17.44 1.562
11 16 17.2-1.198
12 15 16.12-1.125
13 18 15.46 2.54
14 17 15.96 1.042
15 19 16.42 2.583
16 17 15.88 1.116
17 19 16.1 2.901
18 20 16.8 3.204
19 5 14.18-9.18
20 19 16.49 2.506
21 16 17.49-1.487
22 15 16.43-1.435
23 16 16.32-0.32
24 18 16.9 1.1
25 16 16.66-0.6592
26 15 16.85-1.849
27 17 15.88 1.119
28 20 17.87 2.128
29 19 17.15 1.855
30 7 13.57-6.569
31 13 18.26-5.262
32 16 16.68-0.6803
33 16 17.34-1.343
34 18 16.73 1.267
35 18 17.4 0.6005
36 16 16.95-0.9548
37 17 15.93 1.067
38 19 15.92 3.083
39 16 16.69-0.6923
40 19 16.11 2.894
41 13 13.7-0.7017
42 16 16.48-0.4786
43 13 17.08-4.081
44 12 17.81-5.807
45 17 16.47 0.5333
46 17 17.54-0.5357
47 17 16.3 0.7024
48 16 16.69-0.6937
49 16 17.13-1.127
50 14 16.46-2.457
51 16 17.31-1.311
52 13 16.51-3.514
53 16 17.09-1.094
54 14 16.36-2.359
55 20 16.81 3.191
56 12 17.56-5.564
57 13 16.34-3.342
58 18 17.63 0.3707
59 14 16.71-2.714
60 19 16.89 2.106
61 18 15.9 2.096
62 14 16.27-2.268
63 18 16.46 1.54
64 19 16.51 2.486
65 15 15.52-0.5154
66 14 17.31-3.306
67 17 15.25 1.749
68 19 16.74 2.258
69 13 17.51-4.512
70 19 16.07 2.933
71 18 17.62 0.3792
72 20 16.36 3.64
73 15 14.57 0.4297
74 15 16.09-1.089
75 15 16.66-1.658
76 20 16.57 3.431
77 15 16.03-1.032
78 19 16.39 2.614
79 18 16.74 1.258
80 18 15.46 2.537
81 15 17.11-2.11
82 20 16.34 3.656
83 17 16.7 0.3039
84 12 15.16-3.161
85 18 16.66 1.338
86 19 16.7 2.296
87 20 18.19 1.806
88 17 15.91 1.093
89 15 15.99-0.9915
90 16 16.55-0.5549
91 18 16.33 1.666
92 18 15.54 2.456
93 14 17.1-3.101
94 15 16.45-1.452
95 12 15.74-3.737
96 17 17.39-0.3854
97 14 17.28-3.284
98 18 16.95 1.053
99 17 17.31-0.3102
100 17 16.85 0.1453
101 20 16.57 3.427
102 16 15.94 0.05534
103 14 15.89-1.887
104 15 15.4-0.3967
105 18 16.52 1.477
106 20 16.27 3.733
107 17 16.75 0.2487
108 17 15.23 1.768
109 17 17.19-0.1898
110 17 16.94 0.06229
111 15 15.2-0.2047
112 17 16.46 0.5418
113 18 16.16 1.843
114 17 15.92 1.075
115 20 16.81 3.188
116 15 15.13-0.1287
117 16 16.22-0.2236
118 15 16.07-1.07
119 18 16.64 1.358
120 15 16.61-1.606
121 18 17.32 0.6759
122 20 16.38 3.619
123 19 16.2 2.795
124 14 15.16-1.159
125 16 15.79 0.214
126 15 17.16-2.158
127 17 16.11 0.8896
128 18 16.44 1.564
129 20 16.97 3.025
130 17 16.92 0.08316
131 18 15.78 2.221
132 15 15.74-0.7448
133 16 16.51-0.5071
134 11 16.4-5.402
135 15 15.85-0.8511
136 18 16.71 1.286
137 17 16.76 0.2359
138 16 16.99-0.9917
139 12 16.7-4.701
140 19 16.86 2.145
141 18 16.32 1.679
142 15 16.28-1.283
143 17 15.85 1.154
144 19 17.23 1.767
145 18 16.16 1.836
146 19 16.54 2.458
147 16 16-0.004538
148 16 16.22-0.2209
149 16 16.29-0.2859
150 14 14.65-0.6473


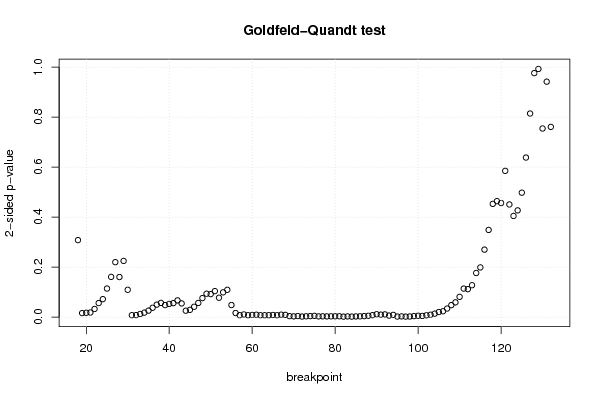
Goldfeld-Quandt test for Heteroskedasticity
p-valuesAlternative Hypothesis
breakpoint indexgreater2-sidedless
18 0.8459 0.3082 0.1541
19 0.9919 0.01613 0.008066
20 0.9914 0.01724 0.008622
21 0.9908 0.01847 0.009237
22 0.9837 0.03262 0.01631
23 0.9719 0.0562 0.0281
24 0.964 0.07197 0.03599
25 0.9429 0.1143 0.05714
26 0.9195 0.161 0.08048
27 0.8901 0.2198 0.1099
28 0.9198 0.1604 0.08022
29 0.8876 0.2249 0.1124
30 0.9453 0.1094 0.05469
31 0.9961 0.00772 0.00386
32 0.996 0.007991 0.003995
33 0.9937 0.01255 0.006277
34 0.9911 0.01782 0.008911
35 0.9871 0.02582 0.01291
36 0.9813 0.03736 0.01868
37 0.975 0.04995 0.02497
38 0.9716 0.0569 0.02845
39 0.9759 0.04819 0.02409
40 0.9736 0.05278 0.02639
41 0.972 0.05594 0.02797
42 0.9665 0.06702 0.03351
43 0.9726 0.05478 0.02739
44 0.9872 0.02564 0.01282
45 0.9855 0.02908 0.01454
46 0.9793 0.04133 0.02067
47 0.9717 0.05666 0.02833
48 0.962 0.07606 0.03803
49 0.9532 0.0936 0.0468
50 0.954 0.09205 0.04603
51 0.948 0.1041 0.05203
52 0.9612 0.0775 0.03875
53 0.9504 0.09911 0.04956
54 0.9453 0.1093 0.05465
55 0.9758 0.04837 0.02419
56 0.9918 0.01641 0.008206
57 0.9961 0.007773 0.003886
58 0.9947 0.01067 0.005334
59 0.9962 0.007694 0.003847
60 0.9957 0.00866 0.00433
61 0.9952 0.009519 0.004759
62 0.9962 0.007572 0.003786
63 0.9962 0.007585 0.003793
64 0.9961 0.007705 0.003852
65 0.9957 0.008537 0.004268
66 0.9962 0.007644 0.003822
67 0.9952 0.00969 0.004845
68 0.9955 0.008977 0.004488
69 0.998 0.003976 0.001988
70 0.9985 0.003036 0.001518
71 0.9978 0.00434 0.00217
72 0.9989 0.002231 0.001116
73 0.9984 0.003293 0.001646
74 0.9979 0.00412 0.00206
75 0.9975 0.005086 0.002543
76 0.9985 0.003032 0.001516
77 0.9984 0.003265 0.001633
78 0.9985 0.002928 0.001464
79 0.9984 0.003179 0.001589
80 0.9983 0.003424 0.001712
81 0.9982 0.003531 0.001765
82 0.9991 0.001871 0.0009353
83 0.9986 0.002859 0.00143
84 0.9989 0.002105 0.001052
85 0.9986 0.002787 0.001393
86 0.9984 0.003219 0.00161
87 0.998 0.004 0.002
88 0.9973 0.0054 0.0027
89 0.9961 0.00781 0.003905
90 0.9943 0.01147 0.005736
91 0.9951 0.009811 0.004905
92 0.9945 0.01095 0.005474
93 0.997 0.006098 0.003049
94 0.9955 0.00895 0.004475
95 0.9989 0.002271 0.001135
96 0.9985 0.002958 0.001479
97 0.999 0.00203 0.001015
98 0.9988 0.002497 0.001248
99 0.998 0.003984 0.001992
100 0.9973 0.005451 0.002726
101 0.9977 0.004644 0.002322
102 0.9963 0.007375 0.003688
103 0.9952 0.009578 0.004789
104 0.9931 0.01379 0.006895
105 0.9898 0.02036 0.01018
106 0.9883 0.02346 0.01173
107 0.9828 0.03431 0.01716
108 0.9761 0.04783 0.02392
109 0.9704 0.05916 0.02958
110 0.9594 0.08117 0.04059
111 0.943 0.1141 0.05705
112 0.944 0.112 0.056
113 0.9362 0.1276 0.06382
114 0.9118 0.1765 0.08824
115 0.9006 0.1988 0.09939
116 0.865 0.2699 0.135
117 0.8256 0.3488 0.1744
118 0.7735 0.4529 0.2265
119 0.768 0.464 0.232
120 0.7718 0.4565 0.2282
121 0.7074 0.5852 0.2926
122 0.7747 0.4507 0.2253
123 0.7976 0.4047 0.2024
124 0.7865 0.427 0.2135
125 0.7511 0.4978 0.2489
126 0.6808 0.6384 0.3192
127 0.5928 0.8144 0.4072
128 0.5119 0.9761 0.4881
129 0.5036 0.9928 0.4964
130 0.3773 0.7545 0.6227
131 0.529 0.942 0.471
132 0.3805 0.761 0.6195

\begin{tabular}{lllllllll}
\hline
Goldfeld-Quandt test for Heteroskedasticity \tabularnewline
p-values & Alternative Hypothesis \tabularnewline
breakpoint index & greater & 2-sided & less \tabularnewline
18 &  0.8459 &  0.3082 &  0.1541 \tabularnewline
19 &  0.9919 &  0.01613 &  0.008066 \tabularnewline
20 &  0.9914 &  0.01724 &  0.008622 \tabularnewline
21 &  0.9908 &  0.01847 &  0.009237 \tabularnewline
22 &  0.9837 &  0.03262 &  0.01631 \tabularnewline
23 &  0.9719 &  0.0562 &  0.0281 \tabularnewline
24 &  0.964 &  0.07197 &  0.03599 \tabularnewline
25 &  0.9429 &  0.1143 &  0.05714 \tabularnewline
26 &  0.9195 &  0.161 &  0.08048 \tabularnewline
27 &  0.8901 &  0.2198 &  0.1099 \tabularnewline
28 &  0.9198 &  0.1604 &  0.08022 \tabularnewline
29 &  0.8876 &  0.2249 &  0.1124 \tabularnewline
30 &  0.9453 &  0.1094 &  0.05469 \tabularnewline
31 &  0.9961 &  0.00772 &  0.00386 \tabularnewline
32 &  0.996 &  0.007991 &  0.003995 \tabularnewline
33 &  0.9937 &  0.01255 &  0.006277 \tabularnewline
34 &  0.9911 &  0.01782 &  0.008911 \tabularnewline
35 &  0.9871 &  0.02582 &  0.01291 \tabularnewline
36 &  0.9813 &  0.03736 &  0.01868 \tabularnewline
37 &  0.975 &  0.04995 &  0.02497 \tabularnewline
38 &  0.9716 &  0.0569 &  0.02845 \tabularnewline
39 &  0.9759 &  0.04819 &  0.02409 \tabularnewline
40 &  0.9736 &  0.05278 &  0.02639 \tabularnewline
41 &  0.972 &  0.05594 &  0.02797 \tabularnewline
42 &  0.9665 &  0.06702 &  0.03351 \tabularnewline
43 &  0.9726 &  0.05478 &  0.02739 \tabularnewline
44 &  0.9872 &  0.02564 &  0.01282 \tabularnewline
45 &  0.9855 &  0.02908 &  0.01454 \tabularnewline
46 &  0.9793 &  0.04133 &  0.02067 \tabularnewline
47 &  0.9717 &  0.05666 &  0.02833 \tabularnewline
48 &  0.962 &  0.07606 &  0.03803 \tabularnewline
49 &  0.9532 &  0.0936 &  0.0468 \tabularnewline
50 &  0.954 &  0.09205 &  0.04603 \tabularnewline
51 &  0.948 &  0.1041 &  0.05203 \tabularnewline
52 &  0.9612 &  0.0775 &  0.03875 \tabularnewline
53 &  0.9504 &  0.09911 &  0.04956 \tabularnewline
54 &  0.9453 &  0.1093 &  0.05465 \tabularnewline
55 &  0.9758 &  0.04837 &  0.02419 \tabularnewline
56 &  0.9918 &  0.01641 &  0.008206 \tabularnewline
57 &  0.9961 &  0.007773 &  0.003886 \tabularnewline
58 &  0.9947 &  0.01067 &  0.005334 \tabularnewline
59 &  0.9962 &  0.007694 &  0.003847 \tabularnewline
60 &  0.9957 &  0.00866 &  0.00433 \tabularnewline
61 &  0.9952 &  0.009519 &  0.004759 \tabularnewline
62 &  0.9962 &  0.007572 &  0.003786 \tabularnewline
63 &  0.9962 &  0.007585 &  0.003793 \tabularnewline
64 &  0.9961 &  0.007705 &  0.003852 \tabularnewline
65 &  0.9957 &  0.008537 &  0.004268 \tabularnewline
66 &  0.9962 &  0.007644 &  0.003822 \tabularnewline
67 &  0.9952 &  0.00969 &  0.004845 \tabularnewline
68 &  0.9955 &  0.008977 &  0.004488 \tabularnewline
69 &  0.998 &  0.003976 &  0.001988 \tabularnewline
70 &  0.9985 &  0.003036 &  0.001518 \tabularnewline
71 &  0.9978 &  0.00434 &  0.00217 \tabularnewline
72 &  0.9989 &  0.002231 &  0.001116 \tabularnewline
73 &  0.9984 &  0.003293 &  0.001646 \tabularnewline
74 &  0.9979 &  0.00412 &  0.00206 \tabularnewline
75 &  0.9975 &  0.005086 &  0.002543 \tabularnewline
76 &  0.9985 &  0.003032 &  0.001516 \tabularnewline
77 &  0.9984 &  0.003265 &  0.001633 \tabularnewline
78 &  0.9985 &  0.002928 &  0.001464 \tabularnewline
79 &  0.9984 &  0.003179 &  0.001589 \tabularnewline
80 &  0.9983 &  0.003424 &  0.001712 \tabularnewline
81 &  0.9982 &  0.003531 &  0.001765 \tabularnewline
82 &  0.9991 &  0.001871 &  0.0009353 \tabularnewline
83 &  0.9986 &  0.002859 &  0.00143 \tabularnewline
84 &  0.9989 &  0.002105 &  0.001052 \tabularnewline
85 &  0.9986 &  0.002787 &  0.001393 \tabularnewline
86 &  0.9984 &  0.003219 &  0.00161 \tabularnewline
87 &  0.998 &  0.004 &  0.002 \tabularnewline
88 &  0.9973 &  0.0054 &  0.0027 \tabularnewline
89 &  0.9961 &  0.00781 &  0.003905 \tabularnewline
90 &  0.9943 &  0.01147 &  0.005736 \tabularnewline
91 &  0.9951 &  0.009811 &  0.004905 \tabularnewline
92 &  0.9945 &  0.01095 &  0.005474 \tabularnewline
93 &  0.997 &  0.006098 &  0.003049 \tabularnewline
94 &  0.9955 &  0.00895 &  0.004475 \tabularnewline
95 &  0.9989 &  0.002271 &  0.001135 \tabularnewline
96 &  0.9985 &  0.002958 &  0.001479 \tabularnewline
97 &  0.999 &  0.00203 &  0.001015 \tabularnewline
98 &  0.9988 &  0.002497 &  0.001248 \tabularnewline
99 &  0.998 &  0.003984 &  0.001992 \tabularnewline
100 &  0.9973 &  0.005451 &  0.002726 \tabularnewline
101 &  0.9977 &  0.004644 &  0.002322 \tabularnewline
102 &  0.9963 &  0.007375 &  0.003688 \tabularnewline
103 &  0.9952 &  0.009578 &  0.004789 \tabularnewline
104 &  0.9931 &  0.01379 &  0.006895 \tabularnewline
105 &  0.9898 &  0.02036 &  0.01018 \tabularnewline
106 &  0.9883 &  0.02346 &  0.01173 \tabularnewline
107 &  0.9828 &  0.03431 &  0.01716 \tabularnewline
108 &  0.9761 &  0.04783 &  0.02392 \tabularnewline
109 &  0.9704 &  0.05916 &  0.02958 \tabularnewline
110 &  0.9594 &  0.08117 &  0.04059 \tabularnewline
111 &  0.943 &  0.1141 &  0.05705 \tabularnewline
112 &  0.944 &  0.112 &  0.056 \tabularnewline
113 &  0.9362 &  0.1276 &  0.06382 \tabularnewline
114 &  0.9118 &  0.1765 &  0.08824 \tabularnewline
115 &  0.9006 &  0.1988 &  0.09939 \tabularnewline
116 &  0.865 &  0.2699 &  0.135 \tabularnewline
117 &  0.8256 &  0.3488 &  0.1744 \tabularnewline
118 &  0.7735 &  0.4529 &  0.2265 \tabularnewline
119 &  0.768 &  0.464 &  0.232 \tabularnewline
120 &  0.7718 &  0.4565 &  0.2282 \tabularnewline
121 &  0.7074 &  0.5852 &  0.2926 \tabularnewline
122 &  0.7747 &  0.4507 &  0.2253 \tabularnewline
123 &  0.7976 &  0.4047 &  0.2024 \tabularnewline
124 &  0.7865 &  0.427 &  0.2135 \tabularnewline
125 &  0.7511 &  0.4978 &  0.2489 \tabularnewline
126 &  0.6808 &  0.6384 &  0.3192 \tabularnewline
127 &  0.5928 &  0.8144 &  0.4072 \tabularnewline
128 &  0.5119 &  0.9761 &  0.4881 \tabularnewline
129 &  0.5036 &  0.9928 &  0.4964 \tabularnewline
130 &  0.3773 &  0.7545 &  0.6227 \tabularnewline
131 &  0.529 &  0.942 &  0.471 \tabularnewline
132 &  0.3805 &  0.761 &  0.6195 \tabularnewline
\hline
\end{tabular}
%Source: https://freestatistics.org/blog/index.php?pk=304564&T=5

[TABLE]
[ROW][C]Goldfeld-Quandt test for Heteroskedasticity[/C][/ROW]
[ROW][C]p-values[/C][C]Alternative Hypothesis[/C][/ROW]
[ROW][C]breakpoint index[/C][C]greater[/C][C]2-sided[/C][C]less[/C][/ROW]
[ROW][C]18[/C][C] 0.8459[/C][C] 0.3082[/C][C] 0.1541[/C][/ROW]
[ROW][C]19[/C][C] 0.9919[/C][C] 0.01613[/C][C] 0.008066[/C][/ROW]
[ROW][C]20[/C][C] 0.9914[/C][C] 0.01724[/C][C] 0.008622[/C][/ROW]
[ROW][C]21[/C][C] 0.9908[/C][C] 0.01847[/C][C] 0.009237[/C][/ROW]
[ROW][C]22[/C][C] 0.9837[/C][C] 0.03262[/C][C] 0.01631[/C][/ROW]
[ROW][C]23[/C][C] 0.9719[/C][C] 0.0562[/C][C] 0.0281[/C][/ROW]
[ROW][C]24[/C][C] 0.964[/C][C] 0.07197[/C][C] 0.03599[/C][/ROW]
[ROW][C]25[/C][C] 0.9429[/C][C] 0.1143[/C][C] 0.05714[/C][/ROW]
[ROW][C]26[/C][C] 0.9195[/C][C] 0.161[/C][C] 0.08048[/C][/ROW]
[ROW][C]27[/C][C] 0.8901[/C][C] 0.2198[/C][C] 0.1099[/C][/ROW]
[ROW][C]28[/C][C] 0.9198[/C][C] 0.1604[/C][C] 0.08022[/C][/ROW]
[ROW][C]29[/C][C] 0.8876[/C][C] 0.2249[/C][C] 0.1124[/C][/ROW]
[ROW][C]30[/C][C] 0.9453[/C][C] 0.1094[/C][C] 0.05469[/C][/ROW]
[ROW][C]31[/C][C] 0.9961[/C][C] 0.00772[/C][C] 0.00386[/C][/ROW]
[ROW][C]32[/C][C] 0.996[/C][C] 0.007991[/C][C] 0.003995[/C][/ROW]
[ROW][C]33[/C][C] 0.9937[/C][C] 0.01255[/C][C] 0.006277[/C][/ROW]
[ROW][C]34[/C][C] 0.9911[/C][C] 0.01782[/C][C] 0.008911[/C][/ROW]
[ROW][C]35[/C][C] 0.9871[/C][C] 0.02582[/C][C] 0.01291[/C][/ROW]
[ROW][C]36[/C][C] 0.9813[/C][C] 0.03736[/C][C] 0.01868[/C][/ROW]
[ROW][C]37[/C][C] 0.975[/C][C] 0.04995[/C][C] 0.02497[/C][/ROW]
[ROW][C]38[/C][C] 0.9716[/C][C] 0.0569[/C][C] 0.02845[/C][/ROW]
[ROW][C]39[/C][C] 0.9759[/C][C] 0.04819[/C][C] 0.02409[/C][/ROW]
[ROW][C]40[/C][C] 0.9736[/C][C] 0.05278[/C][C] 0.02639[/C][/ROW]
[ROW][C]41[/C][C] 0.972[/C][C] 0.05594[/C][C] 0.02797[/C][/ROW]
[ROW][C]42[/C][C] 0.9665[/C][C] 0.06702[/C][C] 0.03351[/C][/ROW]
[ROW][C]43[/C][C] 0.9726[/C][C] 0.05478[/C][C] 0.02739[/C][/ROW]
[ROW][C]44[/C][C] 0.9872[/C][C] 0.02564[/C][C] 0.01282[/C][/ROW]
[ROW][C]45[/C][C] 0.9855[/C][C] 0.02908[/C][C] 0.01454[/C][/ROW]
[ROW][C]46[/C][C] 0.9793[/C][C] 0.04133[/C][C] 0.02067[/C][/ROW]
[ROW][C]47[/C][C] 0.9717[/C][C] 0.05666[/C][C] 0.02833[/C][/ROW]
[ROW][C]48[/C][C] 0.962[/C][C] 0.07606[/C][C] 0.03803[/C][/ROW]
[ROW][C]49[/C][C] 0.9532[/C][C] 0.0936[/C][C] 0.0468[/C][/ROW]
[ROW][C]50[/C][C] 0.954[/C][C] 0.09205[/C][C] 0.04603[/C][/ROW]
[ROW][C]51[/C][C] 0.948[/C][C] 0.1041[/C][C] 0.05203[/C][/ROW]
[ROW][C]52[/C][C] 0.9612[/C][C] 0.0775[/C][C] 0.03875[/C][/ROW]
[ROW][C]53[/C][C] 0.9504[/C][C] 0.09911[/C][C] 0.04956[/C][/ROW]
[ROW][C]54[/C][C] 0.9453[/C][C] 0.1093[/C][C] 0.05465[/C][/ROW]
[ROW][C]55[/C][C] 0.9758[/C][C] 0.04837[/C][C] 0.02419[/C][/ROW]
[ROW][C]56[/C][C] 0.9918[/C][C] 0.01641[/C][C] 0.008206[/C][/ROW]
[ROW][C]57[/C][C] 0.9961[/C][C] 0.007773[/C][C] 0.003886[/C][/ROW]
[ROW][C]58[/C][C] 0.9947[/C][C] 0.01067[/C][C] 0.005334[/C][/ROW]
[ROW][C]59[/C][C] 0.9962[/C][C] 0.007694[/C][C] 0.003847[/C][/ROW]
[ROW][C]60[/C][C] 0.9957[/C][C] 0.00866[/C][C] 0.00433[/C][/ROW]
[ROW][C]61[/C][C] 0.9952[/C][C] 0.009519[/C][C] 0.004759[/C][/ROW]
[ROW][C]62[/C][C] 0.9962[/C][C] 0.007572[/C][C] 0.003786[/C][/ROW]
[ROW][C]63[/C][C] 0.9962[/C][C] 0.007585[/C][C] 0.003793[/C][/ROW]
[ROW][C]64[/C][C] 0.9961[/C][C] 0.007705[/C][C] 0.003852[/C][/ROW]
[ROW][C]65[/C][C] 0.9957[/C][C] 0.008537[/C][C] 0.004268[/C][/ROW]
[ROW][C]66[/C][C] 0.9962[/C][C] 0.007644[/C][C] 0.003822[/C][/ROW]
[ROW][C]67[/C][C] 0.9952[/C][C] 0.00969[/C][C] 0.004845[/C][/ROW]
[ROW][C]68[/C][C] 0.9955[/C][C] 0.008977[/C][C] 0.004488[/C][/ROW]
[ROW][C]69[/C][C] 0.998[/C][C] 0.003976[/C][C] 0.001988[/C][/ROW]
[ROW][C]70[/C][C] 0.9985[/C][C] 0.003036[/C][C] 0.001518[/C][/ROW]
[ROW][C]71[/C][C] 0.9978[/C][C] 0.00434[/C][C] 0.00217[/C][/ROW]
[ROW][C]72[/C][C] 0.9989[/C][C] 0.002231[/C][C] 0.001116[/C][/ROW]
[ROW][C]73[/C][C] 0.9984[/C][C] 0.003293[/C][C] 0.001646[/C][/ROW]
[ROW][C]74[/C][C] 0.9979[/C][C] 0.00412[/C][C] 0.00206[/C][/ROW]
[ROW][C]75[/C][C] 0.9975[/C][C] 0.005086[/C][C] 0.002543[/C][/ROW]
[ROW][C]76[/C][C] 0.9985[/C][C] 0.003032[/C][C] 0.001516[/C][/ROW]
[ROW][C]77[/C][C] 0.9984[/C][C] 0.003265[/C][C] 0.001633[/C][/ROW]
[ROW][C]78[/C][C] 0.9985[/C][C] 0.002928[/C][C] 0.001464[/C][/ROW]
[ROW][C]79[/C][C] 0.9984[/C][C] 0.003179[/C][C] 0.001589[/C][/ROW]
[ROW][C]80[/C][C] 0.9983[/C][C] 0.003424[/C][C] 0.001712[/C][/ROW]
[ROW][C]81[/C][C] 0.9982[/C][C] 0.003531[/C][C] 0.001765[/C][/ROW]
[ROW][C]82[/C][C] 0.9991[/C][C] 0.001871[/C][C] 0.0009353[/C][/ROW]
[ROW][C]83[/C][C] 0.9986[/C][C] 0.002859[/C][C] 0.00143[/C][/ROW]
[ROW][C]84[/C][C] 0.9989[/C][C] 0.002105[/C][C] 0.001052[/C][/ROW]
[ROW][C]85[/C][C] 0.9986[/C][C] 0.002787[/C][C] 0.001393[/C][/ROW]
[ROW][C]86[/C][C] 0.9984[/C][C] 0.003219[/C][C] 0.00161[/C][/ROW]
[ROW][C]87[/C][C] 0.998[/C][C] 0.004[/C][C] 0.002[/C][/ROW]
[ROW][C]88[/C][C] 0.9973[/C][C] 0.0054[/C][C] 0.0027[/C][/ROW]
[ROW][C]89[/C][C] 0.9961[/C][C] 0.00781[/C][C] 0.003905[/C][/ROW]
[ROW][C]90[/C][C] 0.9943[/C][C] 0.01147[/C][C] 0.005736[/C][/ROW]
[ROW][C]91[/C][C] 0.9951[/C][C] 0.009811[/C][C] 0.004905[/C][/ROW]
[ROW][C]92[/C][C] 0.9945[/C][C] 0.01095[/C][C] 0.005474[/C][/ROW]
[ROW][C]93[/C][C] 0.997[/C][C] 0.006098[/C][C] 0.003049[/C][/ROW]
[ROW][C]94[/C][C] 0.9955[/C][C] 0.00895[/C][C] 0.004475[/C][/ROW]
[ROW][C]95[/C][C] 0.9989[/C][C] 0.002271[/C][C] 0.001135[/C][/ROW]
[ROW][C]96[/C][C] 0.9985[/C][C] 0.002958[/C][C] 0.001479[/C][/ROW]
[ROW][C]97[/C][C] 0.999[/C][C] 0.00203[/C][C] 0.001015[/C][/ROW]
[ROW][C]98[/C][C] 0.9988[/C][C] 0.002497[/C][C] 0.001248[/C][/ROW]
[ROW][C]99[/C][C] 0.998[/C][C] 0.003984[/C][C] 0.001992[/C][/ROW]
[ROW][C]100[/C][C] 0.9973[/C][C] 0.005451[/C][C] 0.002726[/C][/ROW]
[ROW][C]101[/C][C] 0.9977[/C][C] 0.004644[/C][C] 0.002322[/C][/ROW]
[ROW][C]102[/C][C] 0.9963[/C][C] 0.007375[/C][C] 0.003688[/C][/ROW]
[ROW][C]103[/C][C] 0.9952[/C][C] 0.009578[/C][C] 0.004789[/C][/ROW]
[ROW][C]104[/C][C] 0.9931[/C][C] 0.01379[/C][C] 0.006895[/C][/ROW]
[ROW][C]105[/C][C] 0.9898[/C][C] 0.02036[/C][C] 0.01018[/C][/ROW]
[ROW][C]106[/C][C] 0.9883[/C][C] 0.02346[/C][C] 0.01173[/C][/ROW]
[ROW][C]107[/C][C] 0.9828[/C][C] 0.03431[/C][C] 0.01716[/C][/ROW]
[ROW][C]108[/C][C] 0.9761[/C][C] 0.04783[/C][C] 0.02392[/C][/ROW]
[ROW][C]109[/C][C] 0.9704[/C][C] 0.05916[/C][C] 0.02958[/C][/ROW]
[ROW][C]110[/C][C] 0.9594[/C][C] 0.08117[/C][C] 0.04059[/C][/ROW]
[ROW][C]111[/C][C] 0.943[/C][C] 0.1141[/C][C] 0.05705[/C][/ROW]
[ROW][C]112[/C][C] 0.944[/C][C] 0.112[/C][C] 0.056[/C][/ROW]
[ROW][C]113[/C][C] 0.9362[/C][C] 0.1276[/C][C] 0.06382[/C][/ROW]
[ROW][C]114[/C][C] 0.9118[/C][C] 0.1765[/C][C] 0.08824[/C][/ROW]
[ROW][C]115[/C][C] 0.9006[/C][C] 0.1988[/C][C] 0.09939[/C][/ROW]
[ROW][C]116[/C][C] 0.865[/C][C] 0.2699[/C][C] 0.135[/C][/ROW]
[ROW][C]117[/C][C] 0.8256[/C][C] 0.3488[/C][C] 0.1744[/C][/ROW]
[ROW][C]118[/C][C] 0.7735[/C][C] 0.4529[/C][C] 0.2265[/C][/ROW]
[ROW][C]119[/C][C] 0.768[/C][C] 0.464[/C][C] 0.232[/C][/ROW]
[ROW][C]120[/C][C] 0.7718[/C][C] 0.4565[/C][C] 0.2282[/C][/ROW]
[ROW][C]121[/C][C] 0.7074[/C][C] 0.5852[/C][C] 0.2926[/C][/ROW]
[ROW][C]122[/C][C] 0.7747[/C][C] 0.4507[/C][C] 0.2253[/C][/ROW]
[ROW][C]123[/C][C] 0.7976[/C][C] 0.4047[/C][C] 0.2024[/C][/ROW]
[ROW][C]124[/C][C] 0.7865[/C][C] 0.427[/C][C] 0.2135[/C][/ROW]
[ROW][C]125[/C][C] 0.7511[/C][C] 0.4978[/C][C] 0.2489[/C][/ROW]
[ROW][C]126[/C][C] 0.6808[/C][C] 0.6384[/C][C] 0.3192[/C][/ROW]
[ROW][C]127[/C][C] 0.5928[/C][C] 0.8144[/C][C] 0.4072[/C][/ROW]
[ROW][C]128[/C][C] 0.5119[/C][C] 0.9761[/C][C] 0.4881[/C][/ROW]
[ROW][C]129[/C][C] 0.5036[/C][C] 0.9928[/C][C] 0.4964[/C][/ROW]
[ROW][C]130[/C][C] 0.3773[/C][C] 0.7545[/C][C] 0.6227[/C][/ROW]
[ROW][C]131[/C][C] 0.529[/C][C] 0.942[/C][C] 0.471[/C][/ROW]
[ROW][C]132[/C][C] 0.3805[/C][C] 0.761[/C][C] 0.6195[/C][/ROW]
[/TABLE]
Source: https://freestatistics.org/blog/index.php?pk=304564&T=5

Globally Unique Identifier (entire table): ba.freestatistics.org/blog/index.php?pk=304564&T=5

As an alternative you can also use a QR Code:  

The GUIDs for individual cells are displayed in the table below:

Goldfeld-Quandt test for Heteroskedasticity
p-valuesAlternative Hypothesis
breakpoint indexgreater2-sidedless
18 0.8459 0.3082 0.1541
19 0.9919 0.01613 0.008066
20 0.9914 0.01724 0.008622
21 0.9908 0.01847 0.009237
22 0.9837 0.03262 0.01631
23 0.9719 0.0562 0.0281
24 0.964 0.07197 0.03599
25 0.9429 0.1143 0.05714
26 0.9195 0.161 0.08048
27 0.8901 0.2198 0.1099
28 0.9198 0.1604 0.08022
29 0.8876 0.2249 0.1124
30 0.9453 0.1094 0.05469
31 0.9961 0.00772 0.00386
32 0.996 0.007991 0.003995
33 0.9937 0.01255 0.006277
34 0.9911 0.01782 0.008911
35 0.9871 0.02582 0.01291
36 0.9813 0.03736 0.01868
37 0.975 0.04995 0.02497
38 0.9716 0.0569 0.02845
39 0.9759 0.04819 0.02409
40 0.9736 0.05278 0.02639
41 0.972 0.05594 0.02797
42 0.9665 0.06702 0.03351
43 0.9726 0.05478 0.02739
44 0.9872 0.02564 0.01282
45 0.9855 0.02908 0.01454
46 0.9793 0.04133 0.02067
47 0.9717 0.05666 0.02833
48 0.962 0.07606 0.03803
49 0.9532 0.0936 0.0468
50 0.954 0.09205 0.04603
51 0.948 0.1041 0.05203
52 0.9612 0.0775 0.03875
53 0.9504 0.09911 0.04956
54 0.9453 0.1093 0.05465
55 0.9758 0.04837 0.02419
56 0.9918 0.01641 0.008206
57 0.9961 0.007773 0.003886
58 0.9947 0.01067 0.005334
59 0.9962 0.007694 0.003847
60 0.9957 0.00866 0.00433
61 0.9952 0.009519 0.004759
62 0.9962 0.007572 0.003786
63 0.9962 0.007585 0.003793
64 0.9961 0.007705 0.003852
65 0.9957 0.008537 0.004268
66 0.9962 0.007644 0.003822
67 0.9952 0.00969 0.004845
68 0.9955 0.008977 0.004488
69 0.998 0.003976 0.001988
70 0.9985 0.003036 0.001518
71 0.9978 0.00434 0.00217
72 0.9989 0.002231 0.001116
73 0.9984 0.003293 0.001646
74 0.9979 0.00412 0.00206
75 0.9975 0.005086 0.002543
76 0.9985 0.003032 0.001516
77 0.9984 0.003265 0.001633
78 0.9985 0.002928 0.001464
79 0.9984 0.003179 0.001589
80 0.9983 0.003424 0.001712
81 0.9982 0.003531 0.001765
82 0.9991 0.001871 0.0009353
83 0.9986 0.002859 0.00143
84 0.9989 0.002105 0.001052
85 0.9986 0.002787 0.001393
86 0.9984 0.003219 0.00161
87 0.998 0.004 0.002
88 0.9973 0.0054 0.0027
89 0.9961 0.00781 0.003905
90 0.9943 0.01147 0.005736
91 0.9951 0.009811 0.004905
92 0.9945 0.01095 0.005474
93 0.997 0.006098 0.003049
94 0.9955 0.00895 0.004475
95 0.9989 0.002271 0.001135
96 0.9985 0.002958 0.001479
97 0.999 0.00203 0.001015
98 0.9988 0.002497 0.001248
99 0.998 0.003984 0.001992
100 0.9973 0.005451 0.002726
101 0.9977 0.004644 0.002322
102 0.9963 0.007375 0.003688
103 0.9952 0.009578 0.004789
104 0.9931 0.01379 0.006895
105 0.9898 0.02036 0.01018
106 0.9883 0.02346 0.01173
107 0.9828 0.03431 0.01716
108 0.9761 0.04783 0.02392
109 0.9704 0.05916 0.02958
110 0.9594 0.08117 0.04059
111 0.943 0.1141 0.05705
112 0.944 0.112 0.056
113 0.9362 0.1276 0.06382
114 0.9118 0.1765 0.08824
115 0.9006 0.1988 0.09939
116 0.865 0.2699 0.135
117 0.8256 0.3488 0.1744
118 0.7735 0.4529 0.2265
119 0.768 0.464 0.232
120 0.7718 0.4565 0.2282
121 0.7074 0.5852 0.2926
122 0.7747 0.4507 0.2253
123 0.7976 0.4047 0.2024
124 0.7865 0.427 0.2135
125 0.7511 0.4978 0.2489
126 0.6808 0.6384 0.3192
127 0.5928 0.8144 0.4072
128 0.5119 0.9761 0.4881
129 0.5036 0.9928 0.4964
130 0.3773 0.7545 0.6227
131 0.529 0.942 0.471
132 0.3805 0.761 0.6195


Meta Analysis of Goldfeld-Quandt test for Heteroskedasticity
Description# significant tests% significant testsOK/NOK
1% type I error level46 0.4NOK
5% type I error level690.6NOK
10% type I error level840.730435NOK

\begin{tabular}{lllllllll}
\hline
Meta Analysis of Goldfeld-Quandt test for Heteroskedasticity \tabularnewline
Description & # significant tests & % significant tests & OK/NOK \tabularnewline
1% type I error level & 46 &  0.4 & NOK \tabularnewline
5% type I error level & 69 & 0.6 & NOK \tabularnewline
10% type I error level & 84 & 0.730435 & NOK \tabularnewline
\hline
\end{tabular}
%Source: https://freestatistics.org/blog/index.php?pk=304564&T=6

[TABLE]
[ROW][C]Meta Analysis of Goldfeld-Quandt test for Heteroskedasticity[/C][/ROW]
[ROW][C]Description[/C][C]# significant tests[/C][C]% significant tests[/C][C]OK/NOK[/C][/ROW]
[ROW][C]1% type I error level[/C][C]46[/C][C] 0.4[/C][C]NOK[/C][/ROW]
[ROW][C]5% type I error level[/C][C]69[/C][C]0.6[/C][C]NOK[/C][/ROW]
[ROW][C]10% type I error level[/C][C]84[/C][C]0.730435[/C][C]NOK[/C][/ROW]
[/TABLE]
Source: https://freestatistics.org/blog/index.php?pk=304564&T=6

Globally Unique Identifier (entire table): ba.freestatistics.org/blog/index.php?pk=304564&T=6

As an alternative you can also use a QR Code:  

The GUIDs for individual cells are displayed in the table below:

Meta Analysis of Goldfeld-Quandt test for Heteroskedasticity
Description# significant tests% significant testsOK/NOK
1% type I error level46 0.4NOK
5% type I error level690.6NOK
10% type I error level840.730435NOK


Ramsey RESET F-Test for powers (2 and 3) of fitted values
> reset_test_fitted
	RESET test
data:  mylm
RESET = 13.713, df1 = 2, df2 = 133, p-value = 3.849e-06
Ramsey RESET F-Test for powers (2 and 3) of regressors
> reset_test_regressors
	RESET test
data:  mylm
RESET = 1.3928, df1 = 28, df2 = 107, p-value = 0.1166
Ramsey RESET F-Test for powers (2 and 3) of principal components
> reset_test_principal_components
	RESET test
data:  mylm
RESET = 1.691, df1 = 2, df2 = 133, p-value = 0.1883

\begin{tabular}{lllllllll}
\hline
Ramsey RESET F-Test for powers (2 and 3) of fitted values \tabularnewline
> reset_test_fitted
	RESET test
data:  mylm
RESET = 13.713, df1 = 2, df2 = 133, p-value = 3.849e-06
\tabularnewline Ramsey RESET F-Test for powers (2 and 3) of regressors \tabularnewline
> reset_test_regressors
	RESET test
data:  mylm
RESET = 1.3928, df1 = 28, df2 = 107, p-value = 0.1166
\tabularnewline Ramsey RESET F-Test for powers (2 and 3) of principal components \tabularnewline
> reset_test_principal_components
	RESET test
data:  mylm
RESET = 1.691, df1 = 2, df2 = 133, p-value = 0.1883
\tabularnewline \hline \end{tabular} %Source: https://freestatistics.org/blog/index.php?pk=304564&T=7

[TABLE]
[ROW][C]Ramsey RESET F-Test for powers (2 and 3) of fitted values[/C][/ROW]
[ROW][C]
> reset_test_fitted
	RESET test
data:  mylm
RESET = 13.713, df1 = 2, df2 = 133, p-value = 3.849e-06
[/C][/ROW] [ROW][C]Ramsey RESET F-Test for powers (2 and 3) of regressors[/C][/ROW] [ROW][C]
> reset_test_regressors
	RESET test
data:  mylm
RESET = 1.3928, df1 = 28, df2 = 107, p-value = 0.1166
[/C][/ROW] [ROW][C]Ramsey RESET F-Test for powers (2 and 3) of principal components[/C][/ROW] [ROW][C]
> reset_test_principal_components
	RESET test
data:  mylm
RESET = 1.691, df1 = 2, df2 = 133, p-value = 0.1883
[/C][/ROW] [/TABLE] Source: https://freestatistics.org/blog/index.php?pk=304564&T=7

Globally Unique Identifier (entire table): ba.freestatistics.org/blog/index.php?pk=304564&T=7

As an alternative you can also use a QR Code:  

The GUIDs for individual cells are displayed in the table below:

Ramsey RESET F-Test for powers (2 and 3) of fitted values
> reset_test_fitted
	RESET test
data:  mylm
RESET = 13.713, df1 = 2, df2 = 133, p-value = 3.849e-06
Ramsey RESET F-Test for powers (2 and 3) of regressors
> reset_test_regressors
	RESET test
data:  mylm
RESET = 1.3928, df1 = 28, df2 = 107, p-value = 0.1166
Ramsey RESET F-Test for powers (2 and 3) of principal components
> reset_test_principal_components
	RESET test
data:  mylm
RESET = 1.691, df1 = 2, df2 = 133, p-value = 0.1883


Variance Inflation Factors (Multicollinearity)
> vif
 Bevr_Leeftijd         SKEOU1  `ITHSUM(t-1)`  `ITHSUM(t-2)`  `ITHSUM(t-3)` 
      1.061245       1.058833       1.084630       1.030652       1.051304 
 `ITHSUM(t-4)`  `ITHSUM(t-5)`  `ITHSUM(t-6)`  `ITHSUM(t-7)`  `ITHSUM(t-8)` 
      1.072337       1.066282       1.061652       1.077003       1.063230 
 `ITHSUM(t-9)` `ITHSUM(t-10)` `ITHSUM(t-11)` `ITHSUM(t-12)` 
      1.073633       1.062782       1.052455       1.059372 

\begin{tabular}{lllllllll}
\hline
Variance Inflation Factors (Multicollinearity) \tabularnewline
> vif
 Bevr_Leeftijd         SKEOU1  `ITHSUM(t-1)`  `ITHSUM(t-2)`  `ITHSUM(t-3)` 
      1.061245       1.058833       1.084630       1.030652       1.051304 
 `ITHSUM(t-4)`  `ITHSUM(t-5)`  `ITHSUM(t-6)`  `ITHSUM(t-7)`  `ITHSUM(t-8)` 
      1.072337       1.066282       1.061652       1.077003       1.063230 
 `ITHSUM(t-9)` `ITHSUM(t-10)` `ITHSUM(t-11)` `ITHSUM(t-12)` 
      1.073633       1.062782       1.052455       1.059372 
\tabularnewline \hline \end{tabular} %Source: https://freestatistics.org/blog/index.php?pk=304564&T=8

[TABLE]
[ROW][C]Variance Inflation Factors (Multicollinearity)[/C][/ROW]
[ROW][C]
> vif
 Bevr_Leeftijd         SKEOU1  `ITHSUM(t-1)`  `ITHSUM(t-2)`  `ITHSUM(t-3)` 
      1.061245       1.058833       1.084630       1.030652       1.051304 
 `ITHSUM(t-4)`  `ITHSUM(t-5)`  `ITHSUM(t-6)`  `ITHSUM(t-7)`  `ITHSUM(t-8)` 
      1.072337       1.066282       1.061652       1.077003       1.063230 
 `ITHSUM(t-9)` `ITHSUM(t-10)` `ITHSUM(t-11)` `ITHSUM(t-12)` 
      1.073633       1.062782       1.052455       1.059372 
[/C][/ROW] [/TABLE] Source: https://freestatistics.org/blog/index.php?pk=304564&T=8

Globally Unique Identifier (entire table): ba.freestatistics.org/blog/index.php?pk=304564&T=8

As an alternative you can also use a QR Code:  

The GUIDs for individual cells are displayed in the table below:

Variance Inflation Factors (Multicollinearity)
> vif
 Bevr_Leeftijd         SKEOU1  `ITHSUM(t-1)`  `ITHSUM(t-2)`  `ITHSUM(t-3)` 
      1.061245       1.058833       1.084630       1.030652       1.051304 
 `ITHSUM(t-4)`  `ITHSUM(t-5)`  `ITHSUM(t-6)`  `ITHSUM(t-7)`  `ITHSUM(t-8)` 
      1.072337       1.066282       1.061652       1.077003       1.063230 
 `ITHSUM(t-9)` `ITHSUM(t-10)` `ITHSUM(t-11)` `ITHSUM(t-12)` 
      1.073633       1.062782       1.052455       1.059372 


Parameters (Session):
par1 = 12 ; par2 = Triple ; par3 = additive ; par4 = 12 ;
Parameters (R input):
par1 = 1 ; par2 = Triple ; par3 = additive ; par4 = 12 ; par5 = ;
R code (references can be found in the software module):
par5 <- ''
par4 <- '12'
par3 <- 'additive'
par2 <- 'Triple'
par1 <- '2'
library(lattice)
library(lmtest)
library(car)
library(MASS)
n25 <- 25 #minimum number of obs. for Goldfeld-Quandt test
mywarning <- ''
par1 <- as.numeric(par1)
if(is.na(par1)) {
par1 <- 1
mywarning = 'Warning: you did not specify the column number of the endogenous series! The first column was selected by default.'
}
if (par4=='') par4 <- 0
par4 <- as.numeric(par4)
if (par5=='') par5 <- 0
par5 <- as.numeric(par5)
x <- na.omit(t(y))
k <- length(x[1,])
n <- length(x[,1])
x1 <- cbind(x[,par1], x[,1:k!=par1])
mycolnames <- c(colnames(x)[par1], colnames(x)[1:k!=par1])
colnames(x1) <- mycolnames #colnames(x)[par1]
x <- x1
if (par3 == 'First Differences'){
(n <- n -1)
x2 <- array(0, dim=c(n,k), dimnames=list(1:n, paste('(1-B)',colnames(x),sep='')))
for (i in 1:n) {
for (j in 1:k) {
x2[i,j] <- x[i+1,j] - x[i,j]
}
}
x <- x2
}
if (par3 == 'Seasonal Differences (s=12)'){
(n <- n - 12)
x2 <- array(0, dim=c(n,k), dimnames=list(1:n, paste('(1-B12)',colnames(x),sep='')))
for (i in 1:n) {
for (j in 1:k) {
x2[i,j] <- x[i+12,j] - x[i,j]
}
}
x <- x2
}
if (par3 == 'First and Seasonal Differences (s=12)'){
(n <- n -1)
x2 <- array(0, dim=c(n,k), dimnames=list(1:n, paste('(1-B)',colnames(x),sep='')))
for (i in 1:n) {
for (j in 1:k) {
x2[i,j] <- x[i+1,j] - x[i,j]
}
}
x <- x2
(n <- n - 12)
x2 <- array(0, dim=c(n,k), dimnames=list(1:n, paste('(1-B12)',colnames(x),sep='')))
for (i in 1:n) {
for (j in 1:k) {
x2[i,j] <- x[i+12,j] - x[i,j]
}
}
x <- x2
}
if(par4 > 0) {
x2 <- array(0, dim=c(n-par4,par4), dimnames=list(1:(n-par4), paste(colnames(x)[par1],'(t-',1:par4,')',sep='')))
for (i in 1:(n-par4)) {
for (j in 1:par4) {
x2[i,j] <- x[i+par4-j,par1]
}
}
x <- cbind(x[(par4+1):n,], x2)
n <- n - par4
}
if(par5 > 0) {
x2 <- array(0, dim=c(n-par5*12,par5), dimnames=list(1:(n-par5*12), paste(colnames(x)[par1],'(t-',1:par5,'s)',sep='')))
for (i in 1:(n-par5*12)) {
for (j in 1:par5) {
x2[i,j] <- x[i+par5*12-j*12,par1]
}
}
x <- cbind(x[(par5*12+1):n,], x2)
n <- n - par5*12
}
if (par2 == 'Include Monthly Dummies'){
x2 <- array(0, dim=c(n,11), dimnames=list(1:n, paste('M', seq(1:11), sep ='')))
for (i in 1:11){
x2[seq(i,n,12),i] <- 1
}
x <- cbind(x, x2)
}
if (par2 == 'Include Quarterly Dummies'){
x2 <- array(0, dim=c(n,3), dimnames=list(1:n, paste('Q', seq(1:3), sep ='')))
for (i in 1:3){
x2[seq(i,n,4),i] <- 1
}
x <- cbind(x, x2)
}
(k <- length(x[n,]))
if (par3 == 'Linear Trend'){
x <- cbind(x, c(1:n))
colnames(x)[k+1] <- 't'
}
print(x)
(k <- length(x[n,]))
head(x)
df <- as.data.frame(x)
(mylm <- lm(df))
(mysum <- summary(mylm))
if (n > n25) {
kp3 <- k + 3
nmkm3 <- n - k - 3
gqarr <- array(NA, dim=c(nmkm3-kp3+1,3))
numgqtests <- 0
numsignificant1 <- 0
numsignificant5 <- 0
numsignificant10 <- 0
for (mypoint in kp3:nmkm3) {
j <- 0
numgqtests <- numgqtests + 1
for (myalt in c('greater', 'two.sided', 'less')) {
j <- j + 1
gqarr[mypoint-kp3+1,j] <- gqtest(mylm, point=mypoint, alternative=myalt)$p.value
}
if (gqarr[mypoint-kp3+1,2] < 0.01) numsignificant1 <- numsignificant1 + 1
if (gqarr[mypoint-kp3+1,2] < 0.05) numsignificant5 <- numsignificant5 + 1
if (gqarr[mypoint-kp3+1,2] < 0.10) numsignificant10 <- numsignificant10 + 1
}
gqarr
}
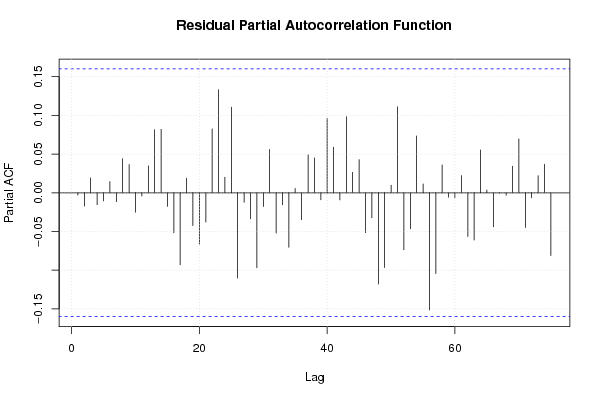
bitmap(file='test0.png')
plot(x[,1], type='l', main='Actuals and Interpolation', ylab='value of Actuals and Interpolation (dots)', xlab='time or index')
points(x[,1]-mysum$resid)
grid()
dev.off()
bitmap(file='test1.png')
plot(mysum$resid, type='b', pch=19, main='Residuals', ylab='value of Residuals', xlab='time or index')
grid()
dev.off()
bitmap(file='test2.png')
sresid <- studres(mylm)
hist(sresid, freq=FALSE, main='Distribution of Studentized Residuals')
xfit<-seq(min(sresid),max(sresid),length=40)
yfit<-dnorm(xfit)
lines(xfit, yfit)
grid()
dev.off()
bitmap(file='test3.png')
densityplot(~mysum$resid,col='black',main='Residual Density Plot', xlab='values of Residuals')
dev.off()
bitmap(file='test4.png')
qqPlot(mylm, main='QQ Plot')
grid()
dev.off()
(myerror <- as.ts(mysum$resid))
bitmap(file='test5.png')
dum <- cbind(lag(myerror,k=1),myerror)
dum
dum1 <- dum[2:length(myerror),]
dum1
z <- as.data.frame(dum1)
print(z)
plot(z,main=paste('Residual Lag plot, lowess, and regression line'), ylab='values of Residuals', xlab='lagged values of Residuals')
lines(lowess(z))
abline(lm(z))
grid()
dev.off()
bitmap(file='test6.png')
acf(mysum$resid, lag.max=length(mysum$resid)/2, main='Residual Autocorrelation Function')
grid()
dev.off()
bitmap(file='test7.png')
pacf(mysum$resid, lag.max=length(mysum$resid)/2, main='Residual Partial Autocorrelation Function')
grid()
dev.off()
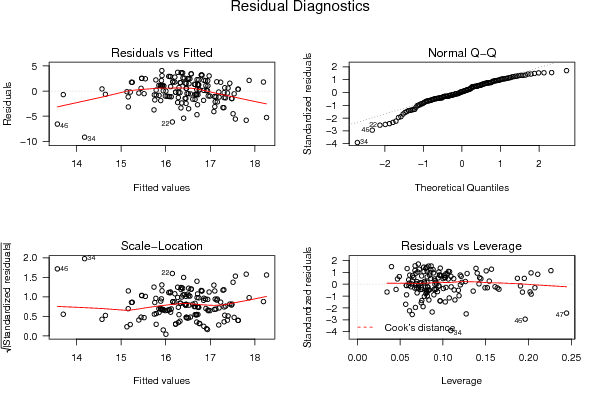
bitmap(file='test8.png')
opar <- par(mfrow = c(2,2), oma = c(0, 0, 1.1, 0))
plot(mylm, las = 1, sub='Residual Diagnostics')
par(opar)
dev.off()
if (n > n25) {
bitmap(file='test9.png')
plot(kp3:nmkm3,gqarr[,2], main='Goldfeld-Quandt test',ylab='2-sided p-value',xlab='breakpoint')
grid()
dev.off()
}
load(file='createtable')
a<-table.start()
a<-table.row.start(a)
a<-table.element(a, 'Multiple Linear Regression - Estimated Regression Equation', 1, TRUE)
a<-table.row.end(a)
myeq <- colnames(x)[1]
myeq <- paste(myeq, '[t] = ', sep='')
for (i in 1:k){
if (mysum$coefficients[i,1] > 0) myeq <- paste(myeq, '+', '')
myeq <- paste(myeq, signif(mysum$coefficients[i,1],6), sep=' ')
if (rownames(mysum$coefficients)[i] != '(Intercept)') {
myeq <- paste(myeq, rownames(mysum$coefficients)[i], sep='')
if (rownames(mysum$coefficients)[i] != 't') myeq <- paste(myeq, '[t]', sep='')
}
}
myeq <- paste(myeq, ' + e[t]')
a<-table.row.start(a)
a<-table.element(a, myeq)
a<-table.row.end(a)
a<-table.row.start(a)
a<-table.element(a, mywarning)
a<-table.row.end(a)
a<-table.end(a)
table.save(a,file='mytable1.tab')
a<-table.start()
a<-table.row.start(a)
a<-table.element(a,'Multiple Linear Regression - Ordinary Least Squares', 6, TRUE)
a<-table.row.end(a)
a<-table.row.start(a)
a<-table.element(a,'Variable',header=TRUE)
a<-table.element(a,'Parameter',header=TRUE)
a<-table.element(a,'S.D.',header=TRUE)
a<-table.element(a,'T-STAT
H0: parameter = 0',header=TRUE)
a<-table.element(a,'2-tail p-value',header=TRUE)
a<-table.element(a,'1-tail p-value',header=TRUE)
a<-table.row.end(a)
for (i in 1:k){
a<-table.row.start(a)
a<-table.element(a,rownames(mysum$coefficients)[i],header=TRUE)
a<-table.element(a,formatC(signif(mysum$coefficients[i,1],5),format='g',flag='+'))
a<-table.element(a,formatC(signif(mysum$coefficients[i,2],5),format='g',flag=' '))
a<-table.element(a,formatC(signif(mysum$coefficients[i,3],4),format='e',flag='+'))
a<-table.element(a,formatC(signif(mysum$coefficients[i,4],4),format='g',flag=' '))
a<-table.element(a,formatC(signif(mysum$coefficients[i,4]/2,4),format='g',flag=' '))
a<-table.row.end(a)
}
a<-table.end(a)
table.save(a,file='mytable2.tab')
a<-table.start()
a<-table.row.start(a)
a<-table.element(a, 'Multiple Linear Regression - Regression Statistics', 2, TRUE)
a<-table.row.end(a)
a<-table.row.start(a)
a<-table.element(a, 'Multiple R',1,TRUE)
a<-table.element(a,formatC(signif(sqrt(mysum$r.squared),6),format='g',flag=' '))
a<-table.row.end(a)
a<-table.row.start(a)
a<-table.element(a, 'R-squared',1,TRUE)
a<-table.element(a,formatC(signif(mysum$r.squared,6),format='g',flag=' '))
a<-table.row.end(a)
a<-table.row.start(a)
a<-table.element(a, 'Adjusted R-squared',1,TRUE)
a<-table.element(a,formatC(signif(mysum$adj.r.squared,6),format='g',flag=' '))
a<-table.row.end(a)
a<-table.row.start(a)
a<-table.element(a, 'F-TEST (value)',1,TRUE)
a<-table.element(a,formatC(signif(mysum$fstatistic[1],6),format='g',flag=' '))
a<-table.row.end(a)
a<-table.row.start(a)
a<-table.element(a, 'F-TEST (DF numerator)',1,TRUE)
a<-table.element(a, signif(mysum$fstatistic[2],6))
a<-table.row.end(a)
a<-table.row.start(a)
a<-table.element(a, 'F-TEST (DF denominator)',1,TRUE)
a<-table.element(a, signif(mysum$fstatistic[3],6))
a<-table.row.end(a)
a<-table.row.start(a)
a<-table.element(a, 'p-value',1,TRUE)
a<-table.element(a,formatC(signif(1-pf(mysum$fstatistic[1],mysum$fstatistic[2],mysum$fstatistic[3]),6),format='g',flag=' '))
a<-table.row.end(a)
a<-table.row.start(a)
a<-table.element(a, 'Multiple Linear Regression - Residual Statistics', 2, TRUE)
a<-table.row.end(a)
a<-table.row.start(a)
a<-table.element(a, 'Residual Standard Deviation',1,TRUE)
a<-table.element(a,formatC(signif(mysum$sigma,6),format='g',flag=' '))
a<-table.row.end(a)
a<-table.row.start(a)
a<-table.element(a, 'Sum Squared Residuals',1,TRUE)
a<-table.element(a,formatC(signif(sum(myerror*myerror),6),format='g',flag=' '))
a<-table.row.end(a)
a<-table.end(a)
table.save(a,file='mytable3.tab')
myr <- as.numeric(mysum$resid)
myr
if(n < 200) {
a<-table.start()
a<-table.row.start(a)
a<-table.element(a, 'Multiple Linear Regression - Actuals, Interpolation, and Residuals', 4, TRUE)
a<-table.row.end(a)
a<-table.row.start(a)
a<-table.element(a, 'Time or Index', 1, TRUE)
a<-table.element(a, 'Actuals', 1, TRUE)
a<-table.element(a, 'Interpolation
Forecast', 1, TRUE)
a<-table.element(a, 'Residuals
Prediction Error', 1, TRUE)
a<-table.row.end(a)
for (i in 1:n) {
a<-table.row.start(a)
a<-table.element(a,i, 1, TRUE)
a<-table.element(a,formatC(signif(x[i],6),format='g',flag=' '))
a<-table.element(a,formatC(signif(x[i]-mysum$resid[i],6),format='g',flag=' '))
a<-table.element(a,formatC(signif(mysum$resid[i],6),format='g',flag=' '))
a<-table.row.end(a)
}
a<-table.end(a)
table.save(a,file='mytable4.tab')
if (n > n25) {
a<-table.start()
a<-table.row.start(a)
a<-table.element(a,'Goldfeld-Quandt test for Heteroskedasticity',4,TRUE)
a<-table.row.end(a)
a<-table.row.start(a)
a<-table.element(a,'p-values',header=TRUE)
a<-table.element(a,'Alternative Hypothesis',3,header=TRUE)
a<-table.row.end(a)
a<-table.row.start(a)
a<-table.element(a,'breakpoint index',header=TRUE)
a<-table.element(a,'greater',header=TRUE)
a<-table.element(a,'2-sided',header=TRUE)
a<-table.element(a,'less',header=TRUE)
a<-table.row.end(a)
for (mypoint in kp3:nmkm3) {
a<-table.row.start(a)
a<-table.element(a,mypoint,header=TRUE)
a<-table.element(a,formatC(signif(gqarr[mypoint-kp3+1,1],6),format='g',flag=' '))
a<-table.element(a,formatC(signif(gqarr[mypoint-kp3+1,2],6),format='g',flag=' '))
a<-table.element(a,formatC(signif(gqarr[mypoint-kp3+1,3],6),format='g',flag=' '))
a<-table.row.end(a)
}
a<-table.end(a)
table.save(a,file='mytable5.tab')
a<-table.start()
a<-table.row.start(a)
a<-table.element(a,'Meta Analysis of Goldfeld-Quandt test for Heteroskedasticity',4,TRUE)
a<-table.row.end(a)
a<-table.row.start(a)
a<-table.element(a,'Description',header=TRUE)
a<-table.element(a,'# significant tests',header=TRUE)
a<-table.element(a,'% significant tests',header=TRUE)
a<-table.element(a,'OK/NOK',header=TRUE)
a<-table.row.end(a)
a<-table.row.start(a)
a<-table.element(a,'1% type I error level',header=TRUE)
a<-table.element(a,signif(numsignificant1,6))
a<-table.element(a,formatC(signif(numsignificant1/numgqtests,6),format='g',flag=' '))
if (numsignificant1/numgqtests < 0.01) dum <- 'OK' else dum <- 'NOK'
a<-table.element(a,dum)
a<-table.row.end(a)
a<-table.row.start(a)
a<-table.element(a,'5% type I error level',header=TRUE)
a<-table.element(a,signif(numsignificant5,6))
a<-table.element(a,signif(numsignificant5/numgqtests,6))
if (numsignificant5/numgqtests < 0.05) dum <- 'OK' else dum <- 'NOK'
a<-table.element(a,dum)
a<-table.row.end(a)
a<-table.row.start(a)
a<-table.element(a,'10% type I error level',header=TRUE)
a<-table.element(a,signif(numsignificant10,6))
a<-table.element(a,signif(numsignificant10/numgqtests,6))
if (numsignificant10/numgqtests < 0.1) dum <- 'OK' else dum <- 'NOK'
a<-table.element(a,dum)
a<-table.row.end(a)
a<-table.end(a)
table.save(a,file='mytable6.tab')
}
}
a<-table.start()
a<-table.row.start(a)
a<-table.element(a,'Ramsey RESET F-Test for powers (2 and 3) of fitted values',1,TRUE)
a<-table.row.end(a)
a<-table.row.start(a)
reset_test_fitted <- resettest(mylm,power=2:3,type='fitted')
a<-table.element(a,paste('
',RC.texteval('reset_test_fitted'),'
',sep=''))
a<-table.row.end(a)
a<-table.row.start(a)
a<-table.element(a,'Ramsey RESET F-Test for powers (2 and 3) of regressors',1,TRUE)
a<-table.row.end(a)
a<-table.row.start(a)
reset_test_regressors <- resettest(mylm,power=2:3,type='regressor')
a<-table.element(a,paste('
',RC.texteval('reset_test_regressors'),'
',sep=''))
a<-table.row.end(a)
a<-table.row.start(a)
a<-table.element(a,'Ramsey RESET F-Test for powers (2 and 3) of principal components',1,TRUE)
a<-table.row.end(a)
a<-table.row.start(a)
reset_test_principal_components <- resettest(mylm,power=2:3,type='princomp')
a<-table.element(a,paste('
',RC.texteval('reset_test_principal_components'),'
',sep=''))
a<-table.row.end(a)
a<-table.end(a)
table.save(a,file='mytable8.tab')
a<-table.start()
a<-table.row.start(a)
a<-table.element(a,'Variance Inflation Factors (Multicollinearity)',1,TRUE)
a<-table.row.end(a)
a<-table.row.start(a)
vif <- vif(mylm)
a<-table.element(a,paste('
',RC.texteval('vif'),'
',sep=''))
a<-table.row.end(a)
a<-table.end(a)
table.save(a,file='mytable9.tab')