Free Statistics

of Irreproducible Research!

Author's title

Author*The author of this computation has been verified*
R Software Modulerwasp_autocorrelation.wasp
Title produced by software(Partial) Autocorrelation Function
Date of computationMon, 23 Jan 2017 09:44:38 +0100
Cite this page as followsStatistical Computations at FreeStatistics.org, Office for Research Development and Education, URL https://freestatistics.org/blog/index.php?v=date/2017/Jan/23/t1485161094aihb28a1jflhfsa.htm/, Retrieved Wed, 15 May 2024 11:01:02 +0000
Statistical Computations at FreeStatistics.org, Office for Research Development and Education, URL https://freestatistics.org/blog/index.php?pk=304055, Retrieved Wed, 15 May 2024 11:01:02 +0000
QR Codes:

Original text written by user:
IsPrivate?No (this computation is public)
User-defined keywords
Estimated Impact41
Family? (F = Feedback message, R = changed R code, M = changed R Module, P = changed Parameters, D = changed Data)
-       [(Partial) Autocorrelation Function] [tijdreeks] [2017-01-23 08:44:38] [e4ec2dc388263dc7bca2f210fca20b5e] [Current]
Feedback Forum

Post a new message
Dataseries X:
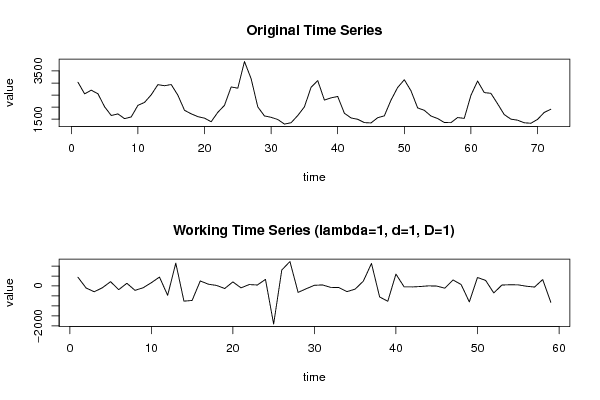
3035
2552
2704
2554
2014
1655
1721
1524
1596
2074
2199
2512
2933
2889
2938
2497
1870
1726
1607
1545
1396
1787
2076
2837
2787
3891
3179
2011
1636
1580
1489
1300
1356
1653
2013
2823
3102
2294
2385
2444
1748
1554
1498
1361
1346
1564
1640
2293
2815
3137
2679
1969
1870
1633
1529
1366
1357
1570
1535
2491
3084
2605
2573
2143
1693
1504
1461
1354
1333
1492
1781
1915


Summary of computational transaction
Raw Input view raw input (R code)
Raw Outputview raw output of R engine
Computing time2 seconds
R ServerBig Analytics Cloud Computing Center

\begin{tabular}{lllllllll}
\hline
Summary of computational transaction \tabularnewline
Raw Input view raw input (R code)  \tabularnewline
Raw Outputview raw output of R engine  \tabularnewline
Computing time2 seconds \tabularnewline
R ServerBig Analytics Cloud Computing Center \tabularnewline
\hline
\end{tabular}
%Source: https://freestatistics.org/blog/index.php?pk=304055&T=0

[TABLE]
[ROW]
Summary of computational transaction[/C][/ROW] [ROW]Raw Input[/C] view raw input (R code) [/C][/ROW] [ROW]Raw Output[/C]view raw output of R engine [/C][/ROW] [ROW]Computing time[/C]2 seconds[/C][/ROW] [ROW]R Server[/C]Big Analytics Cloud Computing Center[/C][/ROW] [/TABLE] Source: https://freestatistics.org/blog/index.php?pk=304055&T=0

Globally Unique Identifier (entire table): ba.freestatistics.org/blog/index.php?pk=304055&T=0

As an alternative you can also use a QR Code:  

The GUIDs for individual cells are displayed in the table below:

Summary of computational transaction
Raw Input view raw input (R code)
Raw Outputview raw output of R engine
Computing time2 seconds
R ServerBig Analytics Cloud Computing Center


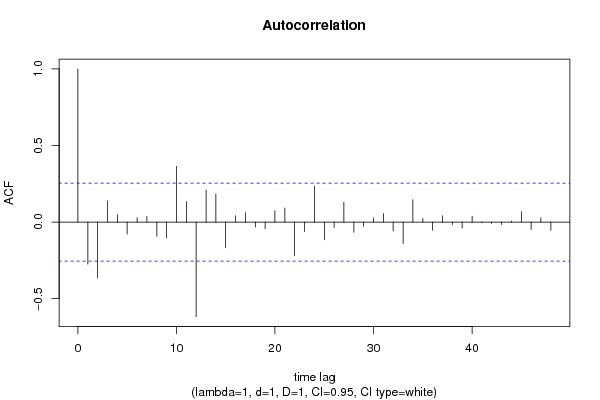
Autocorrelation Function
Time lag kACF(k)T-STATP-value
1-0.274454-2.10810.019639
2-0.365156-2.80480.003403
30.137451.05580.147689
40.0489130.37570.35424
5-0.077648-0.59640.276587
60.0285690.21940.413531
70.0369970.28420.388633
8-0.092297-0.70890.240575
9-0.102703-0.78890.216672
100.3651642.80490.003403
110.1351941.03840.151651
12-0.617126-4.74027e-06
130.2102581.6150.055821
140.1832641.40770.082236
15-0.167875-1.28950.101133
160.0418570.32150.37448
170.0619730.4760.317907
18-0.031662-0.24320.404346
19-0.043487-0.3340.369771
200.0746850.57370.284188
210.0923110.70910.240542
22-0.218677-1.67970.049153
23-0.06183-0.47490.318296
240.2353041.80740.037899
25-0.115595-0.88790.189099
26-0.035646-0.27380.392597
270.1303491.00120.160402
28-0.066401-0.510.305964
29-0.027096-0.20810.417924
300.027970.21480.415316
310.0562960.43240.333508
32-0.058374-0.44840.327761
33-0.139828-1.0740.14359
340.1463361.1240.132778
350.0234850.18040.428733
36-0.052887-0.40620.343021
370.0406720.31240.377915
38-0.01564-0.12010.452394
39-0.039353-0.30230.381754
400.0379170.29120.385941
41-0.004258-0.03270.487008
42-0.008661-0.06650.473592
43-0.015029-0.11540.454244
440.006930.05320.478863
450.0686820.52760.299893
46-0.04819-0.37020.356297
470.0279710.21480.415313
48-0.053054-0.40750.342553

\begin{tabular}{lllllllll}
\hline
Autocorrelation Function \tabularnewline
Time lag k & ACF(k) & T-STAT & P-value \tabularnewline
1 & -0.274454 & -2.1081 & 0.019639 \tabularnewline
2 & -0.365156 & -2.8048 & 0.003403 \tabularnewline
3 & 0.13745 & 1.0558 & 0.147689 \tabularnewline
4 & 0.048913 & 0.3757 & 0.35424 \tabularnewline
5 & -0.077648 & -0.5964 & 0.276587 \tabularnewline
6 & 0.028569 & 0.2194 & 0.413531 \tabularnewline
7 & 0.036997 & 0.2842 & 0.388633 \tabularnewline
8 & -0.092297 & -0.7089 & 0.240575 \tabularnewline
9 & -0.102703 & -0.7889 & 0.216672 \tabularnewline
10 & 0.365164 & 2.8049 & 0.003403 \tabularnewline
11 & 0.135194 & 1.0384 & 0.151651 \tabularnewline
12 & -0.617126 & -4.7402 & 7e-06 \tabularnewline
13 & 0.210258 & 1.615 & 0.055821 \tabularnewline
14 & 0.183264 & 1.4077 & 0.082236 \tabularnewline
15 & -0.167875 & -1.2895 & 0.101133 \tabularnewline
16 & 0.041857 & 0.3215 & 0.37448 \tabularnewline
17 & 0.061973 & 0.476 & 0.317907 \tabularnewline
18 & -0.031662 & -0.2432 & 0.404346 \tabularnewline
19 & -0.043487 & -0.334 & 0.369771 \tabularnewline
20 & 0.074685 & 0.5737 & 0.284188 \tabularnewline
21 & 0.092311 & 0.7091 & 0.240542 \tabularnewline
22 & -0.218677 & -1.6797 & 0.049153 \tabularnewline
23 & -0.06183 & -0.4749 & 0.318296 \tabularnewline
24 & 0.235304 & 1.8074 & 0.037899 \tabularnewline
25 & -0.115595 & -0.8879 & 0.189099 \tabularnewline
26 & -0.035646 & -0.2738 & 0.392597 \tabularnewline
27 & 0.130349 & 1.0012 & 0.160402 \tabularnewline
28 & -0.066401 & -0.51 & 0.305964 \tabularnewline
29 & -0.027096 & -0.2081 & 0.417924 \tabularnewline
30 & 0.02797 & 0.2148 & 0.415316 \tabularnewline
31 & 0.056296 & 0.4324 & 0.333508 \tabularnewline
32 & -0.058374 & -0.4484 & 0.327761 \tabularnewline
33 & -0.139828 & -1.074 & 0.14359 \tabularnewline
34 & 0.146336 & 1.124 & 0.132778 \tabularnewline
35 & 0.023485 & 0.1804 & 0.428733 \tabularnewline
36 & -0.052887 & -0.4062 & 0.343021 \tabularnewline
37 & 0.040672 & 0.3124 & 0.377915 \tabularnewline
38 & -0.01564 & -0.1201 & 0.452394 \tabularnewline
39 & -0.039353 & -0.3023 & 0.381754 \tabularnewline
40 & 0.037917 & 0.2912 & 0.385941 \tabularnewline
41 & -0.004258 & -0.0327 & 0.487008 \tabularnewline
42 & -0.008661 & -0.0665 & 0.473592 \tabularnewline
43 & -0.015029 & -0.1154 & 0.454244 \tabularnewline
44 & 0.00693 & 0.0532 & 0.478863 \tabularnewline
45 & 0.068682 & 0.5276 & 0.299893 \tabularnewline
46 & -0.04819 & -0.3702 & 0.356297 \tabularnewline
47 & 0.027971 & 0.2148 & 0.415313 \tabularnewline
48 & -0.053054 & -0.4075 & 0.342553 \tabularnewline
\hline
\end{tabular}
%Source: https://freestatistics.org/blog/index.php?pk=304055&T=1

[TABLE]
[ROW][C]Autocorrelation Function[/C][/ROW]
[ROW][C]Time lag k[/C][C]ACF(k)[/C][C]T-STAT[/C][C]P-value[/C][/ROW]
[ROW][C]1[/C][C]-0.274454[/C][C]-2.1081[/C][C]0.019639[/C][/ROW]
[ROW][C]2[/C][C]-0.365156[/C][C]-2.8048[/C][C]0.003403[/C][/ROW]
[ROW][C]3[/C][C]0.13745[/C][C]1.0558[/C][C]0.147689[/C][/ROW]
[ROW][C]4[/C][C]0.048913[/C][C]0.3757[/C][C]0.35424[/C][/ROW]
[ROW][C]5[/C][C]-0.077648[/C][C]-0.5964[/C][C]0.276587[/C][/ROW]
[ROW][C]6[/C][C]0.028569[/C][C]0.2194[/C][C]0.413531[/C][/ROW]
[ROW][C]7[/C][C]0.036997[/C][C]0.2842[/C][C]0.388633[/C][/ROW]
[ROW][C]8[/C][C]-0.092297[/C][C]-0.7089[/C][C]0.240575[/C][/ROW]
[ROW][C]9[/C][C]-0.102703[/C][C]-0.7889[/C][C]0.216672[/C][/ROW]
[ROW][C]10[/C][C]0.365164[/C][C]2.8049[/C][C]0.003403[/C][/ROW]
[ROW][C]11[/C][C]0.135194[/C][C]1.0384[/C][C]0.151651[/C][/ROW]
[ROW][C]12[/C][C]-0.617126[/C][C]-4.7402[/C][C]7e-06[/C][/ROW]
[ROW][C]13[/C][C]0.210258[/C][C]1.615[/C][C]0.055821[/C][/ROW]
[ROW][C]14[/C][C]0.183264[/C][C]1.4077[/C][C]0.082236[/C][/ROW]
[ROW][C]15[/C][C]-0.167875[/C][C]-1.2895[/C][C]0.101133[/C][/ROW]
[ROW][C]16[/C][C]0.041857[/C][C]0.3215[/C][C]0.37448[/C][/ROW]
[ROW][C]17[/C][C]0.061973[/C][C]0.476[/C][C]0.317907[/C][/ROW]
[ROW][C]18[/C][C]-0.031662[/C][C]-0.2432[/C][C]0.404346[/C][/ROW]
[ROW][C]19[/C][C]-0.043487[/C][C]-0.334[/C][C]0.369771[/C][/ROW]
[ROW][C]20[/C][C]0.074685[/C][C]0.5737[/C][C]0.284188[/C][/ROW]
[ROW][C]21[/C][C]0.092311[/C][C]0.7091[/C][C]0.240542[/C][/ROW]
[ROW][C]22[/C][C]-0.218677[/C][C]-1.6797[/C][C]0.049153[/C][/ROW]
[ROW][C]23[/C][C]-0.06183[/C][C]-0.4749[/C][C]0.318296[/C][/ROW]
[ROW][C]24[/C][C]0.235304[/C][C]1.8074[/C][C]0.037899[/C][/ROW]
[ROW][C]25[/C][C]-0.115595[/C][C]-0.8879[/C][C]0.189099[/C][/ROW]
[ROW][C]26[/C][C]-0.035646[/C][C]-0.2738[/C][C]0.392597[/C][/ROW]
[ROW][C]27[/C][C]0.130349[/C][C]1.0012[/C][C]0.160402[/C][/ROW]
[ROW][C]28[/C][C]-0.066401[/C][C]-0.51[/C][C]0.305964[/C][/ROW]
[ROW][C]29[/C][C]-0.027096[/C][C]-0.2081[/C][C]0.417924[/C][/ROW]
[ROW][C]30[/C][C]0.02797[/C][C]0.2148[/C][C]0.415316[/C][/ROW]
[ROW][C]31[/C][C]0.056296[/C][C]0.4324[/C][C]0.333508[/C][/ROW]
[ROW][C]32[/C][C]-0.058374[/C][C]-0.4484[/C][C]0.327761[/C][/ROW]
[ROW][C]33[/C][C]-0.139828[/C][C]-1.074[/C][C]0.14359[/C][/ROW]
[ROW][C]34[/C][C]0.146336[/C][C]1.124[/C][C]0.132778[/C][/ROW]
[ROW][C]35[/C][C]0.023485[/C][C]0.1804[/C][C]0.428733[/C][/ROW]
[ROW][C]36[/C][C]-0.052887[/C][C]-0.4062[/C][C]0.343021[/C][/ROW]
[ROW][C]37[/C][C]0.040672[/C][C]0.3124[/C][C]0.377915[/C][/ROW]
[ROW][C]38[/C][C]-0.01564[/C][C]-0.1201[/C][C]0.452394[/C][/ROW]
[ROW][C]39[/C][C]-0.039353[/C][C]-0.3023[/C][C]0.381754[/C][/ROW]
[ROW][C]40[/C][C]0.037917[/C][C]0.2912[/C][C]0.385941[/C][/ROW]
[ROW][C]41[/C][C]-0.004258[/C][C]-0.0327[/C][C]0.487008[/C][/ROW]
[ROW][C]42[/C][C]-0.008661[/C][C]-0.0665[/C][C]0.473592[/C][/ROW]
[ROW][C]43[/C][C]-0.015029[/C][C]-0.1154[/C][C]0.454244[/C][/ROW]
[ROW][C]44[/C][C]0.00693[/C][C]0.0532[/C][C]0.478863[/C][/ROW]
[ROW][C]45[/C][C]0.068682[/C][C]0.5276[/C][C]0.299893[/C][/ROW]
[ROW][C]46[/C][C]-0.04819[/C][C]-0.3702[/C][C]0.356297[/C][/ROW]
[ROW][C]47[/C][C]0.027971[/C][C]0.2148[/C][C]0.415313[/C][/ROW]
[ROW][C]48[/C][C]-0.053054[/C][C]-0.4075[/C][C]0.342553[/C][/ROW]
[/TABLE]
Source: https://freestatistics.org/blog/index.php?pk=304055&T=1

Globally Unique Identifier (entire table): ba.freestatistics.org/blog/index.php?pk=304055&T=1

As an alternative you can also use a QR Code:  

The GUIDs for individual cells are displayed in the table below:

Autocorrelation Function
Time lag kACF(k)T-STATP-value
1-0.274454-2.10810.019639
2-0.365156-2.80480.003403
30.137451.05580.147689
40.0489130.37570.35424
5-0.077648-0.59640.276587
60.0285690.21940.413531
70.0369970.28420.388633
8-0.092297-0.70890.240575
9-0.102703-0.78890.216672
100.3651642.80490.003403
110.1351941.03840.151651
12-0.617126-4.74027e-06
130.2102581.6150.055821
140.1832641.40770.082236
15-0.167875-1.28950.101133
160.0418570.32150.37448
170.0619730.4760.317907
18-0.031662-0.24320.404346
19-0.043487-0.3340.369771
200.0746850.57370.284188
210.0923110.70910.240542
22-0.218677-1.67970.049153
23-0.06183-0.47490.318296
240.2353041.80740.037899
25-0.115595-0.88790.189099
26-0.035646-0.27380.392597
270.1303491.00120.160402
28-0.066401-0.510.305964
29-0.027096-0.20810.417924
300.027970.21480.415316
310.0562960.43240.333508
32-0.058374-0.44840.327761
33-0.139828-1.0740.14359
340.1463361.1240.132778
350.0234850.18040.428733
36-0.052887-0.40620.343021
370.0406720.31240.377915
38-0.01564-0.12010.452394
39-0.039353-0.30230.381754
400.0379170.29120.385941
41-0.004258-0.03270.487008
42-0.008661-0.06650.473592
43-0.015029-0.11540.454244
440.006930.05320.478863
450.0686820.52760.299893
46-0.04819-0.37020.356297
470.0279710.21480.415313
48-0.053054-0.40750.342553


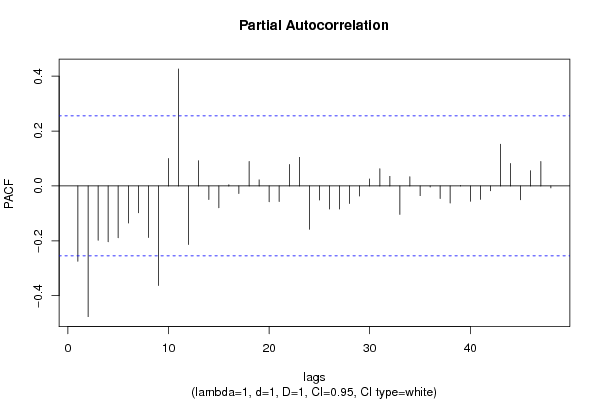
Partial Autocorrelation Function
Time lag kPACF(k)T-STATP-value
1-0.274454-2.10810.019639
2-0.476363-3.6590.000271
3-0.197594-1.51770.06721
4-0.203612-1.5640.061586
5-0.18887-1.45070.076075
6-0.134915-1.03630.152144
7-0.097413-0.74820.228643
8-0.187628-1.44120.077408
9-0.362758-2.78640.003579
100.1001880.76960.222317
110.4265923.27670.000881
12-0.213395-1.63910.053255
130.0921860.70810.240838
14-0.049171-0.37770.353509
15-0.07942-0.610.272091
160.0046380.03560.48585
17-0.027445-0.21080.416882
180.0892420.68550.247862
190.0222750.17110.432368
20-0.057448-0.44130.330316
21-0.056408-0.43330.333197
220.0785040.6030.274409
230.1043790.80170.212958
24-0.157995-1.21360.114871
25-0.051157-0.39290.347888
26-0.084101-0.6460.260395
27-0.083672-0.64270.261456
28-0.064212-0.49320.311842
29-0.036547-0.28070.389953
300.0254090.19520.422964
310.0629140.48330.315353
320.0349780.26870.394561
33-0.103495-0.7950.214911
340.0335770.25790.398686
35-0.035294-0.27110.393629
36-0.003486-0.02680.489363
37-0.045459-0.34920.364099
38-0.062339-0.47880.316912
390.001480.01140.495483
40-0.05589-0.42930.334633
41-0.048964-0.37610.354097
42-0.017373-0.13340.447148
430.1520591.1680.123755
440.0818470.62870.265993
45-0.050293-0.38630.350331
460.0554130.42560.335961
470.0889850.68350.248481
48-0.006969-0.05350.478744

\begin{tabular}{lllllllll}
\hline
Partial Autocorrelation Function \tabularnewline
Time lag k & PACF(k) & T-STAT & P-value \tabularnewline
1 & -0.274454 & -2.1081 & 0.019639 \tabularnewline
2 & -0.476363 & -3.659 & 0.000271 \tabularnewline
3 & -0.197594 & -1.5177 & 0.06721 \tabularnewline
4 & -0.203612 & -1.564 & 0.061586 \tabularnewline
5 & -0.18887 & -1.4507 & 0.076075 \tabularnewline
6 & -0.134915 & -1.0363 & 0.152144 \tabularnewline
7 & -0.097413 & -0.7482 & 0.228643 \tabularnewline
8 & -0.187628 & -1.4412 & 0.077408 \tabularnewline
9 & -0.362758 & -2.7864 & 0.003579 \tabularnewline
10 & 0.100188 & 0.7696 & 0.222317 \tabularnewline
11 & 0.426592 & 3.2767 & 0.000881 \tabularnewline
12 & -0.213395 & -1.6391 & 0.053255 \tabularnewline
13 & 0.092186 & 0.7081 & 0.240838 \tabularnewline
14 & -0.049171 & -0.3777 & 0.353509 \tabularnewline
15 & -0.07942 & -0.61 & 0.272091 \tabularnewline
16 & 0.004638 & 0.0356 & 0.48585 \tabularnewline
17 & -0.027445 & -0.2108 & 0.416882 \tabularnewline
18 & 0.089242 & 0.6855 & 0.247862 \tabularnewline
19 & 0.022275 & 0.1711 & 0.432368 \tabularnewline
20 & -0.057448 & -0.4413 & 0.330316 \tabularnewline
21 & -0.056408 & -0.4333 & 0.333197 \tabularnewline
22 & 0.078504 & 0.603 & 0.274409 \tabularnewline
23 & 0.104379 & 0.8017 & 0.212958 \tabularnewline
24 & -0.157995 & -1.2136 & 0.114871 \tabularnewline
25 & -0.051157 & -0.3929 & 0.347888 \tabularnewline
26 & -0.084101 & -0.646 & 0.260395 \tabularnewline
27 & -0.083672 & -0.6427 & 0.261456 \tabularnewline
28 & -0.064212 & -0.4932 & 0.311842 \tabularnewline
29 & -0.036547 & -0.2807 & 0.389953 \tabularnewline
30 & 0.025409 & 0.1952 & 0.422964 \tabularnewline
31 & 0.062914 & 0.4833 & 0.315353 \tabularnewline
32 & 0.034978 & 0.2687 & 0.394561 \tabularnewline
33 & -0.103495 & -0.795 & 0.214911 \tabularnewline
34 & 0.033577 & 0.2579 & 0.398686 \tabularnewline
35 & -0.035294 & -0.2711 & 0.393629 \tabularnewline
36 & -0.003486 & -0.0268 & 0.489363 \tabularnewline
37 & -0.045459 & -0.3492 & 0.364099 \tabularnewline
38 & -0.062339 & -0.4788 & 0.316912 \tabularnewline
39 & 0.00148 & 0.0114 & 0.495483 \tabularnewline
40 & -0.05589 & -0.4293 & 0.334633 \tabularnewline
41 & -0.048964 & -0.3761 & 0.354097 \tabularnewline
42 & -0.017373 & -0.1334 & 0.447148 \tabularnewline
43 & 0.152059 & 1.168 & 0.123755 \tabularnewline
44 & 0.081847 & 0.6287 & 0.265993 \tabularnewline
45 & -0.050293 & -0.3863 & 0.350331 \tabularnewline
46 & 0.055413 & 0.4256 & 0.335961 \tabularnewline
47 & 0.088985 & 0.6835 & 0.248481 \tabularnewline
48 & -0.006969 & -0.0535 & 0.478744 \tabularnewline
\hline
\end{tabular}
%Source: https://freestatistics.org/blog/index.php?pk=304055&T=2

[TABLE]
[ROW][C]Partial Autocorrelation Function[/C][/ROW]
[ROW][C]Time lag k[/C][C]PACF(k)[/C][C]T-STAT[/C][C]P-value[/C][/ROW]
[ROW][C]1[/C][C]-0.274454[/C][C]-2.1081[/C][C]0.019639[/C][/ROW]
[ROW][C]2[/C][C]-0.476363[/C][C]-3.659[/C][C]0.000271[/C][/ROW]
[ROW][C]3[/C][C]-0.197594[/C][C]-1.5177[/C][C]0.06721[/C][/ROW]
[ROW][C]4[/C][C]-0.203612[/C][C]-1.564[/C][C]0.061586[/C][/ROW]
[ROW][C]5[/C][C]-0.18887[/C][C]-1.4507[/C][C]0.076075[/C][/ROW]
[ROW][C]6[/C][C]-0.134915[/C][C]-1.0363[/C][C]0.152144[/C][/ROW]
[ROW][C]7[/C][C]-0.097413[/C][C]-0.7482[/C][C]0.228643[/C][/ROW]
[ROW][C]8[/C][C]-0.187628[/C][C]-1.4412[/C][C]0.077408[/C][/ROW]
[ROW][C]9[/C][C]-0.362758[/C][C]-2.7864[/C][C]0.003579[/C][/ROW]
[ROW][C]10[/C][C]0.100188[/C][C]0.7696[/C][C]0.222317[/C][/ROW]
[ROW][C]11[/C][C]0.426592[/C][C]3.2767[/C][C]0.000881[/C][/ROW]
[ROW][C]12[/C][C]-0.213395[/C][C]-1.6391[/C][C]0.053255[/C][/ROW]
[ROW][C]13[/C][C]0.092186[/C][C]0.7081[/C][C]0.240838[/C][/ROW]
[ROW][C]14[/C][C]-0.049171[/C][C]-0.3777[/C][C]0.353509[/C][/ROW]
[ROW][C]15[/C][C]-0.07942[/C][C]-0.61[/C][C]0.272091[/C][/ROW]
[ROW][C]16[/C][C]0.004638[/C][C]0.0356[/C][C]0.48585[/C][/ROW]
[ROW][C]17[/C][C]-0.027445[/C][C]-0.2108[/C][C]0.416882[/C][/ROW]
[ROW][C]18[/C][C]0.089242[/C][C]0.6855[/C][C]0.247862[/C][/ROW]
[ROW][C]19[/C][C]0.022275[/C][C]0.1711[/C][C]0.432368[/C][/ROW]
[ROW][C]20[/C][C]-0.057448[/C][C]-0.4413[/C][C]0.330316[/C][/ROW]
[ROW][C]21[/C][C]-0.056408[/C][C]-0.4333[/C][C]0.333197[/C][/ROW]
[ROW][C]22[/C][C]0.078504[/C][C]0.603[/C][C]0.274409[/C][/ROW]
[ROW][C]23[/C][C]0.104379[/C][C]0.8017[/C][C]0.212958[/C][/ROW]
[ROW][C]24[/C][C]-0.157995[/C][C]-1.2136[/C][C]0.114871[/C][/ROW]
[ROW][C]25[/C][C]-0.051157[/C][C]-0.3929[/C][C]0.347888[/C][/ROW]
[ROW][C]26[/C][C]-0.084101[/C][C]-0.646[/C][C]0.260395[/C][/ROW]
[ROW][C]27[/C][C]-0.083672[/C][C]-0.6427[/C][C]0.261456[/C][/ROW]
[ROW][C]28[/C][C]-0.064212[/C][C]-0.4932[/C][C]0.311842[/C][/ROW]
[ROW][C]29[/C][C]-0.036547[/C][C]-0.2807[/C][C]0.389953[/C][/ROW]
[ROW][C]30[/C][C]0.025409[/C][C]0.1952[/C][C]0.422964[/C][/ROW]
[ROW][C]31[/C][C]0.062914[/C][C]0.4833[/C][C]0.315353[/C][/ROW]
[ROW][C]32[/C][C]0.034978[/C][C]0.2687[/C][C]0.394561[/C][/ROW]
[ROW][C]33[/C][C]-0.103495[/C][C]-0.795[/C][C]0.214911[/C][/ROW]
[ROW][C]34[/C][C]0.033577[/C][C]0.2579[/C][C]0.398686[/C][/ROW]
[ROW][C]35[/C][C]-0.035294[/C][C]-0.2711[/C][C]0.393629[/C][/ROW]
[ROW][C]36[/C][C]-0.003486[/C][C]-0.0268[/C][C]0.489363[/C][/ROW]
[ROW][C]37[/C][C]-0.045459[/C][C]-0.3492[/C][C]0.364099[/C][/ROW]
[ROW][C]38[/C][C]-0.062339[/C][C]-0.4788[/C][C]0.316912[/C][/ROW]
[ROW][C]39[/C][C]0.00148[/C][C]0.0114[/C][C]0.495483[/C][/ROW]
[ROW][C]40[/C][C]-0.05589[/C][C]-0.4293[/C][C]0.334633[/C][/ROW]
[ROW][C]41[/C][C]-0.048964[/C][C]-0.3761[/C][C]0.354097[/C][/ROW]
[ROW][C]42[/C][C]-0.017373[/C][C]-0.1334[/C][C]0.447148[/C][/ROW]
[ROW][C]43[/C][C]0.152059[/C][C]1.168[/C][C]0.123755[/C][/ROW]
[ROW][C]44[/C][C]0.081847[/C][C]0.6287[/C][C]0.265993[/C][/ROW]
[ROW][C]45[/C][C]-0.050293[/C][C]-0.3863[/C][C]0.350331[/C][/ROW]
[ROW][C]46[/C][C]0.055413[/C][C]0.4256[/C][C]0.335961[/C][/ROW]
[ROW][C]47[/C][C]0.088985[/C][C]0.6835[/C][C]0.248481[/C][/ROW]
[ROW][C]48[/C][C]-0.006969[/C][C]-0.0535[/C][C]0.478744[/C][/ROW]
[/TABLE]
Source: https://freestatistics.org/blog/index.php?pk=304055&T=2

Globally Unique Identifier (entire table): ba.freestatistics.org/blog/index.php?pk=304055&T=2

As an alternative you can also use a QR Code:  

The GUIDs for individual cells are displayed in the table below:

Partial Autocorrelation Function
Time lag kPACF(k)T-STATP-value
1-0.274454-2.10810.019639
2-0.476363-3.6590.000271
3-0.197594-1.51770.06721
4-0.203612-1.5640.061586
5-0.18887-1.45070.076075
6-0.134915-1.03630.152144
7-0.097413-0.74820.228643
8-0.187628-1.44120.077408
9-0.362758-2.78640.003579
100.1001880.76960.222317
110.4265923.27670.000881
12-0.213395-1.63910.053255
130.0921860.70810.240838
14-0.049171-0.37770.353509
15-0.07942-0.610.272091
160.0046380.03560.48585
17-0.027445-0.21080.416882
180.0892420.68550.247862
190.0222750.17110.432368
20-0.057448-0.44130.330316
21-0.056408-0.43330.333197
220.0785040.6030.274409
230.1043790.80170.212958
24-0.157995-1.21360.114871
25-0.051157-0.39290.347888
26-0.084101-0.6460.260395
27-0.083672-0.64270.261456
28-0.064212-0.49320.311842
29-0.036547-0.28070.389953
300.0254090.19520.422964
310.0629140.48330.315353
320.0349780.26870.394561
33-0.103495-0.7950.214911
340.0335770.25790.398686
35-0.035294-0.27110.393629
36-0.003486-0.02680.489363
37-0.045459-0.34920.364099
38-0.062339-0.47880.316912
390.001480.01140.495483
40-0.05589-0.42930.334633
41-0.048964-0.37610.354097
42-0.017373-0.13340.447148
430.1520591.1680.123755
440.0818470.62870.265993
45-0.050293-0.38630.350331
460.0554130.42560.335961
470.0889850.68350.248481
48-0.006969-0.05350.478744


Parameters (Session):
par1 = 1 ; par2 = 2 ; par3 = 3 ; par4 = TRUE ;
Parameters (R input):
par1 = 48 ; par2 = 1 ; par3 = 1 ; par4 = 1 ; par5 = 12 ; par6 = White Noise ; par7 = 0.95 ; par8 = ;
R code (references can be found in the software module):
par8 <- ''
par7 <- '0.95'
par6 <- 'White Noise'
par5 <- '12'
par4 <- '1'
par3 <- '0'
par2 <- '1'
par1 <- '48'
if (par1 == 'Default') {
par1 = 10*log10(length(x))
} else {
par1 <- as.numeric(par1)
}
par2 <- as.numeric(par2)
par3 <- as.numeric(par3)
par4 <- as.numeric(par4)
par5 <- as.numeric(par5)
if (par6 == 'White Noise') par6 <- 'white' else par6 <- 'ma'
par7 <- as.numeric(par7)
if (par8 != '') par8 <- as.numeric(par8)
x <- na.omit(x)
ox <- x
if (par8 == '') {
if (par2 == 0) {
x <- log(x)
} else {
x <- (x ^ par2 - 1) / par2
}
} else {
x <- log(x,base=par8)
}
if (par3 > 0) x <- diff(x,lag=1,difference=par3)
if (par4 > 0) x <- diff(x,lag=par5,difference=par4)
bitmap(file='picts.png')
op <- par(mfrow=c(2,1))
plot(ox,type='l',main='Original Time Series',xlab='time',ylab='value')
if (par8=='') {
mytitle <- paste('Working Time Series (lambda=',par2,', d=',par3,', D=',par4,')',sep='')
mysub <- paste('(lambda=',par2,', d=',par3,', D=',par4,', CI=', par7, ', CI type=',par6,')',sep='')
} else {
mytitle <- paste('Working Time Series (base=',par8,', d=',par3,', D=',par4,')',sep='')
mysub <- paste('(base=',par8,', d=',par3,', D=',par4,', CI=', par7, ', CI type=',par6,')',sep='')
}
plot(x,type='l', main=mytitle,xlab='time',ylab='value')
par(op)
dev.off()
bitmap(file='pic1.png')
racf <- acf(x, par1, main='Autocorrelation', xlab='time lag', ylab='ACF', ci.type=par6, ci=par7, sub=mysub)
dev.off()
bitmap(file='pic2.png')
rpacf <- pacf(x,par1,main='Partial Autocorrelation',xlab='lags',ylab='PACF',sub=mysub)
dev.off()
(myacf <- c(racf$acf))
(mypacf <- c(rpacf$acf))
lengthx <- length(x)
sqrtn <- sqrt(lengthx)
load(file='createtable')
a<-table.start()
a<-table.row.start(a)
a<-table.element(a,'Autocorrelation Function',4,TRUE)
a<-table.row.end(a)
a<-table.row.start(a)
a<-table.element(a,'Time lag k',header=TRUE)
a<-table.element(a,'ACF(k)',header=TRUE)
a<-table.element(a,'T-STAT',header=TRUE)
a<-table.element(a,'P-value',header=TRUE)
a<-table.row.end(a)
for (i in 2:(par1+1)) {
a<-table.row.start(a)
a<-table.element(a,i-1,header=TRUE)
a<-table.element(a,round(myacf[i],6))
mytstat <- myacf[i]*sqrtn
a<-table.element(a,round(mytstat,4))
a<-table.element(a,round(1-pt(abs(mytstat),lengthx),6))
a<-table.row.end(a)
}
a<-table.end(a)
table.save(a,file='mytable.tab')
a<-table.start()
a<-table.row.start(a)
a<-table.element(a,'Partial Autocorrelation Function',4,TRUE)
a<-table.row.end(a)
a<-table.row.start(a)
a<-table.element(a,'Time lag k',header=TRUE)
a<-table.element(a,'PACF(k)',header=TRUE)
a<-table.element(a,'T-STAT',header=TRUE)
a<-table.element(a,'P-value',header=TRUE)
a<-table.row.end(a)
for (i in 1:par1) {
a<-table.row.start(a)
a<-table.element(a,i,header=TRUE)
a<-table.element(a,round(mypacf[i],6))
mytstat <- mypacf[i]*sqrtn
a<-table.element(a,round(mytstat,4))
a<-table.element(a,round(1-pt(abs(mytstat),lengthx),6))
a<-table.row.end(a)
}
a<-table.end(a)
table.save(a,file='mytable1.tab')