Free Statistics

of Irreproducible Research!

Author's title

Author*The author of this computation has been verified*
R Software Modulerwasp_smp.wasp
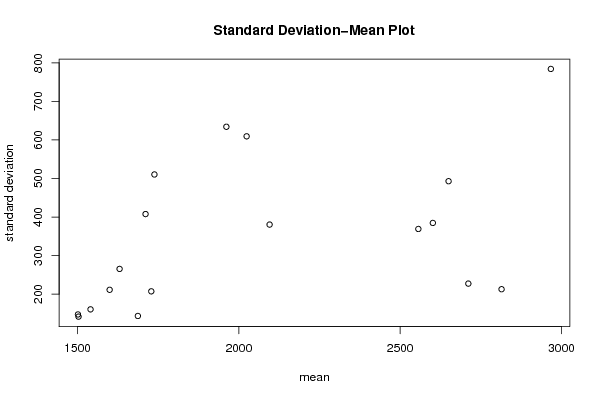
Title produced by softwareStandard Deviation-Mean Plot
Date of computationMon, 23 Jan 2017 09:40:59 +0100
Cite this page as followsStatistical Computations at FreeStatistics.org, Office for Research Development and Education, URL https://freestatistics.org/blog/index.php?v=date/2017/Jan/23/t1485160872d1wbo2sh7wqp4pw.htm/, Retrieved Wed, 15 May 2024 22:16:44 +0000
Statistical Computations at FreeStatistics.org, Office for Research Development and Education, URL https://freestatistics.org/blog/index.php?pk=304003, Retrieved Wed, 15 May 2024 22:16:44 +0000
QR Codes:

Original text written by user:
IsPrivate?No (this computation is public)
User-defined keywords
Estimated Impact63
Family? (F = Feedback message, R = changed R code, M = changed R Module, P = changed Parameters, D = changed Data)
-       [Standard Deviation-Mean Plot] [Q7(1)] [2017-01-23 08:40:59] [636d0f72197ac5e1dae4a755427db02a] [Current]
Feedback Forum

Post a new message
Dataseries X:
3035
2552
2704
2554
2014
1655
1721
1524
1596
2074
2199
2512
2933
2889
2938
2497
1870
1726
1607
1545
1396
1787
2076
2837
2787
3891
3179
2011
1636
1580
1489
1300
1356
1653
2013
2823
3102
2294
2385
2444
1748
1554
1498
1361
1346
1564
1640
2293
2815
3137
2679
1969
1870
1633
1529
1366
1357
1570
1535
2491
3084
2605
2573
2143
1693
1504
1461
1354
1333
1492
1781
1915


Summary of computational transaction
Raw Input view raw input (R code)
Raw Outputview raw output of R engine
Computing time1 seconds
R ServerBig Analytics Cloud Computing Center

\begin{tabular}{lllllllll}
\hline
Summary of computational transaction \tabularnewline
Raw Input view raw input (R code)  \tabularnewline
Raw Outputview raw output of R engine  \tabularnewline
Computing time1 seconds \tabularnewline
R ServerBig Analytics Cloud Computing Center \tabularnewline
\hline
\end{tabular}
%Source: https://freestatistics.org/blog/index.php?pk=304003&T=0

[TABLE]
[ROW]
Summary of computational transaction[/C][/ROW] [ROW]Raw Input[/C] view raw input (R code) [/C][/ROW] [ROW]Raw Output[/C]view raw output of R engine [/C][/ROW] [ROW]Computing time[/C]1 seconds[/C][/ROW] [ROW]R Server[/C]Big Analytics Cloud Computing Center[/C][/ROW] [/TABLE] Source: https://freestatistics.org/blog/index.php?pk=304003&T=0

Globally Unique Identifier (entire table): ba.freestatistics.org/blog/index.php?pk=304003&T=0

As an alternative you can also use a QR Code:  

The GUIDs for individual cells are displayed in the table below:

Summary of computational transaction
Raw Input view raw input (R code)
Raw Outputview raw output of R engine
Computing time1 seconds
R ServerBig Analytics Cloud Computing Center


Standard Deviation-Mean Plot
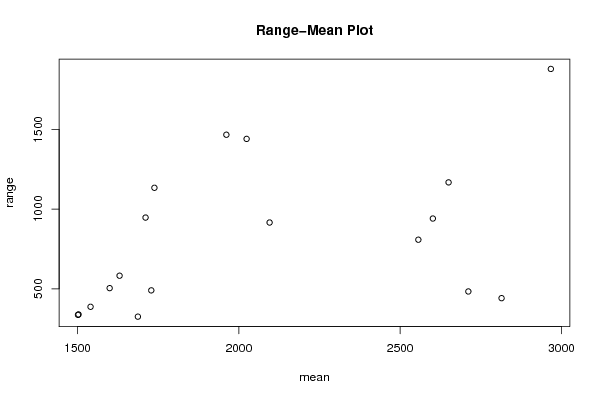
SectionMeanStandard DeviationRange
12711.25227.269846951445483
21728.5207.19475540338490
32095.25380.415014600283916
42814.25212.642697186305441
51687143.264324472866325
62024609.4330698827121441
72967784.2312584095761880
81501.25147.208185913692336
91961.25634.2020577071631467
102556.25369.027889641601808
111540.25160.483384394356387
121710.75407.675831186168947
132650492.9489493514181168
141599.5211.175282644537504
151738.25510.4255577456911134
162601.25384.64388291856941
171503141.499116605016339
181630.25265.379445323107582

\begin{tabular}{lllllllll}
\hline
Standard Deviation-Mean Plot \tabularnewline
Section & Mean & Standard Deviation & Range \tabularnewline
1 & 2711.25 & 227.269846951445 & 483 \tabularnewline
2 & 1728.5 & 207.19475540338 & 490 \tabularnewline
3 & 2095.25 & 380.415014600283 & 916 \tabularnewline
4 & 2814.25 & 212.642697186305 & 441 \tabularnewline
5 & 1687 & 143.264324472866 & 325 \tabularnewline
6 & 2024 & 609.433069882712 & 1441 \tabularnewline
7 & 2967 & 784.231258409576 & 1880 \tabularnewline
8 & 1501.25 & 147.208185913692 & 336 \tabularnewline
9 & 1961.25 & 634.202057707163 & 1467 \tabularnewline
10 & 2556.25 & 369.027889641601 & 808 \tabularnewline
11 & 1540.25 & 160.483384394356 & 387 \tabularnewline
12 & 1710.75 & 407.675831186168 & 947 \tabularnewline
13 & 2650 & 492.948949351418 & 1168 \tabularnewline
14 & 1599.5 & 211.175282644537 & 504 \tabularnewline
15 & 1738.25 & 510.425557745691 & 1134 \tabularnewline
16 & 2601.25 & 384.64388291856 & 941 \tabularnewline
17 & 1503 & 141.499116605016 & 339 \tabularnewline
18 & 1630.25 & 265.379445323107 & 582 \tabularnewline
\hline
\end{tabular}
%Source: https://freestatistics.org/blog/index.php?pk=304003&T=1

[TABLE]
[ROW][C]Standard Deviation-Mean Plot[/C][/ROW]
[ROW][C]Section[/C][C]Mean[/C][C]Standard Deviation[/C][C]Range[/C][/ROW]
[ROW][C]1[/C][C]2711.25[/C][C]227.269846951445[/C][C]483[/C][/ROW]
[ROW][C]2[/C][C]1728.5[/C][C]207.19475540338[/C][C]490[/C][/ROW]
[ROW][C]3[/C][C]2095.25[/C][C]380.415014600283[/C][C]916[/C][/ROW]
[ROW][C]4[/C][C]2814.25[/C][C]212.642697186305[/C][C]441[/C][/ROW]
[ROW][C]5[/C][C]1687[/C][C]143.264324472866[/C][C]325[/C][/ROW]
[ROW][C]6[/C][C]2024[/C][C]609.433069882712[/C][C]1441[/C][/ROW]
[ROW][C]7[/C][C]2967[/C][C]784.231258409576[/C][C]1880[/C][/ROW]
[ROW][C]8[/C][C]1501.25[/C][C]147.208185913692[/C][C]336[/C][/ROW]
[ROW][C]9[/C][C]1961.25[/C][C]634.202057707163[/C][C]1467[/C][/ROW]
[ROW][C]10[/C][C]2556.25[/C][C]369.027889641601[/C][C]808[/C][/ROW]
[ROW][C]11[/C][C]1540.25[/C][C]160.483384394356[/C][C]387[/C][/ROW]
[ROW][C]12[/C][C]1710.75[/C][C]407.675831186168[/C][C]947[/C][/ROW]
[ROW][C]13[/C][C]2650[/C][C]492.948949351418[/C][C]1168[/C][/ROW]
[ROW][C]14[/C][C]1599.5[/C][C]211.175282644537[/C][C]504[/C][/ROW]
[ROW][C]15[/C][C]1738.25[/C][C]510.425557745691[/C][C]1134[/C][/ROW]
[ROW][C]16[/C][C]2601.25[/C][C]384.64388291856[/C][C]941[/C][/ROW]
[ROW][C]17[/C][C]1503[/C][C]141.499116605016[/C][C]339[/C][/ROW]
[ROW][C]18[/C][C]1630.25[/C][C]265.379445323107[/C][C]582[/C][/ROW]
[/TABLE]
Source: https://freestatistics.org/blog/index.php?pk=304003&T=1

Globally Unique Identifier (entire table): ba.freestatistics.org/blog/index.php?pk=304003&T=1

As an alternative you can also use a QR Code:  

The GUIDs for individual cells are displayed in the table below:

Standard Deviation-Mean Plot
SectionMeanStandard DeviationRange
12711.25227.269846951445483
21728.5207.19475540338490
32095.25380.415014600283916
42814.25212.642697186305441
51687143.264324472866325
62024609.4330698827121441
72967784.2312584095761880
81501.25147.208185913692336
91961.25634.2020577071631467
102556.25369.027889641601808
111540.25160.483384394356387
121710.75407.675831186168947
132650492.9489493514181168
141599.5211.175282644537504
151738.25510.4255577456911134
162601.25384.64388291856941
171503141.499116605016339
181630.25265.379445323107582


Regression: S.E.(k) = alpha + beta * Mean(k)
alpha-2.98474131386135
beta0.171339124752322
S.D.0.0836236789014168
T-STAT2.04893072157602
p-value0.0572386948649597

\begin{tabular}{lllllllll}
\hline
Regression: S.E.(k) = alpha + beta * Mean(k) \tabularnewline
alpha & -2.98474131386135 \tabularnewline
beta & 0.171339124752322 \tabularnewline
S.D. & 0.0836236789014168 \tabularnewline
T-STAT & 2.04893072157602 \tabularnewline
p-value & 0.0572386948649597 \tabularnewline
\hline
\end{tabular}
%Source: https://freestatistics.org/blog/index.php?pk=304003&T=2

[TABLE]
[ROW][C]Regression: S.E.(k) = alpha + beta * Mean(k)[/C][/ROW]
[ROW][C]alpha[/C][C]-2.98474131386135[/C][/ROW]
[ROW][C]beta[/C][C]0.171339124752322[/C][/ROW]
[ROW][C]S.D.[/C][C]0.0836236789014168[/C][/ROW]
[ROW][C]T-STAT[/C][C]2.04893072157602[/C][/ROW]
[ROW][C]p-value[/C][C]0.0572386948649597[/C][/ROW]
[/TABLE]
Source: https://freestatistics.org/blog/index.php?pk=304003&T=2

Globally Unique Identifier (entire table): ba.freestatistics.org/blog/index.php?pk=304003&T=2

As an alternative you can also use a QR Code:  

The GUIDs for individual cells are displayed in the table below:

Regression: S.E.(k) = alpha + beta * Mean(k)
alpha-2.98474131386135
beta0.171339124752322
S.D.0.0836236789014168
T-STAT2.04893072157602
p-value0.0572386948649597


Regression: ln S.E.(k) = alpha + beta * ln Mean(k)
alpha-3.31640833291584
beta1.18788708430902
S.D.0.491735577212762
T-STAT2.41570294962621
p-value0.028028705377259
Lambda-0.187887084309019

\begin{tabular}{lllllllll}
\hline
Regression: ln S.E.(k) = alpha + beta * ln Mean(k) \tabularnewline
alpha & -3.31640833291584 \tabularnewline
beta & 1.18788708430902 \tabularnewline
S.D. & 0.491735577212762 \tabularnewline
T-STAT & 2.41570294962621 \tabularnewline
p-value & 0.028028705377259 \tabularnewline
Lambda & -0.187887084309019 \tabularnewline
\hline
\end{tabular}
%Source: https://freestatistics.org/blog/index.php?pk=304003&T=3

[TABLE]
[ROW][C]Regression: ln S.E.(k) = alpha + beta * ln Mean(k)[/C][/ROW]
[ROW][C]alpha[/C][C]-3.31640833291584[/C][/ROW]
[ROW][C]beta[/C][C]1.18788708430902[/C][/ROW]
[ROW][C]S.D.[/C][C]0.491735577212762[/C][/ROW]
[ROW][C]T-STAT[/C][C]2.41570294962621[/C][/ROW]
[ROW][C]p-value[/C][C]0.028028705377259[/C][/ROW]
[ROW][C]Lambda[/C][C]-0.187887084309019[/C][/ROW]
[/TABLE]
Source: https://freestatistics.org/blog/index.php?pk=304003&T=3

Globally Unique Identifier (entire table): ba.freestatistics.org/blog/index.php?pk=304003&T=3

As an alternative you can also use a QR Code:  

The GUIDs for individual cells are displayed in the table below:

Regression: ln S.E.(k) = alpha + beta * ln Mean(k)
alpha-3.31640833291584
beta1.18788708430902
S.D.0.491735577212762
T-STAT2.41570294962621
p-value0.028028705377259
Lambda-0.187887084309019


Parameters (Session):
par1 = 4 ;
Parameters (R input):
par1 = 4 ;
R code (references can be found in the software module):
par1 <- as.numeric(par1)
(n <- length(x))
(np <- floor(n / par1))
arr <- array(NA,dim=c(par1,np))
j <- 0
k <- 1
for (i in 1:(np*par1))
{
j = j + 1
arr[j,k] <- x[i]
if (j == par1) {
j = 0
k=k+1
}
}
arr
arr.mean <- array(NA,dim=np)
arr.sd <- array(NA,dim=np)
arr.range <- array(NA,dim=np)
for (j in 1:np)
{
arr.mean[j] <- mean(arr[,j],na.rm=TRUE)
arr.sd[j] <- sd(arr[,j],na.rm=TRUE)
arr.range[j] <- max(arr[,j],na.rm=TRUE) - min(arr[,j],na.rm=TRUE)
}
arr.mean
arr.sd
arr.range
(lm1 <- lm(arr.sd~arr.mean))
(lnlm1 <- lm(log(arr.sd)~log(arr.mean)))
(lm2 <- lm(arr.range~arr.mean))
bitmap(file='test1.png')
plot(arr.mean,arr.sd,main='Standard Deviation-Mean Plot',xlab='mean',ylab='standard deviation')
dev.off()
bitmap(file='test2.png')
plot(arr.mean,arr.range,main='Range-Mean Plot',xlab='mean',ylab='range')
dev.off()
load(file='createtable')
a<-table.start()
a<-table.row.start(a)
a<-table.element(a,'Standard Deviation-Mean Plot',4,TRUE)
a<-table.row.end(a)
a<-table.row.start(a)
a<-table.element(a,'Section',header=TRUE)
a<-table.element(a,'Mean',header=TRUE)
a<-table.element(a,'Standard Deviation',header=TRUE)
a<-table.element(a,'Range',header=TRUE)
a<-table.row.end(a)
for (j in 1:np) {
a<-table.row.start(a)
a<-table.element(a,j,header=TRUE)
a<-table.element(a,arr.mean[j])
a<-table.element(a,arr.sd[j] )
a<-table.element(a,arr.range[j] )
a<-table.row.end(a)
}
a<-table.end(a)
table.save(a,file='mytable.tab')
a<-table.start()
a<-table.row.start(a)
a<-table.element(a,'Regression: S.E.(k) = alpha + beta * Mean(k)',2,TRUE)
a<-table.row.end(a)
a<-table.row.start(a)
a<-table.element(a,'alpha',header=TRUE)
a<-table.element(a,lm1$coefficients[[1]])
a<-table.row.end(a)
a<-table.row.start(a)
a<-table.element(a,'beta',header=TRUE)
a<-table.element(a,lm1$coefficients[[2]])
a<-table.row.end(a)
a<-table.row.start(a)
a<-table.element(a,'S.D.',header=TRUE)
a<-table.element(a,summary(lm1)$coefficients[2,2])
a<-table.row.end(a)
a<-table.row.start(a)
a<-table.element(a,'T-STAT',header=TRUE)
a<-table.element(a,summary(lm1)$coefficients[2,3])
a<-table.row.end(a)
a<-table.row.start(a)
a<-table.element(a,'p-value',header=TRUE)
a<-table.element(a,summary(lm1)$coefficients[2,4])
a<-table.row.end(a)
a<-table.end(a)
table.save(a,file='mytable1.tab')
a<-table.start()
a<-table.row.start(a)
a<-table.element(a,'Regression: ln S.E.(k) = alpha + beta * ln Mean(k)',2,TRUE)
a<-table.row.end(a)
a<-table.row.start(a)
a<-table.element(a,'alpha',header=TRUE)
a<-table.element(a,lnlm1$coefficients[[1]])
a<-table.row.end(a)
a<-table.row.start(a)
a<-table.element(a,'beta',header=TRUE)
a<-table.element(a,lnlm1$coefficients[[2]])
a<-table.row.end(a)
a<-table.row.start(a)
a<-table.element(a,'S.D.',header=TRUE)
a<-table.element(a,summary(lnlm1)$coefficients[2,2])
a<-table.row.end(a)
a<-table.row.start(a)
a<-table.element(a,'T-STAT',header=TRUE)
a<-table.element(a,summary(lnlm1)$coefficients[2,3])
a<-table.row.end(a)
a<-table.row.start(a)
a<-table.element(a,'p-value',header=TRUE)
a<-table.element(a,summary(lnlm1)$coefficients[2,4])
a<-table.row.end(a)
a<-table.row.start(a)
a<-table.element(a,'Lambda',header=TRUE)
a<-table.element(a,1-lnlm1$coefficients[[2]])
a<-table.row.end(a)
a<-table.end(a)
table.save(a,file='mytable2.tab')