Free Statistics

of Irreproducible Research!

Author's title

Author*The author of this computation has been verified*
R Software Modulerwasp_arimaforecasting.wasp
Title produced by softwareARIMA Forecasting
Date of computationSun, 22 Jan 2017 21:57:38 +0100
Cite this page as followsStatistical Computations at FreeStatistics.org, Office for Research Development and Education, URL https://freestatistics.org/blog/index.php?v=date/2017/Jan/22/t1485118670q3f3n669l4329ly.htm/, Retrieved Tue, 14 May 2024 02:52:55 +0000
Statistical Computations at FreeStatistics.org, Office for Research Development and Education, URL https://freestatistics.org/blog/index.php?pk=303542, Retrieved Tue, 14 May 2024 02:52:55 +0000
QR Codes:

Original text written by user:
IsPrivate?No (this computation is public)
User-defined keywords
Estimated Impact117
Family? (F = Feedback message, R = changed R code, M = changed R Module, P = changed Parameters, D = changed Data)
-     [Skewness and Kurtosis Test] [] [2015-11-04 16:50:26] [32b17a345b130fdf5cc88718ed94a974]
- RMPD    [ARIMA Forecasting] [blog] [2017-01-22 20:57:38] [111362aa4cdbe055231fbc5cb9e916c4] [Current]
Feedback Forum

Post a new message
Dataseries X:
2300
3100
3900
4100
3800
4000
3800
4200
4200
4700
3500
3100
5200
5900
6600
7600
6900
7700
8000
8300
8000
9000
6500
6200
6600
7500
8300
9900
9300
7400
7000
8400
7700
7900
6100
4600
5700
5700
7600
9100
8200
6800
6900
8100
7200
8200
6600
5300
5900
5600
6300
7600
7000
6000
6400
6800
6400
7600
5200
4400
5700
4700
5900
7900
6400
6600
7200
7300
7400
8100
6200
4200
4900
5100
7200
8000
7700
7400
6900
7900
7900
8000
6500
5300
6100
5100
6200
6700
6200
5900
5900
7300
6000
7300
5200
3900
5200
5100
5900
6600
6800
6000
6000
7400
6000
6700
3900
4500
4600
5500
6400
6600
5700
6100
6500
6000
6200
4800
4000
5400
5300
6800
6900
6600
7000
7200


Summary of computational transaction
Raw Input view raw input (R code)
Raw Outputview raw output of R engine
Computing time1 seconds
R ServerBig Analytics Cloud Computing Center

\begin{tabular}{lllllllll}
\hline
Summary of computational transaction \tabularnewline
Raw Input view raw input (R code)  \tabularnewline
Raw Outputview raw output of R engine  \tabularnewline
Computing time1 seconds \tabularnewline
R ServerBig Analytics Cloud Computing Center \tabularnewline
\hline
\end{tabular}
%Source: https://freestatistics.org/blog/index.php?pk=303542&T=0

[TABLE]
[ROW]
Summary of computational transaction[/C][/ROW] [ROW]Raw Input[/C] view raw input (R code) [/C][/ROW] [ROW]Raw Output[/C]view raw output of R engine [/C][/ROW] [ROW]Computing time[/C]1 seconds[/C][/ROW] [ROW]R Server[/C]Big Analytics Cloud Computing Center[/C][/ROW] [/TABLE] Source: https://freestatistics.org/blog/index.php?pk=303542&T=0

Globally Unique Identifier (entire table): ba.freestatistics.org/blog/index.php?pk=303542&T=0

As an alternative you can also use a QR Code:  

The GUIDs for individual cells are displayed in the table below:

Summary of computational transaction
Raw Input view raw input (R code)
Raw Outputview raw output of R engine
Computing time1 seconds
R ServerBig Analytics Cloud Computing Center


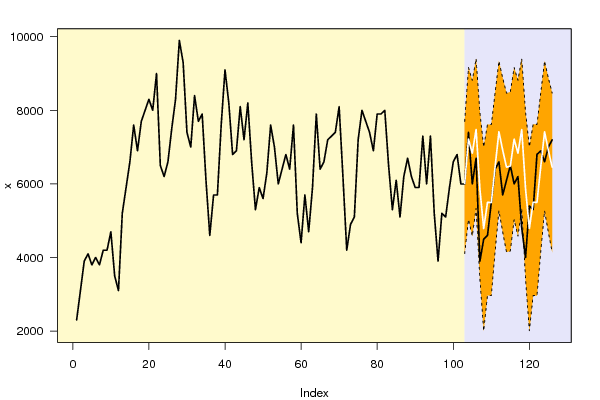
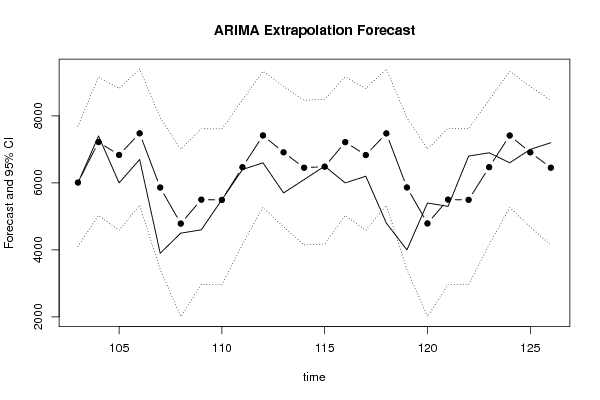
Univariate ARIMA Extrapolation Forecast
timeY[t]F[t]95% LB95% UBp-value(H0: Y[t] = F[t])P(F[t]>Y[t-1])P(F[t]>Y[t-s])P(F[t]>Y[102])
905900-------
915900-------
927300-------
936000-------
947300-------
955200-------
963900-------
975200-------
985100-------
995900-------
1006600-------
1016800-------
1026000-------
10360006011.12364105.15367697.55320.49480.50520.55140.5052
10474007218.7725033.48729162.96480.42750.89040.46740.8904
10560006833.64794585.28088813.97850.20470.28760.79530.7953
10667007480.37355334.29699401.24270.21290.93450.5730.9345
10739005862.38893416.31317944.91990.03240.21530.73350.4485
10845004786.17522007.87017002.53370.40010.78340.78340.1415
10946005499.88842971.6767616.99280.20240.82270.60940.3217
11055005492.36242962.0457610.38660.49720.79550.64170.3193
11164006469.23984164.80448477.920.47310.82790.71070.6765
11266007416.98355271.349335.71370.2020.85060.7980.9261
11357006912.96814688.32198877.81050.11310.62260.54490.8188
11461006453.66414146.22088463.94320.36510.76880.67090.6709
11565006486.25774175.77028500.21440.49470.64650.6820.682
11660007216.94765027.9939163.97070.11030.76480.42690.8897
11762006832.71164580.66738815.83870.26590.79470.79470.7947
11848007477.95545328.21959401.6730.00320.90360.7860.9339
11940005863.78373414.09077948.97540.03990.84130.96750.4491
12054004790.36412008.87997009.11590.29510.75750.60120.1426
12153005502.19492970.37097621.93750.42580.53760.79790.3227
12268005494.6882960.76127615.34880.11380.57140.4980.3202
12369006469.16154160.99218480.64750.33730.37360.52690.6762
12466007414.70865265.34719336.33110.2030.70020.7970.9255
12570006911.84744683.46588879.54340.4650.6220.88630.8181
12672006453.62284142.44618466.70580.23370.29740.63470.6706

\begin{tabular}{lllllllll}
\hline
Univariate ARIMA Extrapolation Forecast \tabularnewline
time & Y[t] & F[t] & 95% LB & 95% UB & p-value(H0: Y[t] = F[t]) & P(F[t]>Y[t-1]) & P(F[t]>Y[t-s]) & P(F[t]>Y[102]) \tabularnewline
90 & 5900 & - & - & - & - & - & - & - \tabularnewline
91 & 5900 & - & - & - & - & - & - & - \tabularnewline
92 & 7300 & - & - & - & - & - & - & - \tabularnewline
93 & 6000 & - & - & - & - & - & - & - \tabularnewline
94 & 7300 & - & - & - & - & - & - & - \tabularnewline
95 & 5200 & - & - & - & - & - & - & - \tabularnewline
96 & 3900 & - & - & - & - & - & - & - \tabularnewline
97 & 5200 & - & - & - & - & - & - & - \tabularnewline
98 & 5100 & - & - & - & - & - & - & - \tabularnewline
99 & 5900 & - & - & - & - & - & - & - \tabularnewline
100 & 6600 & - & - & - & - & - & - & - \tabularnewline
101 & 6800 & - & - & - & - & - & - & - \tabularnewline
102 & 6000 & - & - & - & - & - & - & - \tabularnewline
103 & 6000 & 6011.1236 & 4105.1536 & 7697.5532 & 0.4948 & 0.5052 & 0.5514 & 0.5052 \tabularnewline
104 & 7400 & 7218.772 & 5033.4872 & 9162.9648 & 0.4275 & 0.8904 & 0.4674 & 0.8904 \tabularnewline
105 & 6000 & 6833.6479 & 4585.2808 & 8813.9785 & 0.2047 & 0.2876 & 0.7953 & 0.7953 \tabularnewline
106 & 6700 & 7480.3735 & 5334.2969 & 9401.2427 & 0.2129 & 0.9345 & 0.573 & 0.9345 \tabularnewline
107 & 3900 & 5862.3889 & 3416.3131 & 7944.9199 & 0.0324 & 0.2153 & 0.7335 & 0.4485 \tabularnewline
108 & 4500 & 4786.1752 & 2007.8701 & 7002.5337 & 0.4001 & 0.7834 & 0.7834 & 0.1415 \tabularnewline
109 & 4600 & 5499.8884 & 2971.676 & 7616.9928 & 0.2024 & 0.8227 & 0.6094 & 0.3217 \tabularnewline
110 & 5500 & 5492.3624 & 2962.045 & 7610.3866 & 0.4972 & 0.7955 & 0.6417 & 0.3193 \tabularnewline
111 & 6400 & 6469.2398 & 4164.8044 & 8477.92 & 0.4731 & 0.8279 & 0.7107 & 0.6765 \tabularnewline
112 & 6600 & 7416.9835 & 5271.34 & 9335.7137 & 0.202 & 0.8506 & 0.798 & 0.9261 \tabularnewline
113 & 5700 & 6912.9681 & 4688.3219 & 8877.8105 & 0.1131 & 0.6226 & 0.5449 & 0.8188 \tabularnewline
114 & 6100 & 6453.6641 & 4146.2208 & 8463.9432 & 0.3651 & 0.7688 & 0.6709 & 0.6709 \tabularnewline
115 & 6500 & 6486.2577 & 4175.7702 & 8500.2144 & 0.4947 & 0.6465 & 0.682 & 0.682 \tabularnewline
116 & 6000 & 7216.9476 & 5027.993 & 9163.9707 & 0.1103 & 0.7648 & 0.4269 & 0.8897 \tabularnewline
117 & 6200 & 6832.7116 & 4580.6673 & 8815.8387 & 0.2659 & 0.7947 & 0.7947 & 0.7947 \tabularnewline
118 & 4800 & 7477.9554 & 5328.2195 & 9401.673 & 0.0032 & 0.9036 & 0.786 & 0.9339 \tabularnewline
119 & 4000 & 5863.7837 & 3414.0907 & 7948.9754 & 0.0399 & 0.8413 & 0.9675 & 0.4491 \tabularnewline
120 & 5400 & 4790.3641 & 2008.8799 & 7009.1159 & 0.2951 & 0.7575 & 0.6012 & 0.1426 \tabularnewline
121 & 5300 & 5502.1949 & 2970.3709 & 7621.9375 & 0.4258 & 0.5376 & 0.7979 & 0.3227 \tabularnewline
122 & 6800 & 5494.688 & 2960.7612 & 7615.3488 & 0.1138 & 0.5714 & 0.498 & 0.3202 \tabularnewline
123 & 6900 & 6469.1615 & 4160.9921 & 8480.6475 & 0.3373 & 0.3736 & 0.5269 & 0.6762 \tabularnewline
124 & 6600 & 7414.7086 & 5265.3471 & 9336.3311 & 0.203 & 0.7002 & 0.797 & 0.9255 \tabularnewline
125 & 7000 & 6911.8474 & 4683.4658 & 8879.5434 & 0.465 & 0.622 & 0.8863 & 0.8181 \tabularnewline
126 & 7200 & 6453.6228 & 4142.4461 & 8466.7058 & 0.2337 & 0.2974 & 0.6347 & 0.6706 \tabularnewline
\hline
\end{tabular}
%Source: https://freestatistics.org/blog/index.php?pk=303542&T=1

[TABLE]
[ROW][C]Univariate ARIMA Extrapolation Forecast[/C][/ROW]
[ROW][C]time[/C][C]Y[t][/C][C]F[t][/C][C]95% LB[/C][C]95% UB[/C][C]p-value(H0: Y[t] = F[t])[/C][C]P(F[t]>Y[t-1])[/C][C]P(F[t]>Y[t-s])[/C][C]P(F[t]>Y[102])[/C][/ROW]
[ROW][C]90[/C][C]5900[/C][C]-[/C][C]-[/C][C]-[/C][C]-[/C][C]-[/C][C]-[/C][C]-[/C][/ROW]
[ROW][C]91[/C][C]5900[/C][C]-[/C][C]-[/C][C]-[/C][C]-[/C][C]-[/C][C]-[/C][C]-[/C][/ROW]
[ROW][C]92[/C][C]7300[/C][C]-[/C][C]-[/C][C]-[/C][C]-[/C][C]-[/C][C]-[/C][C]-[/C][/ROW]
[ROW][C]93[/C][C]6000[/C][C]-[/C][C]-[/C][C]-[/C][C]-[/C][C]-[/C][C]-[/C][C]-[/C][/ROW]
[ROW][C]94[/C][C]7300[/C][C]-[/C][C]-[/C][C]-[/C][C]-[/C][C]-[/C][C]-[/C][C]-[/C][/ROW]
[ROW][C]95[/C][C]5200[/C][C]-[/C][C]-[/C][C]-[/C][C]-[/C][C]-[/C][C]-[/C][C]-[/C][/ROW]
[ROW][C]96[/C][C]3900[/C][C]-[/C][C]-[/C][C]-[/C][C]-[/C][C]-[/C][C]-[/C][C]-[/C][/ROW]
[ROW][C]97[/C][C]5200[/C][C]-[/C][C]-[/C][C]-[/C][C]-[/C][C]-[/C][C]-[/C][C]-[/C][/ROW]
[ROW][C]98[/C][C]5100[/C][C]-[/C][C]-[/C][C]-[/C][C]-[/C][C]-[/C][C]-[/C][C]-[/C][/ROW]
[ROW][C]99[/C][C]5900[/C][C]-[/C][C]-[/C][C]-[/C][C]-[/C][C]-[/C][C]-[/C][C]-[/C][/ROW]
[ROW][C]100[/C][C]6600[/C][C]-[/C][C]-[/C][C]-[/C][C]-[/C][C]-[/C][C]-[/C][C]-[/C][/ROW]
[ROW][C]101[/C][C]6800[/C][C]-[/C][C]-[/C][C]-[/C][C]-[/C][C]-[/C][C]-[/C][C]-[/C][/ROW]
[ROW][C]102[/C][C]6000[/C][C]-[/C][C]-[/C][C]-[/C][C]-[/C][C]-[/C][C]-[/C][C]-[/C][/ROW]
[ROW][C]103[/C][C]6000[/C][C]6011.1236[/C][C]4105.1536[/C][C]7697.5532[/C][C]0.4948[/C][C]0.5052[/C][C]0.5514[/C][C]0.5052[/C][/ROW]
[ROW][C]104[/C][C]7400[/C][C]7218.772[/C][C]5033.4872[/C][C]9162.9648[/C][C]0.4275[/C][C]0.8904[/C][C]0.4674[/C][C]0.8904[/C][/ROW]
[ROW][C]105[/C][C]6000[/C][C]6833.6479[/C][C]4585.2808[/C][C]8813.9785[/C][C]0.2047[/C][C]0.2876[/C][C]0.7953[/C][C]0.7953[/C][/ROW]
[ROW][C]106[/C][C]6700[/C][C]7480.3735[/C][C]5334.2969[/C][C]9401.2427[/C][C]0.2129[/C][C]0.9345[/C][C]0.573[/C][C]0.9345[/C][/ROW]
[ROW][C]107[/C][C]3900[/C][C]5862.3889[/C][C]3416.3131[/C][C]7944.9199[/C][C]0.0324[/C][C]0.2153[/C][C]0.7335[/C][C]0.4485[/C][/ROW]
[ROW][C]108[/C][C]4500[/C][C]4786.1752[/C][C]2007.8701[/C][C]7002.5337[/C][C]0.4001[/C][C]0.7834[/C][C]0.7834[/C][C]0.1415[/C][/ROW]
[ROW][C]109[/C][C]4600[/C][C]5499.8884[/C][C]2971.676[/C][C]7616.9928[/C][C]0.2024[/C][C]0.8227[/C][C]0.6094[/C][C]0.3217[/C][/ROW]
[ROW][C]110[/C][C]5500[/C][C]5492.3624[/C][C]2962.045[/C][C]7610.3866[/C][C]0.4972[/C][C]0.7955[/C][C]0.6417[/C][C]0.3193[/C][/ROW]
[ROW][C]111[/C][C]6400[/C][C]6469.2398[/C][C]4164.8044[/C][C]8477.92[/C][C]0.4731[/C][C]0.8279[/C][C]0.7107[/C][C]0.6765[/C][/ROW]
[ROW][C]112[/C][C]6600[/C][C]7416.9835[/C][C]5271.34[/C][C]9335.7137[/C][C]0.202[/C][C]0.8506[/C][C]0.798[/C][C]0.9261[/C][/ROW]
[ROW][C]113[/C][C]5700[/C][C]6912.9681[/C][C]4688.3219[/C][C]8877.8105[/C][C]0.1131[/C][C]0.6226[/C][C]0.5449[/C][C]0.8188[/C][/ROW]
[ROW][C]114[/C][C]6100[/C][C]6453.6641[/C][C]4146.2208[/C][C]8463.9432[/C][C]0.3651[/C][C]0.7688[/C][C]0.6709[/C][C]0.6709[/C][/ROW]
[ROW][C]115[/C][C]6500[/C][C]6486.2577[/C][C]4175.7702[/C][C]8500.2144[/C][C]0.4947[/C][C]0.6465[/C][C]0.682[/C][C]0.682[/C][/ROW]
[ROW][C]116[/C][C]6000[/C][C]7216.9476[/C][C]5027.993[/C][C]9163.9707[/C][C]0.1103[/C][C]0.7648[/C][C]0.4269[/C][C]0.8897[/C][/ROW]
[ROW][C]117[/C][C]6200[/C][C]6832.7116[/C][C]4580.6673[/C][C]8815.8387[/C][C]0.2659[/C][C]0.7947[/C][C]0.7947[/C][C]0.7947[/C][/ROW]
[ROW][C]118[/C][C]4800[/C][C]7477.9554[/C][C]5328.2195[/C][C]9401.673[/C][C]0.0032[/C][C]0.9036[/C][C]0.786[/C][C]0.9339[/C][/ROW]
[ROW][C]119[/C][C]4000[/C][C]5863.7837[/C][C]3414.0907[/C][C]7948.9754[/C][C]0.0399[/C][C]0.8413[/C][C]0.9675[/C][C]0.4491[/C][/ROW]
[ROW][C]120[/C][C]5400[/C][C]4790.3641[/C][C]2008.8799[/C][C]7009.1159[/C][C]0.2951[/C][C]0.7575[/C][C]0.6012[/C][C]0.1426[/C][/ROW]
[ROW][C]121[/C][C]5300[/C][C]5502.1949[/C][C]2970.3709[/C][C]7621.9375[/C][C]0.4258[/C][C]0.5376[/C][C]0.7979[/C][C]0.3227[/C][/ROW]
[ROW][C]122[/C][C]6800[/C][C]5494.688[/C][C]2960.7612[/C][C]7615.3488[/C][C]0.1138[/C][C]0.5714[/C][C]0.498[/C][C]0.3202[/C][/ROW]
[ROW][C]123[/C][C]6900[/C][C]6469.1615[/C][C]4160.9921[/C][C]8480.6475[/C][C]0.3373[/C][C]0.3736[/C][C]0.5269[/C][C]0.6762[/C][/ROW]
[ROW][C]124[/C][C]6600[/C][C]7414.7086[/C][C]5265.3471[/C][C]9336.3311[/C][C]0.203[/C][C]0.7002[/C][C]0.797[/C][C]0.9255[/C][/ROW]
[ROW][C]125[/C][C]7000[/C][C]6911.8474[/C][C]4683.4658[/C][C]8879.5434[/C][C]0.465[/C][C]0.622[/C][C]0.8863[/C][C]0.8181[/C][/ROW]
[ROW][C]126[/C][C]7200[/C][C]6453.6228[/C][C]4142.4461[/C][C]8466.7058[/C][C]0.2337[/C][C]0.2974[/C][C]0.6347[/C][C]0.6706[/C][/ROW]
[/TABLE]
Source: https://freestatistics.org/blog/index.php?pk=303542&T=1

Globally Unique Identifier (entire table): ba.freestatistics.org/blog/index.php?pk=303542&T=1

As an alternative you can also use a QR Code:  

The GUIDs for individual cells are displayed in the table below:

Univariate ARIMA Extrapolation Forecast
timeY[t]F[t]95% LB95% UBp-value(H0: Y[t] = F[t])P(F[t]>Y[t-1])P(F[t]>Y[t-s])P(F[t]>Y[102])
905900-------
915900-------
927300-------
936000-------
947300-------
955200-------
963900-------
975200-------
985100-------
995900-------
1006600-------
1016800-------
1026000-------
10360006011.12364105.15367697.55320.49480.50520.55140.5052
10474007218.7725033.48729162.96480.42750.89040.46740.8904
10560006833.64794585.28088813.97850.20470.28760.79530.7953
10667007480.37355334.29699401.24270.21290.93450.5730.9345
10739005862.38893416.31317944.91990.03240.21530.73350.4485
10845004786.17522007.87017002.53370.40010.78340.78340.1415
10946005499.88842971.6767616.99280.20240.82270.60940.3217
11055005492.36242962.0457610.38660.49720.79550.64170.3193
11164006469.23984164.80448477.920.47310.82790.71070.6765
11266007416.98355271.349335.71370.2020.85060.7980.9261
11357006912.96814688.32198877.81050.11310.62260.54490.8188
11461006453.66414146.22088463.94320.36510.76880.67090.6709
11565006486.25774175.77028500.21440.49470.64650.6820.682
11660007216.94765027.9939163.97070.11030.76480.42690.8897
11762006832.71164580.66738815.83870.26590.79470.79470.7947
11848007477.95545328.21959401.6730.00320.90360.7860.9339
11940005863.78373414.09077948.97540.03990.84130.96750.4491
12054004790.36412008.87997009.11590.29510.75750.60120.1426
12153005502.19492970.37097621.93750.42580.53760.79790.3227
12268005494.6882960.76127615.34880.11380.57140.4980.3202
12369006469.16154160.99218480.64750.33730.37360.52690.6762
12466007414.70865265.34719336.33110.2030.70020.7970.9255
12570006911.84744683.46588879.54340.4650.6220.88630.8181
12672006453.62284142.44618466.70580.23370.29740.63470.6706


Univariate ARIMA Extrapolation Forecast Performance
time% S.E.PEMAPEsMAPESq.EMSERMSEScaledEMASE
1030.1431-0.00190.00190.0019123.73400-0.01450.0145
1040.13740.02450.01320.013332843.575416483.6547128.38870.23680.1257
1050.1479-0.13890.05510.0522694968.7568242645.3554492.5905-1.08940.4469
1060.131-0.11650.07040.0667608982.7889334229.7138578.126-1.01980.5902
1070.1812-0.50320.1570.13373850970.2291037577.81681018.6156-2.56450.985
1080.2363-0.06360.14140.121781896.2312878297.5525937.1753-0.3740.8832
1090.1964-0.19560.14920.1298809799.2186868512.0763931.94-1.1760.925
1100.19680.00140.13070.113758.3327759955.3583871.75420.010.8106
1110.1584-0.01080.11740.10234794.1528676048.5577822.2217-0.09050.7306
1120.132-0.12380.1180.1037667462.0539675189.9073821.6994-1.06760.7643
1130.145-0.21280.12660.11181471291.5373747562.7828864.6171-1.58510.8389
1140.1589-0.0580.12090.1072125078.309695689.0766834.0798-0.46220.8075
1150.15840.00210.11180.0991188.8509642189.0593801.3670.0180.7468
1160.1376-0.20280.11830.10521480961.4519702101.373837.9149-1.59030.8071
1170.1481-0.10210.11720.1046400323.9779681982.88825.8225-0.82680.8084
1180.1313-0.55790.14470.12537171445.05331087574.26581042.8683-3.49960.9766
1190.1814-0.46590.16360.14023473689.81031227934.00371108.1218-2.43561.0624
1200.23630.11290.16080.1391371655.93311180362.99981086.44510.79671.0476
1210.1966-0.03810.15440.133740882.75851120390.35551058.4849-0.26421.0064
1220.19690.1920.15620.13761703839.34231149562.80491072.17671.70581.0414
1230.15860.06240.15180.1342185621.84881103660.85461050.55260.5631.0186
1240.1322-0.12340.15050.1333663750.08031083664.91031040.9923-1.06471.0207
1250.14520.01260.14450.12817770.87881036886.90891018.27640.11520.9813
1260.15910.10370.14280.1273557078.86551016894.90711008.41210.97540.9811

\begin{tabular}{lllllllll}
\hline
Univariate ARIMA Extrapolation Forecast Performance \tabularnewline
time & % S.E. & PE & MAPE & sMAPE & Sq.E & MSE & RMSE & ScaledE & MASE \tabularnewline
103 & 0.1431 & -0.0019 & 0.0019 & 0.0019 & 123.734 & 0 & 0 & -0.0145 & 0.0145 \tabularnewline
104 & 0.1374 & 0.0245 & 0.0132 & 0.0133 & 32843.5754 & 16483.6547 & 128.3887 & 0.2368 & 0.1257 \tabularnewline
105 & 0.1479 & -0.1389 & 0.0551 & 0.0522 & 694968.7568 & 242645.3554 & 492.5905 & -1.0894 & 0.4469 \tabularnewline
106 & 0.131 & -0.1165 & 0.0704 & 0.0667 & 608982.7889 & 334229.7138 & 578.126 & -1.0198 & 0.5902 \tabularnewline
107 & 0.1812 & -0.5032 & 0.157 & 0.1337 & 3850970.229 & 1037577.8168 & 1018.6156 & -2.5645 & 0.985 \tabularnewline
108 & 0.2363 & -0.0636 & 0.1414 & 0.1217 & 81896.2312 & 878297.5525 & 937.1753 & -0.374 & 0.8832 \tabularnewline
109 & 0.1964 & -0.1956 & 0.1492 & 0.1298 & 809799.2186 & 868512.0763 & 931.94 & -1.176 & 0.925 \tabularnewline
110 & 0.1968 & 0.0014 & 0.1307 & 0.1137 & 58.3327 & 759955.3583 & 871.7542 & 0.01 & 0.8106 \tabularnewline
111 & 0.1584 & -0.0108 & 0.1174 & 0.1023 & 4794.1528 & 676048.5577 & 822.2217 & -0.0905 & 0.7306 \tabularnewline
112 & 0.132 & -0.1238 & 0.118 & 0.1037 & 667462.0539 & 675189.9073 & 821.6994 & -1.0676 & 0.7643 \tabularnewline
113 & 0.145 & -0.2128 & 0.1266 & 0.1118 & 1471291.5373 & 747562.7828 & 864.6171 & -1.5851 & 0.8389 \tabularnewline
114 & 0.1589 & -0.058 & 0.1209 & 0.1072 & 125078.309 & 695689.0766 & 834.0798 & -0.4622 & 0.8075 \tabularnewline
115 & 0.1584 & 0.0021 & 0.1118 & 0.0991 & 188.8509 & 642189.0593 & 801.367 & 0.018 & 0.7468 \tabularnewline
116 & 0.1376 & -0.2028 & 0.1183 & 0.1052 & 1480961.4519 & 702101.373 & 837.9149 & -1.5903 & 0.8071 \tabularnewline
117 & 0.1481 & -0.1021 & 0.1172 & 0.1046 & 400323.9779 & 681982.88 & 825.8225 & -0.8268 & 0.8084 \tabularnewline
118 & 0.1313 & -0.5579 & 0.1447 & 0.1253 & 7171445.0533 & 1087574.2658 & 1042.8683 & -3.4996 & 0.9766 \tabularnewline
119 & 0.1814 & -0.4659 & 0.1636 & 0.1402 & 3473689.8103 & 1227934.0037 & 1108.1218 & -2.4356 & 1.0624 \tabularnewline
120 & 0.2363 & 0.1129 & 0.1608 & 0.1391 & 371655.9331 & 1180362.9998 & 1086.4451 & 0.7967 & 1.0476 \tabularnewline
121 & 0.1966 & -0.0381 & 0.1544 & 0.1337 & 40882.7585 & 1120390.3555 & 1058.4849 & -0.2642 & 1.0064 \tabularnewline
122 & 0.1969 & 0.192 & 0.1562 & 0.1376 & 1703839.3423 & 1149562.8049 & 1072.1767 & 1.7058 & 1.0414 \tabularnewline
123 & 0.1586 & 0.0624 & 0.1518 & 0.1342 & 185621.8488 & 1103660.8546 & 1050.5526 & 0.563 & 1.0186 \tabularnewline
124 & 0.1322 & -0.1234 & 0.1505 & 0.1333 & 663750.0803 & 1083664.9103 & 1040.9923 & -1.0647 & 1.0207 \tabularnewline
125 & 0.1452 & 0.0126 & 0.1445 & 0.1281 & 7770.8788 & 1036886.9089 & 1018.2764 & 0.1152 & 0.9813 \tabularnewline
126 & 0.1591 & 0.1037 & 0.1428 & 0.1273 & 557078.8655 & 1016894.9071 & 1008.4121 & 0.9754 & 0.9811 \tabularnewline
\hline
\end{tabular}
%Source: https://freestatistics.org/blog/index.php?pk=303542&T=2

[TABLE]
[ROW][C]Univariate ARIMA Extrapolation Forecast Performance[/C][/ROW]
[ROW][C]time[/C][C]% S.E.[/C][C]PE[/C][C]MAPE[/C][C]sMAPE[/C][C]Sq.E[/C][C]MSE[/C][C]RMSE[/C][C]ScaledE[/C][C]MASE[/C][/ROW]
[ROW][C]103[/C][C]0.1431[/C][C]-0.0019[/C][C]0.0019[/C][C]0.0019[/C][C]123.734[/C][C]0[/C][C]0[/C][C]-0.0145[/C][C]0.0145[/C][/ROW]
[ROW][C]104[/C][C]0.1374[/C][C]0.0245[/C][C]0.0132[/C][C]0.0133[/C][C]32843.5754[/C][C]16483.6547[/C][C]128.3887[/C][C]0.2368[/C][C]0.1257[/C][/ROW]
[ROW][C]105[/C][C]0.1479[/C][C]-0.1389[/C][C]0.0551[/C][C]0.0522[/C][C]694968.7568[/C][C]242645.3554[/C][C]492.5905[/C][C]-1.0894[/C][C]0.4469[/C][/ROW]
[ROW][C]106[/C][C]0.131[/C][C]-0.1165[/C][C]0.0704[/C][C]0.0667[/C][C]608982.7889[/C][C]334229.7138[/C][C]578.126[/C][C]-1.0198[/C][C]0.5902[/C][/ROW]
[ROW][C]107[/C][C]0.1812[/C][C]-0.5032[/C][C]0.157[/C][C]0.1337[/C][C]3850970.229[/C][C]1037577.8168[/C][C]1018.6156[/C][C]-2.5645[/C][C]0.985[/C][/ROW]
[ROW][C]108[/C][C]0.2363[/C][C]-0.0636[/C][C]0.1414[/C][C]0.1217[/C][C]81896.2312[/C][C]878297.5525[/C][C]937.1753[/C][C]-0.374[/C][C]0.8832[/C][/ROW]
[ROW][C]109[/C][C]0.1964[/C][C]-0.1956[/C][C]0.1492[/C][C]0.1298[/C][C]809799.2186[/C][C]868512.0763[/C][C]931.94[/C][C]-1.176[/C][C]0.925[/C][/ROW]
[ROW][C]110[/C][C]0.1968[/C][C]0.0014[/C][C]0.1307[/C][C]0.1137[/C][C]58.3327[/C][C]759955.3583[/C][C]871.7542[/C][C]0.01[/C][C]0.8106[/C][/ROW]
[ROW][C]111[/C][C]0.1584[/C][C]-0.0108[/C][C]0.1174[/C][C]0.1023[/C][C]4794.1528[/C][C]676048.5577[/C][C]822.2217[/C][C]-0.0905[/C][C]0.7306[/C][/ROW]
[ROW][C]112[/C][C]0.132[/C][C]-0.1238[/C][C]0.118[/C][C]0.1037[/C][C]667462.0539[/C][C]675189.9073[/C][C]821.6994[/C][C]-1.0676[/C][C]0.7643[/C][/ROW]
[ROW][C]113[/C][C]0.145[/C][C]-0.2128[/C][C]0.1266[/C][C]0.1118[/C][C]1471291.5373[/C][C]747562.7828[/C][C]864.6171[/C][C]-1.5851[/C][C]0.8389[/C][/ROW]
[ROW][C]114[/C][C]0.1589[/C][C]-0.058[/C][C]0.1209[/C][C]0.1072[/C][C]125078.309[/C][C]695689.0766[/C][C]834.0798[/C][C]-0.4622[/C][C]0.8075[/C][/ROW]
[ROW][C]115[/C][C]0.1584[/C][C]0.0021[/C][C]0.1118[/C][C]0.0991[/C][C]188.8509[/C][C]642189.0593[/C][C]801.367[/C][C]0.018[/C][C]0.7468[/C][/ROW]
[ROW][C]116[/C][C]0.1376[/C][C]-0.2028[/C][C]0.1183[/C][C]0.1052[/C][C]1480961.4519[/C][C]702101.373[/C][C]837.9149[/C][C]-1.5903[/C][C]0.8071[/C][/ROW]
[ROW][C]117[/C][C]0.1481[/C][C]-0.1021[/C][C]0.1172[/C][C]0.1046[/C][C]400323.9779[/C][C]681982.88[/C][C]825.8225[/C][C]-0.8268[/C][C]0.8084[/C][/ROW]
[ROW][C]118[/C][C]0.1313[/C][C]-0.5579[/C][C]0.1447[/C][C]0.1253[/C][C]7171445.0533[/C][C]1087574.2658[/C][C]1042.8683[/C][C]-3.4996[/C][C]0.9766[/C][/ROW]
[ROW][C]119[/C][C]0.1814[/C][C]-0.4659[/C][C]0.1636[/C][C]0.1402[/C][C]3473689.8103[/C][C]1227934.0037[/C][C]1108.1218[/C][C]-2.4356[/C][C]1.0624[/C][/ROW]
[ROW][C]120[/C][C]0.2363[/C][C]0.1129[/C][C]0.1608[/C][C]0.1391[/C][C]371655.9331[/C][C]1180362.9998[/C][C]1086.4451[/C][C]0.7967[/C][C]1.0476[/C][/ROW]
[ROW][C]121[/C][C]0.1966[/C][C]-0.0381[/C][C]0.1544[/C][C]0.1337[/C][C]40882.7585[/C][C]1120390.3555[/C][C]1058.4849[/C][C]-0.2642[/C][C]1.0064[/C][/ROW]
[ROW][C]122[/C][C]0.1969[/C][C]0.192[/C][C]0.1562[/C][C]0.1376[/C][C]1703839.3423[/C][C]1149562.8049[/C][C]1072.1767[/C][C]1.7058[/C][C]1.0414[/C][/ROW]
[ROW][C]123[/C][C]0.1586[/C][C]0.0624[/C][C]0.1518[/C][C]0.1342[/C][C]185621.8488[/C][C]1103660.8546[/C][C]1050.5526[/C][C]0.563[/C][C]1.0186[/C][/ROW]
[ROW][C]124[/C][C]0.1322[/C][C]-0.1234[/C][C]0.1505[/C][C]0.1333[/C][C]663750.0803[/C][C]1083664.9103[/C][C]1040.9923[/C][C]-1.0647[/C][C]1.0207[/C][/ROW]
[ROW][C]125[/C][C]0.1452[/C][C]0.0126[/C][C]0.1445[/C][C]0.1281[/C][C]7770.8788[/C][C]1036886.9089[/C][C]1018.2764[/C][C]0.1152[/C][C]0.9813[/C][/ROW]
[ROW][C]126[/C][C]0.1591[/C][C]0.1037[/C][C]0.1428[/C][C]0.1273[/C][C]557078.8655[/C][C]1016894.9071[/C][C]1008.4121[/C][C]0.9754[/C][C]0.9811[/C][/ROW]
[/TABLE]
Source: https://freestatistics.org/blog/index.php?pk=303542&T=2

Globally Unique Identifier (entire table): ba.freestatistics.org/blog/index.php?pk=303542&T=2

As an alternative you can also use a QR Code:  

The GUIDs for individual cells are displayed in the table below:

Univariate ARIMA Extrapolation Forecast Performance
time% S.E.PEMAPEsMAPESq.EMSERMSEScaledEMASE
1030.1431-0.00190.00190.0019123.73400-0.01450.0145
1040.13740.02450.01320.013332843.575416483.6547128.38870.23680.1257
1050.1479-0.13890.05510.0522694968.7568242645.3554492.5905-1.08940.4469
1060.131-0.11650.07040.0667608982.7889334229.7138578.126-1.01980.5902
1070.1812-0.50320.1570.13373850970.2291037577.81681018.6156-2.56450.985
1080.2363-0.06360.14140.121781896.2312878297.5525937.1753-0.3740.8832
1090.1964-0.19560.14920.1298809799.2186868512.0763931.94-1.1760.925
1100.19680.00140.13070.113758.3327759955.3583871.75420.010.8106
1110.1584-0.01080.11740.10234794.1528676048.5577822.2217-0.09050.7306
1120.132-0.12380.1180.1037667462.0539675189.9073821.6994-1.06760.7643
1130.145-0.21280.12660.11181471291.5373747562.7828864.6171-1.58510.8389
1140.1589-0.0580.12090.1072125078.309695689.0766834.0798-0.46220.8075
1150.15840.00210.11180.0991188.8509642189.0593801.3670.0180.7468
1160.1376-0.20280.11830.10521480961.4519702101.373837.9149-1.59030.8071
1170.1481-0.10210.11720.1046400323.9779681982.88825.8225-0.82680.8084
1180.1313-0.55790.14470.12537171445.05331087574.26581042.8683-3.49960.9766
1190.1814-0.46590.16360.14023473689.81031227934.00371108.1218-2.43561.0624
1200.23630.11290.16080.1391371655.93311180362.99981086.44510.79671.0476
1210.1966-0.03810.15440.133740882.75851120390.35551058.4849-0.26421.0064
1220.19690.1920.15620.13761703839.34231149562.80491072.17671.70581.0414
1230.15860.06240.15180.1342185621.84881103660.85461050.55260.5631.0186
1240.1322-0.12340.15050.1333663750.08031083664.91031040.9923-1.06471.0207
1250.14520.01260.14450.12817770.87881036886.90891018.27640.11520.9813
1260.15910.10370.14280.1273557078.86551016894.90711008.41210.97540.9811


Parameters (Session):
par1 = Full Box-Cox transform ; par2 = -2 ; par3 = 2 ; par4 = 0 ; par5 = No ;
Parameters (R input):
par1 = 24 ; par2 = 1.4 ; par3 = 0 ; par4 = 0 ; par5 = 12 ; par6 = 0 ; par7 = 1 ; par8 = 1 ; par9 = 1 ; par10 = TRUE ;
R code (references can be found in the software module):
par10 <- 'TRUE'
par9 <- '1'
par8 <- '1'
par7 <- '1'
par6 <- '0'
par5 <- '12'
par4 <- '1'
par3 <- '1'
par2 <- '1.4'
par1 <- '24'
par1 <- as.numeric(par1) #cut off periods
par2 <- as.numeric(par2) #lambda
par3 <- as.numeric(par3) #degree of non-seasonal differencing
par4 <- as.numeric(par4) #degree of seasonal differencing
par5 <- as.numeric(par5) #seasonal period
par6 <- as.numeric(par6) #p
par7 <- as.numeric(par7) #q
par8 <- as.numeric(par8) #P
par9 <- as.numeric(par9) #Q
if (par10 == 'TRUE') par10 <- TRUE
if (par10 == 'FALSE') par10 <- FALSE
if (par2 == 0) x <- log(x)
if (par2 != 0) x <- x^par2
lx <- length(x)
first <- lx - 2*par1
nx <- lx - par1
nx1 <- nx + 1
fx <- lx - nx
if (fx < 1) {
fx <- par5*2
nx1 <- lx + fx - 1
first <- lx - 2*fx
}
first <- 1
if (fx < 3) fx <- round(lx/10,0)
(arima.out <- arima(x[1:nx], order=c(par6,par3,par7), seasonal=list(order=c(par8,par4,par9), period=par5), include.mean=par10, method='ML'))
(forecast <- predict(arima.out,fx))
(lb <- forecast$pred - 1.96 * forecast$se)
(ub <- forecast$pred + 1.96 * forecast$se)
if (par2 == 0) {
x <- exp(x)
forecast$pred <- exp(forecast$pred)
lb <- exp(lb)
ub <- exp(ub)
}
if (par2 != 0) {
x <- x^(1/par2)
forecast$pred <- forecast$pred^(1/par2)
lb <- lb^(1/par2)
ub <- ub^(1/par2)
}
if (par2 < 0) {
olb <- lb
lb <- ub
ub <- olb
}
(actandfor <- c(x[1:nx], forecast$pred))
(perc.se <- (ub-forecast$pred)/1.96/forecast$pred)
bitmap(file='test1.png')
opar <- par(mar=c(4,4,2,2),las=1)
ylim <- c( min(x[first:nx],lb), max(x[first:nx],ub))
plot(x,ylim=ylim,type='n',xlim=c(first,lx))
usr <- par('usr')
rect(usr[1],usr[3],nx+1,usr[4],border=NA,col='lemonchiffon')
rect(nx1,usr[3],usr[2],usr[4],border=NA,col='lavender')
abline(h= (-3:3)*2 , col ='gray', lty =3)
polygon( c(nx1:lx,lx:nx1), c(lb,rev(ub)), col = 'orange', lty=2,border=NA)
lines(nx1:lx, lb , lty=2)
lines(nx1:lx, ub , lty=2)
lines(x, lwd=2)
lines(nx1:lx, forecast$pred , lwd=2 , col ='white')
box()
par(opar)
dev.off()
prob.dec <- array(NA, dim=fx)
prob.sdec <- array(NA, dim=fx)
prob.ldec <- array(NA, dim=fx)
prob.pval <- array(NA, dim=fx)
perf.pe <- array(0, dim=fx)
perf.spe <- array(0, dim=fx)
perf.scalederr <- array(0, dim=fx)
perf.mase <- array(0, dim=fx)
perf.mase1 <- array(0, dim=fx)
perf.mape <- array(0, dim=fx)
perf.smape <- array(0, dim=fx)
perf.mape1 <- array(0, dim=fx)
perf.smape1 <- array(0,dim=fx)
perf.se <- array(0, dim=fx)
perf.mse <- array(0, dim=fx)
perf.mse1 <- array(0, dim=fx)
perf.rmse <- array(0, dim=fx)
perf.scaleddenom <- 0
for (i in 2:fx) {
perf.scaleddenom = perf.scaleddenom + abs(x[nx+i] - x[nx+i-1])
}
perf.scaleddenom = perf.scaleddenom / (fx-1)
for (i in 1:fx) {
locSD <- (ub[i] - forecast$pred[i]) / 1.96
perf.scalederr[i] = (x[nx+i] - forecast$pred[i]) / perf.scaleddenom
perf.pe[i] = (x[nx+i] - forecast$pred[i]) / x[nx+i]
perf.spe[i] = 2*(x[nx+i] - forecast$pred[i]) / (x[nx+i] + forecast$pred[i])
perf.se[i] = (x[nx+i] - forecast$pred[i])^2
prob.dec[i] = pnorm((x[nx+i-1] - forecast$pred[i]) / locSD)
prob.sdec[i] = pnorm((x[nx+i-par5] - forecast$pred[i]) / locSD)
prob.ldec[i] = pnorm((x[nx] - forecast$pred[i]) / locSD)
prob.pval[i] = pnorm(abs(x[nx+i] - forecast$pred[i]) / locSD)
}
perf.mape[1] = abs(perf.pe[1])
perf.smape[1] = abs(perf.spe[1])
perf.mape1[1] = perf.mape[1]
perf.smape1[1] = perf.smape[1]
perf.mse[1] = perf.se[1]
perf.mase[1] = abs(perf.scalederr[1])
perf.mase1[1] = perf.mase[1]
for (i in 2:fx) {
perf.mape[i] = perf.mape[i-1] + abs(perf.pe[i])
perf.mape1[i] = perf.mape[i] / i
perf.smape[i] = perf.smape[i-1] + abs(perf.spe[i])
perf.smape1[i] = perf.smape[i] / i
perf.mse[i] = perf.mse[i-1] + perf.se[i]
perf.mse1[i] = perf.mse[i] / i
perf.mase[i] = perf.mase[i-1] + abs(perf.scalederr[i])
perf.mase1[i] = perf.mase[i] / i
}
perf.rmse = sqrt(perf.mse1)
bitmap(file='test2.png')
plot(forecast$pred, pch=19, type='b',main='ARIMA Extrapolation Forecast', ylab='Forecast and 95% CI', xlab='time',ylim=c(min(lb),max(ub)))
dum <- forecast$pred
dum[1:par1] <- x[(nx+1):lx]
lines(dum, lty=1)
lines(ub,lty=3)
lines(lb,lty=3)
dev.off()
load(file='createtable')
a<-table.start()
a<-table.row.start(a)
a<-table.element(a,'Univariate ARIMA Extrapolation Forecast',9,TRUE)
a<-table.row.end(a)
a<-table.row.start(a)
a<-table.element(a,'time',1,header=TRUE)
a<-table.element(a,'Y[t]',1,header=TRUE)
a<-table.element(a,'F[t]',1,header=TRUE)
a<-table.element(a,'95% LB',1,header=TRUE)
a<-table.element(a,'95% UB',1,header=TRUE)
a<-table.element(a,'p-value
(H0: Y[t] = F[t])',1,header=TRUE)
a<-table.element(a,'P(F[t]>Y[t-1])',1,header=TRUE)
a<-table.element(a,'P(F[t]>Y[t-s])',1,header=TRUE)
mylab <- paste('P(F[t]>Y[',nx,sep='')
mylab <- paste(mylab,'])',sep='')
a<-table.element(a,mylab,1,header=TRUE)
a<-table.row.end(a)
for (i in (nx-par5):nx) {
a<-table.row.start(a)
a<-table.element(a,i,header=TRUE)
a<-table.element(a,x[i])
a<-table.element(a,'-')
a<-table.row.end(a)
}
for (i in 1:fx) {
a<-table.row.start(a)
a<-table.element(a,nx+i,header=TRUE)
a<-table.element(a,round(x[nx+i],4))
a<-table.element(a,round(forecast$pred[i],4))
a<-table.element(a,round(lb[i],4))
a<-table.element(a,round(ub[i],4))
a<-table.element(a,round((1-prob.pval[i]),4))
a<-table.element(a,round((1-prob.dec[i]),4))
a<-table.element(a,round((1-prob.sdec[i]),4))
a<-table.element(a,round((1-prob.ldec[i]),4))
a<-table.row.end(a)
}
a<-table.end(a)
table.save(a,file='mytable.tab')
a<-table.start()
a<-table.row.start(a)
a<-table.element(a,'Univariate ARIMA Extrapolation Forecast Performance',10,TRUE)
a<-table.row.end(a)
a<-table.row.start(a)
a<-table.element(a,'time',1,header=TRUE)
a<-table.element(a,'% S.E.',1,header=TRUE)
a<-table.element(a,'PE',1,header=TRUE)
a<-table.element(a,'MAPE',1,header=TRUE)
a<-table.element(a,'sMAPE',1,header=TRUE)
a<-table.element(a,'Sq.E',1,header=TRUE)
a<-table.element(a,'MSE',1,header=TRUE)
a<-table.element(a,'RMSE',1,header=TRUE)
a<-table.element(a,'ScaledE',1,header=TRUE)
a<-table.element(a,'MASE',1,header=TRUE)
a<-table.row.end(a)
for (i in 1:fx) {
a<-table.row.start(a)
a<-table.element(a,nx+i,header=TRUE)
a<-table.element(a,round(perc.se[i],4))
a<-table.element(a,round(perf.pe[i],4))
a<-table.element(a,round(perf.mape1[i],4))
a<-table.element(a,round(perf.smape1[i],4))
a<-table.element(a,round(perf.se[i],4))
a<-table.element(a,round(perf.mse1[i],4))
a<-table.element(a,round(perf.rmse[i],4))
a<-table.element(a,round(perf.scalederr[i],4))
a<-table.element(a,round(perf.mase1[i],4))
a<-table.row.end(a)
}
a<-table.end(a)
table.save(a,file='mytable1.tab')