Free Statistics

of Irreproducible Research!

Author's title

Author*The author of this computation has been verified*
R Software Modulerwasp_arimabackwardselection.wasp
Title produced by softwareARIMA Backward Selection
Date of computationSun, 22 Jan 2017 17:18:09 +0100
Cite this page as followsStatistical Computations at FreeStatistics.org, Office for Research Development and Education, URL https://freestatistics.org/blog/index.php?v=date/2017/Jan/22/t14851019523tw4bvom3xl5awd.htm/, Retrieved Tue, 14 May 2024 21:08:29 +0000
Statistical Computations at FreeStatistics.org, Office for Research Development and Education, URL https://freestatistics.org/blog/index.php?pk=303460, Retrieved Tue, 14 May 2024 21:08:29 +0000
QR Codes:

Original text written by user:
IsPrivate?No (this computation is public)
User-defined keywords
Estimated Impact86
Family? (F = Feedback message, R = changed R code, M = changed R Module, P = changed Parameters, D = changed Data)
-     [Chi-Squared Test, McNemar Test, and Fisher Exact Test] [Vraag 5] [2017-01-22 14:40:29] [ccb721ee1521a2d5d7762148e6df3ddd]
- RM D    [ARIMA Backward Selection] [Forec Arima Back] [2017-01-22 16:18:09] [a5a591d52ec67035c8301aa1739ae761] [Current]
- RM        [ARIMA Forecasting] [Arima Forecast] [2017-01-22 16:58:37] [ccb721ee1521a2d5d7762148e6df3ddd]
Feedback Forum

Post a new message
Dataseries X:
4800
4600
3400
4200
4150
5450
4350
4550
2250
5550
3050
6000
3400
8400
3600
5050
3900
3850
3550
5450
3950
5600
3400
4300
6200
4150
3500
2700
4100
4050
2700
4250
4700
8500
3500
3550
2850
3000
3450
2250
2750
5150
5400
3250
4050
3650
1700
2350
2800
2800
2050


Summary of computational transaction
Raw Input view raw input (R code)
Raw Outputview raw output of R engine
Computing time8 seconds
R ServerBig Analytics Cloud Computing Center

\begin{tabular}{lllllllll}
\hline
Summary of computational transaction \tabularnewline
Raw Input view raw input (R code)  \tabularnewline
Raw Outputview raw output of R engine  \tabularnewline
Computing time8 seconds \tabularnewline
R ServerBig Analytics Cloud Computing Center \tabularnewline
\hline
\end{tabular}
%Source: https://freestatistics.org/blog/index.php?pk=303460&T=0

[TABLE]
[ROW]
Summary of computational transaction[/C][/ROW] [ROW]Raw Input[/C] view raw input (R code) [/C][/ROW] [ROW]Raw Output[/C]view raw output of R engine [/C][/ROW] [ROW]Computing time[/C]8 seconds[/C][/ROW] [ROW]R Server[/C]Big Analytics Cloud Computing Center[/C][/ROW] [/TABLE] Source: https://freestatistics.org/blog/index.php?pk=303460&T=0

Globally Unique Identifier (entire table): ba.freestatistics.org/blog/index.php?pk=303460&T=0

As an alternative you can also use a QR Code:  

The GUIDs for individual cells are displayed in the table below:

Summary of computational transaction
Raw Input view raw input (R code)
Raw Outputview raw output of R engine
Computing time8 seconds
R ServerBig Analytics Cloud Computing Center


ARIMA Parameter Estimation and Backward Selection
Iterationar1ar2ar3ma1sar1sar2sma1
Estimates ( 1 )-0.40130.86970.38040.81460.90610.0884-0.9411
(p-val)(0.5368 )(1e-04 )(0.3802 )(0.1859 )(3e-04 )(0.6763 )(0.0206 )
Estimates ( 2 )-0.35660.86170.35220.77461.28120-1.003
(p-val)(0.5131 )(0 )(0.3361 )(0.125 )(0 )(NA )(0.0824 )
Estimates ( 3 )00.72330.15420.41560.99080-0.9305
(p-val)(NA )(0 )(0.1136 )(0.0079 )(0 )(NA )(0 )
Estimates ( 4 )00.776400.49610.99130-0.9174
(p-val)(NA )(0 )(NA )(0.0016 )(0 )(NA )(0 )
Estimates ( 5 )NANANANANANANA
(p-val)(NA )(NA )(NA )(NA )(NA )(NA )(NA )
Estimates ( 6 )NANANANANANANA
(p-val)(NA )(NA )(NA )(NA )(NA )(NA )(NA )
Estimates ( 7 )NANANANANANANA
(p-val)(NA )(NA )(NA )(NA )(NA )(NA )(NA )
Estimates ( 8 )NANANANANANANA
(p-val)(NA )(NA )(NA )(NA )(NA )(NA )(NA )
Estimates ( 9 )NANANANANANANA
(p-val)(NA )(NA )(NA )(NA )(NA )(NA )(NA )
Estimates ( 10 )NANANANANANANA
(p-val)(NA )(NA )(NA )(NA )(NA )(NA )(NA )
Estimates ( 11 )NANANANANANANA
(p-val)(NA )(NA )(NA )(NA )(NA )(NA )(NA )
Estimates ( 12 )NANANANANANANA
(p-val)(NA )(NA )(NA )(NA )(NA )(NA )(NA )
Estimates ( 13 )NANANANANANANA
(p-val)(NA )(NA )(NA )(NA )(NA )(NA )(NA )

\begin{tabular}{lllllllll}
\hline
ARIMA Parameter Estimation and Backward Selection \tabularnewline
Iteration & ar1 & ar2 & ar3 & ma1 & sar1 & sar2 & sma1 \tabularnewline
Estimates ( 1 ) & -0.4013 & 0.8697 & 0.3804 & 0.8146 & 0.9061 & 0.0884 & -0.9411 \tabularnewline
(p-val) & (0.5368 ) & (1e-04 ) & (0.3802 ) & (0.1859 ) & (3e-04 ) & (0.6763 ) & (0.0206 ) \tabularnewline
Estimates ( 2 ) & -0.3566 & 0.8617 & 0.3522 & 0.7746 & 1.2812 & 0 & -1.003 \tabularnewline
(p-val) & (0.5131 ) & (0 ) & (0.3361 ) & (0.125 ) & (0 ) & (NA ) & (0.0824 ) \tabularnewline
Estimates ( 3 ) & 0 & 0.7233 & 0.1542 & 0.4156 & 0.9908 & 0 & -0.9305 \tabularnewline
(p-val) & (NA ) & (0 ) & (0.1136 ) & (0.0079 ) & (0 ) & (NA ) & (0 ) \tabularnewline
Estimates ( 4 ) & 0 & 0.7764 & 0 & 0.4961 & 0.9913 & 0 & -0.9174 \tabularnewline
(p-val) & (NA ) & (0 ) & (NA ) & (0.0016 ) & (0 ) & (NA ) & (0 ) \tabularnewline
Estimates ( 5 ) & NA & NA & NA & NA & NA & NA & NA \tabularnewline
(p-val) & (NA ) & (NA ) & (NA ) & (NA ) & (NA ) & (NA ) & (NA ) \tabularnewline
Estimates ( 6 ) & NA & NA & NA & NA & NA & NA & NA \tabularnewline
(p-val) & (NA ) & (NA ) & (NA ) & (NA ) & (NA ) & (NA ) & (NA ) \tabularnewline
Estimates ( 7 ) & NA & NA & NA & NA & NA & NA & NA \tabularnewline
(p-val) & (NA ) & (NA ) & (NA ) & (NA ) & (NA ) & (NA ) & (NA ) \tabularnewline
Estimates ( 8 ) & NA & NA & NA & NA & NA & NA & NA \tabularnewline
(p-val) & (NA ) & (NA ) & (NA ) & (NA ) & (NA ) & (NA ) & (NA ) \tabularnewline
Estimates ( 9 ) & NA & NA & NA & NA & NA & NA & NA \tabularnewline
(p-val) & (NA ) & (NA ) & (NA ) & (NA ) & (NA ) & (NA ) & (NA ) \tabularnewline
Estimates ( 10 ) & NA & NA & NA & NA & NA & NA & NA \tabularnewline
(p-val) & (NA ) & (NA ) & (NA ) & (NA ) & (NA ) & (NA ) & (NA ) \tabularnewline
Estimates ( 11 ) & NA & NA & NA & NA & NA & NA & NA \tabularnewline
(p-val) & (NA ) & (NA ) & (NA ) & (NA ) & (NA ) & (NA ) & (NA ) \tabularnewline
Estimates ( 12 ) & NA & NA & NA & NA & NA & NA & NA \tabularnewline
(p-val) & (NA ) & (NA ) & (NA ) & (NA ) & (NA ) & (NA ) & (NA ) \tabularnewline
Estimates ( 13 ) & NA & NA & NA & NA & NA & NA & NA \tabularnewline
(p-val) & (NA ) & (NA ) & (NA ) & (NA ) & (NA ) & (NA ) & (NA ) \tabularnewline
\hline
\end{tabular}
%Source: https://freestatistics.org/blog/index.php?pk=303460&T=1

[TABLE]
[ROW][C]ARIMA Parameter Estimation and Backward Selection[/C][/ROW]
[ROW][C]Iteration[/C][C]ar1[/C][C]ar2[/C][C]ar3[/C][C]ma1[/C][C]sar1[/C][C]sar2[/C][C]sma1[/C][/ROW]
[ROW][C]Estimates ( 1 )[/C][C]-0.4013[/C][C]0.8697[/C][C]0.3804[/C][C]0.8146[/C][C]0.9061[/C][C]0.0884[/C][C]-0.9411[/C][/ROW]
[ROW][C](p-val)[/C][C](0.5368 )[/C][C](1e-04 )[/C][C](0.3802 )[/C][C](0.1859 )[/C][C](3e-04 )[/C][C](0.6763 )[/C][C](0.0206 )[/C][/ROW]
[ROW][C]Estimates ( 2 )[/C][C]-0.3566[/C][C]0.8617[/C][C]0.3522[/C][C]0.7746[/C][C]1.2812[/C][C]0[/C][C]-1.003[/C][/ROW]
[ROW][C](p-val)[/C][C](0.5131 )[/C][C](0 )[/C][C](0.3361 )[/C][C](0.125 )[/C][C](0 )[/C][C](NA )[/C][C](0.0824 )[/C][/ROW]
[ROW][C]Estimates ( 3 )[/C][C]0[/C][C]0.7233[/C][C]0.1542[/C][C]0.4156[/C][C]0.9908[/C][C]0[/C][C]-0.9305[/C][/ROW]
[ROW][C](p-val)[/C][C](NA )[/C][C](0 )[/C][C](0.1136 )[/C][C](0.0079 )[/C][C](0 )[/C][C](NA )[/C][C](0 )[/C][/ROW]
[ROW][C]Estimates ( 4 )[/C][C]0[/C][C]0.7764[/C][C]0[/C][C]0.4961[/C][C]0.9913[/C][C]0[/C][C]-0.9174[/C][/ROW]
[ROW][C](p-val)[/C][C](NA )[/C][C](0 )[/C][C](NA )[/C][C](0.0016 )[/C][C](0 )[/C][C](NA )[/C][C](0 )[/C][/ROW]
[ROW][C]Estimates ( 5 )[/C][C]NA[/C][C]NA[/C][C]NA[/C][C]NA[/C][C]NA[/C][C]NA[/C][C]NA[/C][/ROW]
[ROW][C](p-val)[/C][C](NA )[/C][C](NA )[/C][C](NA )[/C][C](NA )[/C][C](NA )[/C][C](NA )[/C][C](NA )[/C][/ROW]
[ROW][C]Estimates ( 6 )[/C][C]NA[/C][C]NA[/C][C]NA[/C][C]NA[/C][C]NA[/C][C]NA[/C][C]NA[/C][/ROW]
[ROW][C](p-val)[/C][C](NA )[/C][C](NA )[/C][C](NA )[/C][C](NA )[/C][C](NA )[/C][C](NA )[/C][C](NA )[/C][/ROW]
[ROW][C]Estimates ( 7 )[/C][C]NA[/C][C]NA[/C][C]NA[/C][C]NA[/C][C]NA[/C][C]NA[/C][C]NA[/C][/ROW]
[ROW][C](p-val)[/C][C](NA )[/C][C](NA )[/C][C](NA )[/C][C](NA )[/C][C](NA )[/C][C](NA )[/C][C](NA )[/C][/ROW]
[ROW][C]Estimates ( 8 )[/C][C]NA[/C][C]NA[/C][C]NA[/C][C]NA[/C][C]NA[/C][C]NA[/C][C]NA[/C][/ROW]
[ROW][C](p-val)[/C][C](NA )[/C][C](NA )[/C][C](NA )[/C][C](NA )[/C][C](NA )[/C][C](NA )[/C][C](NA )[/C][/ROW]
[ROW][C]Estimates ( 9 )[/C][C]NA[/C][C]NA[/C][C]NA[/C][C]NA[/C][C]NA[/C][C]NA[/C][C]NA[/C][/ROW]
[ROW][C](p-val)[/C][C](NA )[/C][C](NA )[/C][C](NA )[/C][C](NA )[/C][C](NA )[/C][C](NA )[/C][C](NA )[/C][/ROW]
[ROW][C]Estimates ( 10 )[/C][C]NA[/C][C]NA[/C][C]NA[/C][C]NA[/C][C]NA[/C][C]NA[/C][C]NA[/C][/ROW]
[ROW][C](p-val)[/C][C](NA )[/C][C](NA )[/C][C](NA )[/C][C](NA )[/C][C](NA )[/C][C](NA )[/C][C](NA )[/C][/ROW]
[ROW][C]Estimates ( 11 )[/C][C]NA[/C][C]NA[/C][C]NA[/C][C]NA[/C][C]NA[/C][C]NA[/C][C]NA[/C][/ROW]
[ROW][C](p-val)[/C][C](NA )[/C][C](NA )[/C][C](NA )[/C][C](NA )[/C][C](NA )[/C][C](NA )[/C][C](NA )[/C][/ROW]
[ROW][C]Estimates ( 12 )[/C][C]NA[/C][C]NA[/C][C]NA[/C][C]NA[/C][C]NA[/C][C]NA[/C][C]NA[/C][/ROW]
[ROW][C](p-val)[/C][C](NA )[/C][C](NA )[/C][C](NA )[/C][C](NA )[/C][C](NA )[/C][C](NA )[/C][C](NA )[/C][/ROW]
[ROW][C]Estimates ( 13 )[/C][C]NA[/C][C]NA[/C][C]NA[/C][C]NA[/C][C]NA[/C][C]NA[/C][C]NA[/C][/ROW]
[ROW][C](p-val)[/C][C](NA )[/C][C](NA )[/C][C](NA )[/C][C](NA )[/C][C](NA )[/C][C](NA )[/C][C](NA )[/C][/ROW]
[/TABLE]
Source: https://freestatistics.org/blog/index.php?pk=303460&T=1

Globally Unique Identifier (entire table): ba.freestatistics.org/blog/index.php?pk=303460&T=1

As an alternative you can also use a QR Code:  

The GUIDs for individual cells are displayed in the table below:

ARIMA Parameter Estimation and Backward Selection
Iterationar1ar2ar3ma1sar1sar2sma1
Estimates ( 1 )-0.40130.86970.38040.81460.90610.0884-0.9411
(p-val)(0.5368 )(1e-04 )(0.3802 )(0.1859 )(3e-04 )(0.6763 )(0.0206 )
Estimates ( 2 )-0.35660.86170.35220.77461.28120-1.003
(p-val)(0.5131 )(0 )(0.3361 )(0.125 )(0 )(NA )(0.0824 )
Estimates ( 3 )00.72330.15420.41560.99080-0.9305
(p-val)(NA )(0 )(0.1136 )(0.0079 )(0 )(NA )(0 )
Estimates ( 4 )00.776400.49610.99130-0.9174
(p-val)(NA )(0 )(NA )(0.0016 )(0 )(NA )(0 )
Estimates ( 5 )NANANANANANANA
(p-val)(NA )(NA )(NA )(NA )(NA )(NA )(NA )
Estimates ( 6 )NANANANANANANA
(p-val)(NA )(NA )(NA )(NA )(NA )(NA )(NA )
Estimates ( 7 )NANANANANANANA
(p-val)(NA )(NA )(NA )(NA )(NA )(NA )(NA )
Estimates ( 8 )NANANANANANANA
(p-val)(NA )(NA )(NA )(NA )(NA )(NA )(NA )
Estimates ( 9 )NANANANANANANA
(p-val)(NA )(NA )(NA )(NA )(NA )(NA )(NA )
Estimates ( 10 )NANANANANANANA
(p-val)(NA )(NA )(NA )(NA )(NA )(NA )(NA )
Estimates ( 11 )NANANANANANANA
(p-val)(NA )(NA )(NA )(NA )(NA )(NA )(NA )
Estimates ( 12 )NANANANANANANA
(p-val)(NA )(NA )(NA )(NA )(NA )(NA )(NA )
Estimates ( 13 )NANANANANANANA
(p-val)(NA )(NA )(NA )(NA )(NA )(NA )(NA )


Estimated ARIMA Residuals
Value
1793.7771044162
324.777728376242
-956.968026054199
343.648838835995
569.958732977003
1298.42263035414
-94.4487309317651
-195.338993596058
-1732.73359717621
1929.03678813745
-399.91855146491
1414.98970597393
-578.619458325659
3389.54737474825
-1146.97323652735
-1106.94704027983
141.307628428678
-898.399210834741
41.8023828285214
1781.91915107656
190.669867614506
503.388682563366
-814.174575319895
-470.082893987363
2591.20716042762
-1399.66302529016
-972.664385967364
-633.016955529529
891.673391680601
764.766637403655
-1172.84332064853
697.531831193081
1771.08651269512
3477.51906083063
-2150.24613796729
-2572.48013211057
-583.389572511305
-624.674327425028
1313.80973853635
-576.140259562281
-312.437760304355
2479.59902595546
1837.78055999075
-2097.94043682099
-23.3787548098299
-749.911645333895
-1444.84995122261
-81.7940545237297
534.699554701697
-58.7565328834635
-198.474832654261

\begin{tabular}{lllllllll}
\hline
Estimated ARIMA Residuals \tabularnewline
Value \tabularnewline
 \tabularnewline
1793.7771044162 \tabularnewline
324.777728376242 \tabularnewline
-956.968026054199 \tabularnewline
343.648838835995 \tabularnewline
569.958732977003 \tabularnewline
1298.42263035414 \tabularnewline
-94.4487309317651 \tabularnewline
-195.338993596058 \tabularnewline
-1732.73359717621 \tabularnewline
1929.03678813745 \tabularnewline
-399.91855146491 \tabularnewline
1414.98970597393 \tabularnewline
-578.619458325659 \tabularnewline
3389.54737474825 \tabularnewline
-1146.97323652735 \tabularnewline
-1106.94704027983 \tabularnewline
141.307628428678 \tabularnewline
-898.399210834741 \tabularnewline
41.8023828285214 \tabularnewline
1781.91915107656 \tabularnewline
190.669867614506 \tabularnewline
503.388682563366 \tabularnewline
-814.174575319895 \tabularnewline
-470.082893987363 \tabularnewline
2591.20716042762 \tabularnewline
-1399.66302529016 \tabularnewline
-972.664385967364 \tabularnewline
-633.016955529529 \tabularnewline
891.673391680601 \tabularnewline
764.766637403655 \tabularnewline
-1172.84332064853 \tabularnewline
697.531831193081 \tabularnewline
1771.08651269512 \tabularnewline
3477.51906083063 \tabularnewline
-2150.24613796729 \tabularnewline
-2572.48013211057 \tabularnewline
-583.389572511305 \tabularnewline
-624.674327425028 \tabularnewline
1313.80973853635 \tabularnewline
-576.140259562281 \tabularnewline
-312.437760304355 \tabularnewline
2479.59902595546 \tabularnewline
1837.78055999075 \tabularnewline
-2097.94043682099 \tabularnewline
-23.3787548098299 \tabularnewline
-749.911645333895 \tabularnewline
-1444.84995122261 \tabularnewline
-81.7940545237297 \tabularnewline
534.699554701697 \tabularnewline
-58.7565328834635 \tabularnewline
-198.474832654261 \tabularnewline
\hline
\end{tabular}
%Source: https://freestatistics.org/blog/index.php?pk=303460&T=2

[TABLE]
[ROW][C]Estimated ARIMA Residuals[/C][/ROW]
[ROW][C]Value[/C][/ROW]
[ROW][C][/C][/ROW]
[ROW][C]1793.7771044162[/C][/ROW]
[ROW][C]324.777728376242[/C][/ROW]
[ROW][C]-956.968026054199[/C][/ROW]
[ROW][C]343.648838835995[/C][/ROW]
[ROW][C]569.958732977003[/C][/ROW]
[ROW][C]1298.42263035414[/C][/ROW]
[ROW][C]-94.4487309317651[/C][/ROW]
[ROW][C]-195.338993596058[/C][/ROW]
[ROW][C]-1732.73359717621[/C][/ROW]
[ROW][C]1929.03678813745[/C][/ROW]
[ROW][C]-399.91855146491[/C][/ROW]
[ROW][C]1414.98970597393[/C][/ROW]
[ROW][C]-578.619458325659[/C][/ROW]
[ROW][C]3389.54737474825[/C][/ROW]
[ROW][C]-1146.97323652735[/C][/ROW]
[ROW][C]-1106.94704027983[/C][/ROW]
[ROW][C]141.307628428678[/C][/ROW]
[ROW][C]-898.399210834741[/C][/ROW]
[ROW][C]41.8023828285214[/C][/ROW]
[ROW][C]1781.91915107656[/C][/ROW]
[ROW][C]190.669867614506[/C][/ROW]
[ROW][C]503.388682563366[/C][/ROW]
[ROW][C]-814.174575319895[/C][/ROW]
[ROW][C]-470.082893987363[/C][/ROW]
[ROW][C]2591.20716042762[/C][/ROW]
[ROW][C]-1399.66302529016[/C][/ROW]
[ROW][C]-972.664385967364[/C][/ROW]
[ROW][C]-633.016955529529[/C][/ROW]
[ROW][C]891.673391680601[/C][/ROW]
[ROW][C]764.766637403655[/C][/ROW]
[ROW][C]-1172.84332064853[/C][/ROW]
[ROW][C]697.531831193081[/C][/ROW]
[ROW][C]1771.08651269512[/C][/ROW]
[ROW][C]3477.51906083063[/C][/ROW]
[ROW][C]-2150.24613796729[/C][/ROW]
[ROW][C]-2572.48013211057[/C][/ROW]
[ROW][C]-583.389572511305[/C][/ROW]
[ROW][C]-624.674327425028[/C][/ROW]
[ROW][C]1313.80973853635[/C][/ROW]
[ROW][C]-576.140259562281[/C][/ROW]
[ROW][C]-312.437760304355[/C][/ROW]
[ROW][C]2479.59902595546[/C][/ROW]
[ROW][C]1837.78055999075[/C][/ROW]
[ROW][C]-2097.94043682099[/C][/ROW]
[ROW][C]-23.3787548098299[/C][/ROW]
[ROW][C]-749.911645333895[/C][/ROW]
[ROW][C]-1444.84995122261[/C][/ROW]
[ROW][C]-81.7940545237297[/C][/ROW]
[ROW][C]534.699554701697[/C][/ROW]
[ROW][C]-58.7565328834635[/C][/ROW]
[ROW][C]-198.474832654261[/C][/ROW]
[/TABLE]
Source: https://freestatistics.org/blog/index.php?pk=303460&T=2

Globally Unique Identifier (entire table): ba.freestatistics.org/blog/index.php?pk=303460&T=2

As an alternative you can also use a QR Code:  

The GUIDs for individual cells are displayed in the table below:

Estimated ARIMA Residuals
Value
1793.7771044162
324.777728376242
-956.968026054199
343.648838835995
569.958732977003
1298.42263035414
-94.4487309317651
-195.338993596058
-1732.73359717621
1929.03678813745
-399.91855146491
1414.98970597393
-578.619458325659
3389.54737474825
-1146.97323652735
-1106.94704027983
141.307628428678
-898.399210834741
41.8023828285214
1781.91915107656
190.669867614506
503.388682563366
-814.174575319895
-470.082893987363
2591.20716042762
-1399.66302529016
-972.664385967364
-633.016955529529
891.673391680601
764.766637403655
-1172.84332064853
697.531831193081
1771.08651269512
3477.51906083063
-2150.24613796729
-2572.48013211057
-583.389572511305
-624.674327425028
1313.80973853635
-576.140259562281
-312.437760304355
2479.59902595546
1837.78055999075
-2097.94043682099
-23.3787548098299
-749.911645333895
-1444.84995122261
-81.7940545237297
534.699554701697
-58.7565328834635
-198.474832654261


Parameters (Session):
par1 = 2 ; par2 = 3 ; par3 = 1 ; par4 = TRUE ;
Parameters (R input):
par1 = FALSE ; par2 = 1 ; par3 = 0 ; par4 = 0 ; par5 = 12 ; par6 = 3 ; par7 = 1 ; par8 = 2 ; par9 = 1 ;
R code (references can be found in the software module):
library(lattice)
if (par1 == 'TRUE') par1 <- TRUE
if (par1 == 'FALSE') par1 <- FALSE
par2 <- as.numeric(par2) #Box-Cox lambda transformation parameter
par3 <- as.numeric(par3) #degree of non-seasonal differencing
par4 <- as.numeric(par4) #degree of seasonal differencing
par5 <- as.numeric(par5) #seasonal period
par6 <- as.numeric(par6) #degree (p) of the non-seasonal AR(p) polynomial
par7 <- as.numeric(par7) #degree (q) of the non-seasonal MA(q) polynomial
par8 <- as.numeric(par8) #degree (P) of the seasonal AR(P) polynomial
par9 <- as.numeric(par9) #degree (Q) of the seasonal MA(Q) polynomial
armaGR <- function(arima.out, names, n){
try1 <- arima.out$coef
try2 <- sqrt(diag(arima.out$var.coef))
try.data.frame <- data.frame(matrix(NA,ncol=4,nrow=length(names)))
dimnames(try.data.frame) <- list(names,c('coef','std','tstat','pv'))
try.data.frame[,1] <- try1
for(i in 1:length(try2)) try.data.frame[which(rownames(try.data.frame)==names(try2)[i]),2] <- try2[i]
try.data.frame[,3] <- try.data.frame[,1] / try.data.frame[,2]
try.data.frame[,4] <- round((1-pt(abs(try.data.frame[,3]),df=n-(length(try2)+1)))*2,5)
vector <- rep(NA,length(names))
vector[is.na(try.data.frame[,4])] <- 0
maxi <- which.max(try.data.frame[,4])
continue <- max(try.data.frame[,4],na.rm=TRUE) > .05
vector[maxi] <- 0
list(summary=try.data.frame,next.vector=vector,continue=continue)
}
arimaSelect <- function(series, order=c(13,0,0), seasonal=list(order=c(2,0,0),period=12), include.mean=F){
nrc <- order[1]+order[3]+seasonal$order[1]+seasonal$order[3]
coeff <- matrix(NA, nrow=nrc*2, ncol=nrc)
pval <- matrix(NA, nrow=nrc*2, ncol=nrc)
mylist <- rep(list(NULL), nrc)
names <- NULL
if(order[1] > 0) names <- paste('ar',1:order[1],sep='')
if(order[3] > 0) names <- c( names , paste('ma',1:order[3],sep='') )
if(seasonal$order[1] > 0) names <- c(names, paste('sar',1:seasonal$order[1],sep=''))
if(seasonal$order[3] > 0) names <- c(names, paste('sma',1:seasonal$order[3],sep=''))
arima.out <- arima(series, order=order, seasonal=seasonal, include.mean=include.mean, method='ML')
mylist[[1]] <- arima.out
last.arma <- armaGR(arima.out, names, length(series))
mystop <- FALSE
i <- 1
coeff[i,] <- last.arma[[1]][,1]
pval [i,] <- last.arma[[1]][,4]
i <- 2
aic <- arima.out$aic
while(!mystop){
mylist[[i]] <- arima.out
arima.out <- arima(series, order=order, seasonal=seasonal, include.mean=include.mean, method='ML', fixed=last.arma$next.vector)
aic <- c(aic, arima.out$aic)
last.arma <- armaGR(arima.out, names, length(series))
mystop <- !last.arma$continue
coeff[i,] <- last.arma[[1]][,1]
pval [i,] <- last.arma[[1]][,4]
i <- i+1
}
list(coeff, pval, mylist, aic=aic)
}
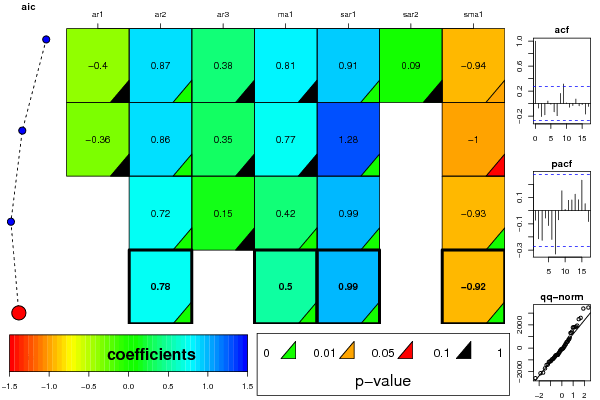
arimaSelectplot <- function(arimaSelect.out,noms,choix){
noms <- names(arimaSelect.out[[3]][[1]]$coef)
coeff <- arimaSelect.out[[1]]
k <- min(which(is.na(coeff[,1])))-1
coeff <- coeff[1:k,]
pval <- arimaSelect.out[[2]][1:k,]
aic <- arimaSelect.out$aic[1:k]
coeff[coeff==0] <- NA
n <- ncol(coeff)
if(missing(choix)) choix <- k
layout(matrix(c(1,1,1,2,
3,3,3,2,
3,3,3,4,
5,6,7,7),nr=4),
widths=c(10,35,45,15),
heights=c(30,30,15,15))
couleurs <- rainbow(75)[1:50]#(50)
ticks <- pretty(coeff)
par(mar=c(1,1,3,1))
plot(aic,k:1-.5,type='o',pch=21,bg='blue',cex=2,axes=F,lty=2,xpd=NA)
points(aic[choix],k-choix+.5,pch=21,cex=4,bg=2,xpd=NA)
title('aic',line=2)
par(mar=c(3,0,0,0))
plot(0,axes=F,xlab='',ylab='',xlim=range(ticks),ylim=c(.1,1))
rect(xleft = min(ticks) + (0:49)/50*(max(ticks)-min(ticks)),
xright = min(ticks) + (1:50)/50*(max(ticks)-min(ticks)),
ytop = rep(1,50),
ybottom= rep(0,50),col=couleurs,border=NA)
axis(1,ticks)
rect(xleft=min(ticks),xright=max(ticks),ytop=1,ybottom=0)
text(mean(coeff,na.rm=T),.5,'coefficients',cex=2,font=2)
par(mar=c(1,1,3,1))
image(1:n,1:k,t(coeff[k:1,]),axes=F,col=couleurs,zlim=range(ticks))
for(i in 1:n) for(j in 1:k) if(!is.na(coeff[j,i])) {
if(pval[j,i]<.01) symb = 'green'
else if( (pval[j,i]<.05) & (pval[j,i]>=.01)) symb = 'orange'
else if( (pval[j,i]<.1) & (pval[j,i]>=.05)) symb = 'red'
else symb = 'black'
polygon(c(i+.5 ,i+.2 ,i+.5 ,i+.5),
c(k-j+0.5,k-j+0.5,k-j+0.8,k-j+0.5),
col=symb)
if(j==choix) {
rect(xleft=i-.5,
xright=i+.5,
ybottom=k-j+1.5,
ytop=k-j+.5,
lwd=4)
text(i,
k-j+1,
round(coeff[j,i],2),
cex=1.2,
font=2)
}
else{
rect(xleft=i-.5,xright=i+.5,ybottom=k-j+1.5,ytop=k-j+.5)
text(i,k-j+1,round(coeff[j,i],2),cex=1.2,font=1)
}
}
axis(3,1:n,noms)
par(mar=c(0.5,0,0,0.5))
plot(0,axes=F,xlab='',ylab='',type='n',xlim=c(0,8),ylim=c(-.2,.8))
cols <- c('green','orange','red','black')
niv <- c('0','0.01','0.05','0.1')
for(i in 0:3){
polygon(c(1+2*i ,1+2*i ,1+2*i-.5 ,1+2*i),
c(.4 ,.7 , .4 , .4),
col=cols[i+1])
text(2*i,0.5,niv[i+1],cex=1.5)
}
text(8,.5,1,cex=1.5)
text(4,0,'p-value',cex=2)
box()
residus <- arimaSelect.out[[3]][[choix]]$res
par(mar=c(1,2,4,1))
acf(residus,main='')
title('acf',line=.5)
par(mar=c(1,2,4,1))
pacf(residus,main='')
title('pacf',line=.5)
par(mar=c(2,2,4,1))
qqnorm(residus,main='')
title('qq-norm',line=.5)
qqline(residus)
residus
}
if (par2 == 0) x <- log(x)
if (par2 != 0) x <- x^par2
(selection <- arimaSelect(x, order=c(par6,par3,par7), seasonal=list(order=c(par8,par4,par9), period=par5)))
bitmap(file='test1.png')
resid <- arimaSelectplot(selection)
dev.off()
resid
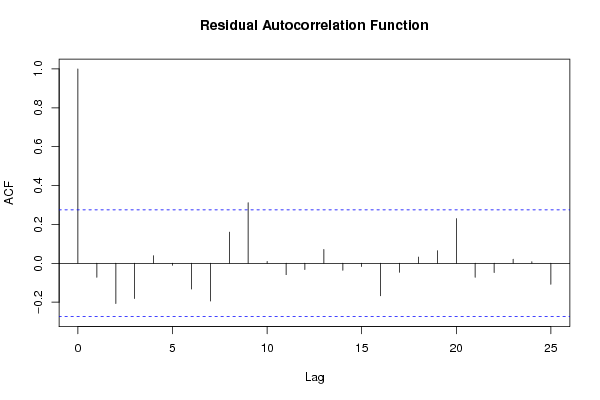
bitmap(file='test2.png')
acf(resid,length(resid)/2, main='Residual Autocorrelation Function')
dev.off()
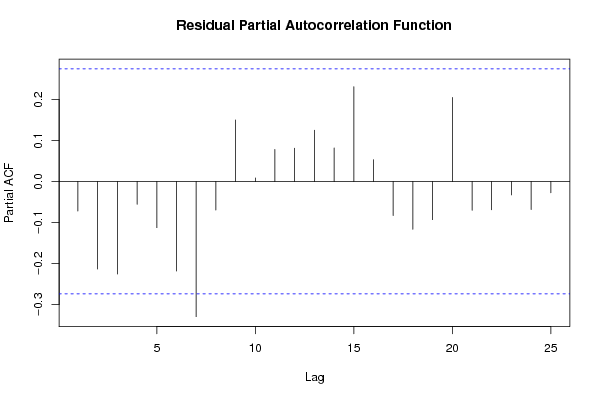
bitmap(file='test3.png')
pacf(resid,length(resid)/2, main='Residual Partial Autocorrelation Function')
dev.off()
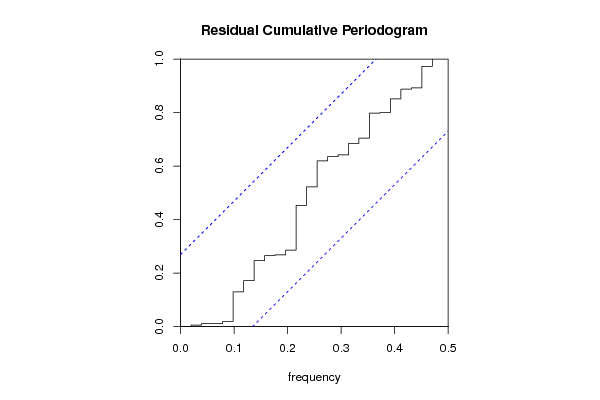
bitmap(file='test4.png')
cpgram(resid, main='Residual Cumulative Periodogram')
dev.off()
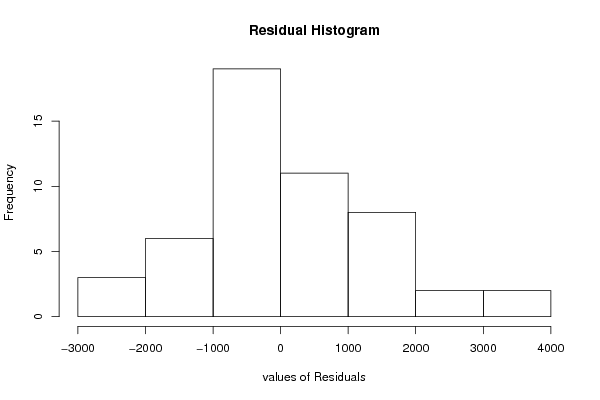
bitmap(file='test5.png')
hist(resid, main='Residual Histogram', xlab='values of Residuals')
dev.off()
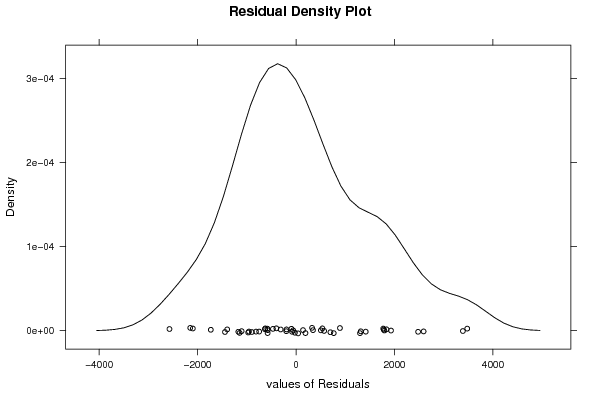
bitmap(file='test6.png')
densityplot(~resid,col='black',main='Residual Density Plot', xlab='values of Residuals')
dev.off()
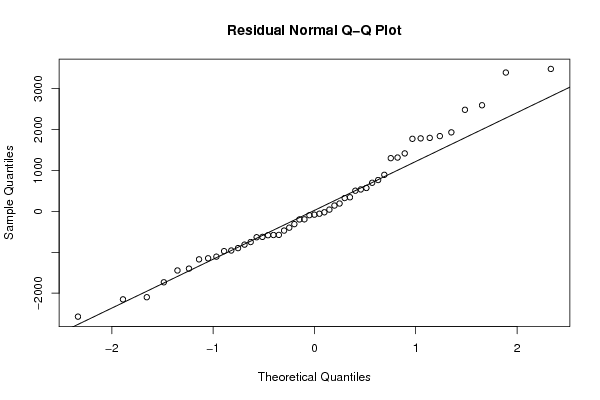
bitmap(file='test7.png')
qqnorm(resid, main='Residual Normal Q-Q Plot')
qqline(resid)
dev.off()
ncols <- length(selection[[1]][1,])
nrows <- length(selection[[2]][,1])-1
load(file='createtable')
a<-table.start()
a<-table.row.start(a)
a<-table.element(a,'ARIMA Parameter Estimation and Backward Selection', ncols+1,TRUE)
a<-table.row.end(a)
a<-table.row.start(a)
a<-table.element(a,'Iteration', header=TRUE)
for (i in 1:ncols) {
a<-table.element(a,names(selection[[3]][[1]]$coef)[i],header=TRUE)
}
a<-table.row.end(a)
for (j in 1:nrows) {
a<-table.row.start(a)
mydum <- 'Estimates ('
mydum <- paste(mydum,j)
mydum <- paste(mydum,')')
a<-table.element(a,mydum, header=TRUE)
for (i in 1:ncols) {
a<-table.element(a,round(selection[[1]][j,i],4))
}
a<-table.row.end(a)
a<-table.row.start(a)
a<-table.element(a,'(p-val)', header=TRUE)
for (i in 1:ncols) {
mydum <- '('
mydum <- paste(mydum,round(selection[[2]][j,i],4),sep='')
mydum <- paste(mydum,')')
a<-table.element(a,mydum)
}
a<-table.row.end(a)
}
a<-table.end(a)
table.save(a,file='mytable.tab')
a<-table.start()
a<-table.row.start(a)
a<-table.element(a,'Estimated ARIMA Residuals', 1,TRUE)
a<-table.row.end(a)
a<-table.row.start(a)
a<-table.element(a,'Value', 1,TRUE)
a<-table.row.end(a)
for (i in (par4*par5+par3):length(resid)) {
a<-table.row.start(a)
a<-table.element(a,resid[i])
a<-table.row.end(a)
}
a<-table.end(a)
table.save(a,file='mytable1.tab')