Free Statistics

of Irreproducible Research!

Author's title

Author*The author of this computation has been verified*
R Software Modulerwasp_arimaforecasting.wasp
Title produced by softwareARIMA Forecasting
Date of computationSun, 22 Jan 2017 14:44:50 +0100
Cite this page as followsStatistical Computations at FreeStatistics.org, Office for Research Development and Education, URL https://freestatistics.org/blog/index.php?v=date/2017/Jan/22/t14850926973svmng7bbe7q532.htm/, Retrieved Tue, 14 May 2024 06:07:01 +0000
Statistical Computations at FreeStatistics.org, Office for Research Development and Education, URL https://freestatistics.org/blog/index.php?pk=303424, Retrieved Tue, 14 May 2024 06:07:01 +0000
QR Codes:

Original text written by user:
IsPrivate?No (this computation is public)
User-defined keywords
Estimated Impact70
Family? (F = Feedback message, R = changed R code, M = changed R Module, P = changed Parameters, D = changed Data)
-       [ARIMA Forecasting] [dddd] [2017-01-22 13:44:50] [f0fcaf0884a2ab8e55345d70fdb8db2d] [Current]
Feedback Forum

Post a new message
Dataseries X:
3070
3022
3569
3613
3329
3720
3347
3274
3493
3633
4313
5168
2984
2901
3629
3374
3408
3868
3198
3383
3377
3436
4315
5047
3067
3089
3447
3288
3432
3663
3158
3344
3277
3798
4180
4932
2863
3027
3187
3251
3416
3384
3250
3520
4940
2950
3308
4693
2570
2724
3110
3068
3108
3393
3271
3093
3198
3323
3707
4889
2688
2812
3138
3052
3052
3345
3026
2905
3114
3110
3759
4822
2514
2657
3067
3036
3016
3277
2809
2944
3010
3128
3868
4496
2501
2664
3042
2847
3069
3173
2790
2994
2860
3105
3751
4349
2560
2630
2882
2865
3081
3183
2981
2939
2727
3110
3674
4812
2473
2196
2606
2836
2879
2877
2910
2825
2680
3070
3317
3963
2355


Summary of computational transaction
Raw Input view raw input (R code)
Raw Outputview raw output of R engine
Computing time1 seconds
R ServerBig Analytics Cloud Computing Center

\begin{tabular}{lllllllll}
\hline
Summary of computational transaction \tabularnewline
Raw Input view raw input (R code)  \tabularnewline
Raw Outputview raw output of R engine  \tabularnewline
Computing time1 seconds \tabularnewline
R ServerBig Analytics Cloud Computing Center \tabularnewline
\hline
\end{tabular}
%Source: https://freestatistics.org/blog/index.php?pk=303424&T=0

[TABLE]
[ROW]
Summary of computational transaction[/C][/ROW] [ROW]Raw Input[/C] view raw input (R code) [/C][/ROW] [ROW]Raw Output[/C]view raw output of R engine [/C][/ROW] [ROW]Computing time[/C]1 seconds[/C][/ROW] [ROW]R Server[/C]Big Analytics Cloud Computing Center[/C][/ROW] [/TABLE] Source: https://freestatistics.org/blog/index.php?pk=303424&T=0

Globally Unique Identifier (entire table): ba.freestatistics.org/blog/index.php?pk=303424&T=0

As an alternative you can also use a QR Code:  

The GUIDs for individual cells are displayed in the table below:

Summary of computational transaction
Raw Input view raw input (R code)
Raw Outputview raw output of R engine
Computing time1 seconds
R ServerBig Analytics Cloud Computing Center


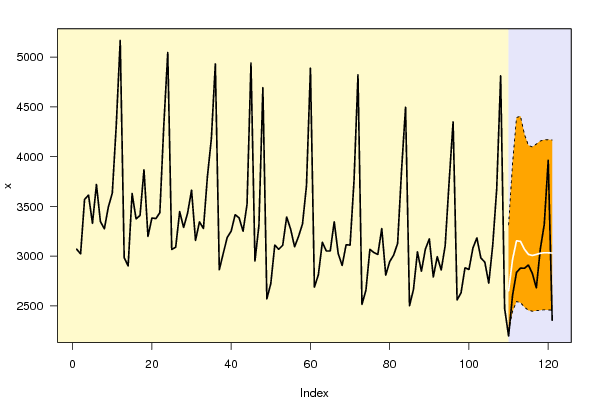
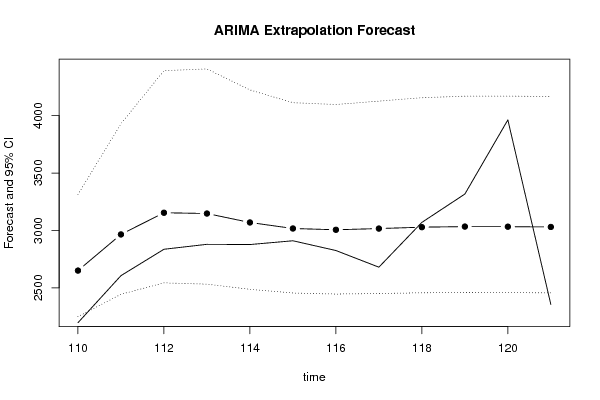
Univariate ARIMA Extrapolation Forecast
timeY[t]F[t]95% LB95% UBp-value(H0: Y[t] = F[t])P(F[t]>Y[t-1])P(F[t]>Y[t-s])P(F[t]>Y[109])
1084812-------
1092473-------
11021962650.21472248.86753313.48820.08980.69970.69970.6997
11126062965.21582443.85323929.170.23260.94110.94110.8415
11228363154.13532543.17724392.14270.30720.80720.80720.8596
11328793147.29842531.86064406.89480.33820.68590.68590.853
11428773069.36072487.14154224.19580.3720.62670.62670.8443
11529103016.94742454.79494112.63770.42410.59880.59880.8347
11628253005.71432445.72984097.03840.37280.56820.56820.8307
11726803016.2822450.48984126.22280.27630.63220.63220.8313
11830703028.40212456.87544156.2990.47120.72760.72760.8328
11933173033.47592459.35474169.70310.31240.47490.47490.8332
12039633032.71322458.39454170.00480.05440.31210.31210.8326
12123553030.26682456.34084166.91970.12210.05390.05390.8317

\begin{tabular}{lllllllll}
\hline
Univariate ARIMA Extrapolation Forecast \tabularnewline
time & Y[t] & F[t] & 95% LB & 95% UB & p-value(H0: Y[t] = F[t]) & P(F[t]>Y[t-1]) & P(F[t]>Y[t-s]) & P(F[t]>Y[109]) \tabularnewline
108 & 4812 & - & - & - & - & - & - & - \tabularnewline
109 & 2473 & - & - & - & - & - & - & - \tabularnewline
110 & 2196 & 2650.2147 & 2248.8675 & 3313.4882 & 0.0898 & 0.6997 & 0.6997 & 0.6997 \tabularnewline
111 & 2606 & 2965.2158 & 2443.8532 & 3929.17 & 0.2326 & 0.9411 & 0.9411 & 0.8415 \tabularnewline
112 & 2836 & 3154.1353 & 2543.1772 & 4392.1427 & 0.3072 & 0.8072 & 0.8072 & 0.8596 \tabularnewline
113 & 2879 & 3147.2984 & 2531.8606 & 4406.8948 & 0.3382 & 0.6859 & 0.6859 & 0.853 \tabularnewline
114 & 2877 & 3069.3607 & 2487.1415 & 4224.1958 & 0.372 & 0.6267 & 0.6267 & 0.8443 \tabularnewline
115 & 2910 & 3016.9474 & 2454.7949 & 4112.6377 & 0.4241 & 0.5988 & 0.5988 & 0.8347 \tabularnewline
116 & 2825 & 3005.7143 & 2445.7298 & 4097.0384 & 0.3728 & 0.5682 & 0.5682 & 0.8307 \tabularnewline
117 & 2680 & 3016.282 & 2450.4898 & 4126.2228 & 0.2763 & 0.6322 & 0.6322 & 0.8313 \tabularnewline
118 & 3070 & 3028.4021 & 2456.8754 & 4156.299 & 0.4712 & 0.7276 & 0.7276 & 0.8328 \tabularnewline
119 & 3317 & 3033.4759 & 2459.3547 & 4169.7031 & 0.3124 & 0.4749 & 0.4749 & 0.8332 \tabularnewline
120 & 3963 & 3032.7132 & 2458.3945 & 4170.0048 & 0.0544 & 0.3121 & 0.3121 & 0.8326 \tabularnewline
121 & 2355 & 3030.2668 & 2456.3408 & 4166.9197 & 0.1221 & 0.0539 & 0.0539 & 0.8317 \tabularnewline
\hline
\end{tabular}
%Source: https://freestatistics.org/blog/index.php?pk=303424&T=1

[TABLE]
[ROW][C]Univariate ARIMA Extrapolation Forecast[/C][/ROW]
[ROW][C]time[/C][C]Y[t][/C][C]F[t][/C][C]95% LB[/C][C]95% UB[/C][C]p-value(H0: Y[t] = F[t])[/C][C]P(F[t]>Y[t-1])[/C][C]P(F[t]>Y[t-s])[/C][C]P(F[t]>Y[109])[/C][/ROW]
[ROW][C]108[/C][C]4812[/C][C]-[/C][C]-[/C][C]-[/C][C]-[/C][C]-[/C][C]-[/C][C]-[/C][/ROW]
[ROW][C]109[/C][C]2473[/C][C]-[/C][C]-[/C][C]-[/C][C]-[/C][C]-[/C][C]-[/C][C]-[/C][/ROW]
[ROW][C]110[/C][C]2196[/C][C]2650.2147[/C][C]2248.8675[/C][C]3313.4882[/C][C]0.0898[/C][C]0.6997[/C][C]0.6997[/C][C]0.6997[/C][/ROW]
[ROW][C]111[/C][C]2606[/C][C]2965.2158[/C][C]2443.8532[/C][C]3929.17[/C][C]0.2326[/C][C]0.9411[/C][C]0.9411[/C][C]0.8415[/C][/ROW]
[ROW][C]112[/C][C]2836[/C][C]3154.1353[/C][C]2543.1772[/C][C]4392.1427[/C][C]0.3072[/C][C]0.8072[/C][C]0.8072[/C][C]0.8596[/C][/ROW]
[ROW][C]113[/C][C]2879[/C][C]3147.2984[/C][C]2531.8606[/C][C]4406.8948[/C][C]0.3382[/C][C]0.6859[/C][C]0.6859[/C][C]0.853[/C][/ROW]
[ROW][C]114[/C][C]2877[/C][C]3069.3607[/C][C]2487.1415[/C][C]4224.1958[/C][C]0.372[/C][C]0.6267[/C][C]0.6267[/C][C]0.8443[/C][/ROW]
[ROW][C]115[/C][C]2910[/C][C]3016.9474[/C][C]2454.7949[/C][C]4112.6377[/C][C]0.4241[/C][C]0.5988[/C][C]0.5988[/C][C]0.8347[/C][/ROW]
[ROW][C]116[/C][C]2825[/C][C]3005.7143[/C][C]2445.7298[/C][C]4097.0384[/C][C]0.3728[/C][C]0.5682[/C][C]0.5682[/C][C]0.8307[/C][/ROW]
[ROW][C]117[/C][C]2680[/C][C]3016.282[/C][C]2450.4898[/C][C]4126.2228[/C][C]0.2763[/C][C]0.6322[/C][C]0.6322[/C][C]0.8313[/C][/ROW]
[ROW][C]118[/C][C]3070[/C][C]3028.4021[/C][C]2456.8754[/C][C]4156.299[/C][C]0.4712[/C][C]0.7276[/C][C]0.7276[/C][C]0.8328[/C][/ROW]
[ROW][C]119[/C][C]3317[/C][C]3033.4759[/C][C]2459.3547[/C][C]4169.7031[/C][C]0.3124[/C][C]0.4749[/C][C]0.4749[/C][C]0.8332[/C][/ROW]
[ROW][C]120[/C][C]3963[/C][C]3032.7132[/C][C]2458.3945[/C][C]4170.0048[/C][C]0.0544[/C][C]0.3121[/C][C]0.3121[/C][C]0.8326[/C][/ROW]
[ROW][C]121[/C][C]2355[/C][C]3030.2668[/C][C]2456.3408[/C][C]4166.9197[/C][C]0.1221[/C][C]0.0539[/C][C]0.0539[/C][C]0.8317[/C][/ROW]
[/TABLE]
Source: https://freestatistics.org/blog/index.php?pk=303424&T=1

Globally Unique Identifier (entire table): ba.freestatistics.org/blog/index.php?pk=303424&T=1

As an alternative you can also use a QR Code:  

The GUIDs for individual cells are displayed in the table below:

Univariate ARIMA Extrapolation Forecast
timeY[t]F[t]95% LB95% UBp-value(H0: Y[t] = F[t])P(F[t]>Y[t-1])P(F[t]>Y[t-s])P(F[t]>Y[109])
1084812-------
1092473-------
11021962650.21472248.86753313.48820.08980.69970.69970.6997
11126062965.21582443.85323929.170.23260.94110.94110.8415
11228363154.13532543.17724392.14270.30720.80720.80720.8596
11328793147.29842531.86064406.89480.33820.68590.68590.853
11428773069.36072487.14154224.19580.3720.62670.62670.8443
11529103016.94742454.79494112.63770.42410.59880.59880.8347
11628253005.71432445.72984097.03840.37280.56820.56820.8307
11726803016.2822450.48984126.22280.27630.63220.63220.8313
11830703028.40212456.87544156.2990.47120.72760.72760.8328
11933173033.47592459.35474169.70310.31240.47490.47490.8332
12039633032.71322458.39454170.00480.05440.31210.31210.8326
12123553030.26682456.34084166.91970.12210.05390.05390.8317


Univariate ARIMA Extrapolation Forecast Performance
time% S.E.PEMAPEsMAPESq.EMSERMSEScaledEMASE
1100.1277-0.20680.20680.1875206311.035700-1.30151.3015
1110.1659-0.13780.17230.1582129036.0196167673.5277409.4796-1.02931.1654
1120.2003-0.11220.15230.1409101210.0673145519.0409381.4696-0.91161.0808
1130.2042-0.09320.13750.127971984.0408127135.2908356.5604-0.76881.0028
1140.192-0.06690.12340.115337002.6365109108.76330.3162-0.55120.9124
1150.1853-0.03680.10890.102111437.75692830.2593304.6806-0.30640.8114
1160.1852-0.0640.10250.096332657.662284234.174290.2312-0.51780.7695
1170.1877-0.12550.10540.0991113085.584187840.6003296.3791-0.96360.7938
1180.190.01350.09520.08961730.38978272.799279.77280.11920.7188
1190.19110.08550.09420.089580385.9478484.1131280.15020.81240.7282
1200.19130.23470.1070.1056865433.5293150024.9691387.33062.66560.9043
1210.1914-0.28670.1220.1177455985.2119175521.656418.953-1.93490.9902

\begin{tabular}{lllllllll}
\hline
Univariate ARIMA Extrapolation Forecast Performance \tabularnewline
time & % S.E. & PE & MAPE & sMAPE & Sq.E & MSE & RMSE & ScaledE & MASE \tabularnewline
110 & 0.1277 & -0.2068 & 0.2068 & 0.1875 & 206311.0357 & 0 & 0 & -1.3015 & 1.3015 \tabularnewline
111 & 0.1659 & -0.1378 & 0.1723 & 0.1582 & 129036.0196 & 167673.5277 & 409.4796 & -1.0293 & 1.1654 \tabularnewline
112 & 0.2003 & -0.1122 & 0.1523 & 0.1409 & 101210.0673 & 145519.0409 & 381.4696 & -0.9116 & 1.0808 \tabularnewline
113 & 0.2042 & -0.0932 & 0.1375 & 0.1279 & 71984.0408 & 127135.2908 & 356.5604 & -0.7688 & 1.0028 \tabularnewline
114 & 0.192 & -0.0669 & 0.1234 & 0.1153 & 37002.6365 & 109108.76 & 330.3162 & -0.5512 & 0.9124 \tabularnewline
115 & 0.1853 & -0.0368 & 0.1089 & 0.1021 & 11437.756 & 92830.2593 & 304.6806 & -0.3064 & 0.8114 \tabularnewline
116 & 0.1852 & -0.064 & 0.1025 & 0.0963 & 32657.6622 & 84234.174 & 290.2312 & -0.5178 & 0.7695 \tabularnewline
117 & 0.1877 & -0.1255 & 0.1054 & 0.0991 & 113085.5841 & 87840.6003 & 296.3791 & -0.9636 & 0.7938 \tabularnewline
118 & 0.19 & 0.0135 & 0.0952 & 0.0896 & 1730.389 & 78272.799 & 279.7728 & 0.1192 & 0.7188 \tabularnewline
119 & 0.1911 & 0.0855 & 0.0942 & 0.0895 & 80385.94 & 78484.1131 & 280.1502 & 0.8124 & 0.7282 \tabularnewline
120 & 0.1913 & 0.2347 & 0.107 & 0.1056 & 865433.5293 & 150024.9691 & 387.3306 & 2.6656 & 0.9043 \tabularnewline
121 & 0.1914 & -0.2867 & 0.122 & 0.1177 & 455985.2119 & 175521.656 & 418.953 & -1.9349 & 0.9902 \tabularnewline
\hline
\end{tabular}
%Source: https://freestatistics.org/blog/index.php?pk=303424&T=2

[TABLE]
[ROW][C]Univariate ARIMA Extrapolation Forecast Performance[/C][/ROW]
[ROW][C]time[/C][C]% S.E.[/C][C]PE[/C][C]MAPE[/C][C]sMAPE[/C][C]Sq.E[/C][C]MSE[/C][C]RMSE[/C][C]ScaledE[/C][C]MASE[/C][/ROW]
[ROW][C]110[/C][C]0.1277[/C][C]-0.2068[/C][C]0.2068[/C][C]0.1875[/C][C]206311.0357[/C][C]0[/C][C]0[/C][C]-1.3015[/C][C]1.3015[/C][/ROW]
[ROW][C]111[/C][C]0.1659[/C][C]-0.1378[/C][C]0.1723[/C][C]0.1582[/C][C]129036.0196[/C][C]167673.5277[/C][C]409.4796[/C][C]-1.0293[/C][C]1.1654[/C][/ROW]
[ROW][C]112[/C][C]0.2003[/C][C]-0.1122[/C][C]0.1523[/C][C]0.1409[/C][C]101210.0673[/C][C]145519.0409[/C][C]381.4696[/C][C]-0.9116[/C][C]1.0808[/C][/ROW]
[ROW][C]113[/C][C]0.2042[/C][C]-0.0932[/C][C]0.1375[/C][C]0.1279[/C][C]71984.0408[/C][C]127135.2908[/C][C]356.5604[/C][C]-0.7688[/C][C]1.0028[/C][/ROW]
[ROW][C]114[/C][C]0.192[/C][C]-0.0669[/C][C]0.1234[/C][C]0.1153[/C][C]37002.6365[/C][C]109108.76[/C][C]330.3162[/C][C]-0.5512[/C][C]0.9124[/C][/ROW]
[ROW][C]115[/C][C]0.1853[/C][C]-0.0368[/C][C]0.1089[/C][C]0.1021[/C][C]11437.756[/C][C]92830.2593[/C][C]304.6806[/C][C]-0.3064[/C][C]0.8114[/C][/ROW]
[ROW][C]116[/C][C]0.1852[/C][C]-0.064[/C][C]0.1025[/C][C]0.0963[/C][C]32657.6622[/C][C]84234.174[/C][C]290.2312[/C][C]-0.5178[/C][C]0.7695[/C][/ROW]
[ROW][C]117[/C][C]0.1877[/C][C]-0.1255[/C][C]0.1054[/C][C]0.0991[/C][C]113085.5841[/C][C]87840.6003[/C][C]296.3791[/C][C]-0.9636[/C][C]0.7938[/C][/ROW]
[ROW][C]118[/C][C]0.19[/C][C]0.0135[/C][C]0.0952[/C][C]0.0896[/C][C]1730.389[/C][C]78272.799[/C][C]279.7728[/C][C]0.1192[/C][C]0.7188[/C][/ROW]
[ROW][C]119[/C][C]0.1911[/C][C]0.0855[/C][C]0.0942[/C][C]0.0895[/C][C]80385.94[/C][C]78484.1131[/C][C]280.1502[/C][C]0.8124[/C][C]0.7282[/C][/ROW]
[ROW][C]120[/C][C]0.1913[/C][C]0.2347[/C][C]0.107[/C][C]0.1056[/C][C]865433.5293[/C][C]150024.9691[/C][C]387.3306[/C][C]2.6656[/C][C]0.9043[/C][/ROW]
[ROW][C]121[/C][C]0.1914[/C][C]-0.2867[/C][C]0.122[/C][C]0.1177[/C][C]455985.2119[/C][C]175521.656[/C][C]418.953[/C][C]-1.9349[/C][C]0.9902[/C][/ROW]
[/TABLE]
Source: https://freestatistics.org/blog/index.php?pk=303424&T=2

Globally Unique Identifier (entire table): ba.freestatistics.org/blog/index.php?pk=303424&T=2

As an alternative you can also use a QR Code:  

The GUIDs for individual cells are displayed in the table below:

Univariate ARIMA Extrapolation Forecast Performance
time% S.E.PEMAPEsMAPESq.EMSERMSEScaledEMASE
1100.1277-0.20680.20680.1875206311.035700-1.30151.3015
1110.1659-0.13780.17230.1582129036.0196167673.5277409.4796-1.02931.1654
1120.2003-0.11220.15230.1409101210.0673145519.0409381.4696-0.91161.0808
1130.2042-0.09320.13750.127971984.0408127135.2908356.5604-0.76881.0028
1140.192-0.06690.12340.115337002.6365109108.76330.3162-0.55120.9124
1150.1853-0.03680.10890.102111437.75692830.2593304.6806-0.30640.8114
1160.1852-0.0640.10250.096332657.662284234.174290.2312-0.51780.7695
1170.1877-0.12550.10540.0991113085.584187840.6003296.3791-0.96360.7938
1180.190.01350.09520.08961730.38978272.799279.77280.11920.7188
1190.19110.08550.09420.089580385.9478484.1131280.15020.81240.7282
1200.19130.23470.1070.1056865433.5293150024.9691387.33062.66560.9043
1210.1914-0.28670.1220.1177455985.2119175521.656418.953-1.93490.9902


Parameters (Session):
par1 = 12 ; par2 = -1.6 ; par3 = 0 ; par4 = 1 ; par5 = 1 ; par6 = 0 ; par7 = 1 ; par8 = 2 ; par9 = 1 ; par10 = FALSE ;
Parameters (R input):
par1 = 12 ; par2 = -1.6 ; par3 = 0 ; par4 = 1 ; par5 = 1 ; par6 = 0 ; par7 = 1 ; par8 = 2 ; par9 = 1 ; par10 = FALSE ;
R code (references can be found in the software module):
par10 <- 'FALSE'
par9 <- '1'
par8 <- '2'
par7 <- '1'
par6 <- '0'
par5 <- '1'
par4 <- '1'
par3 <- '0'
par2 <- '-1.6'
par1 <- '0'
par1 <- as.numeric(par1) #cut off periods
par2 <- as.numeric(par2) #lambda
par3 <- as.numeric(par3) #degree of non-seasonal differencing
par4 <- as.numeric(par4) #degree of seasonal differencing
par5 <- as.numeric(par5) #seasonal period
par6 <- as.numeric(par6) #p
par7 <- as.numeric(par7) #q
par8 <- as.numeric(par8) #P
par9 <- as.numeric(par9) #Q
if (par10 == 'TRUE') par10 <- TRUE
if (par10 == 'FALSE') par10 <- FALSE
if (par2 == 0) x <- log(x)
if (par2 != 0) x <- x^par2
lx <- length(x)
first <- lx - 2*par1
nx <- lx - par1
nx1 <- nx + 1
fx <- lx - nx
if (fx < 1) {
fx <- par5*2
nx1 <- lx + fx - 1
first <- lx - 2*fx
}
first <- 1
if (fx < 3) fx <- round(lx/10,0)
(arima.out <- arima(x[1:nx], order=c(par6,par3,par7), seasonal=list(order=c(par8,par4,par9), period=par5), include.mean=par10, method='ML'))
(forecast <- predict(arima.out,fx))
(lb <- forecast$pred - 1.96 * forecast$se)
(ub <- forecast$pred + 1.96 * forecast$se)
if (par2 == 0) {
x <- exp(x)
forecast$pred <- exp(forecast$pred)
lb <- exp(lb)
ub <- exp(ub)
}
if (par2 != 0) {
x <- x^(1/par2)
forecast$pred <- forecast$pred^(1/par2)
lb <- lb^(1/par2)
ub <- ub^(1/par2)
}
if (par2 < 0) {
olb <- lb
lb <- ub
ub <- olb
}
(actandfor <- c(x[1:nx], forecast$pred))
(perc.se <- (ub-forecast$pred)/1.96/forecast$pred)
bitmap(file='test1.png')
opar <- par(mar=c(4,4,2,2),las=1)
ylim <- c( min(x[first:nx],lb), max(x[first:nx],ub))
plot(x,ylim=ylim,type='n',xlim=c(first,lx))
usr <- par('usr')
rect(usr[1],usr[3],nx+1,usr[4],border=NA,col='lemonchiffon')
rect(nx1,usr[3],usr[2],usr[4],border=NA,col='lavender')
abline(h= (-3:3)*2 , col ='gray', lty =3)
polygon( c(nx1:lx,lx:nx1), c(lb,rev(ub)), col = 'orange', lty=2,border=NA)
lines(nx1:lx, lb , lty=2)
lines(nx1:lx, ub , lty=2)
lines(x, lwd=2)
lines(nx1:lx, forecast$pred , lwd=2 , col ='white')
box()
par(opar)
dev.off()
prob.dec <- array(NA, dim=fx)
prob.sdec <- array(NA, dim=fx)
prob.ldec <- array(NA, dim=fx)
prob.pval <- array(NA, dim=fx)
perf.pe <- array(0, dim=fx)
perf.spe <- array(0, dim=fx)
perf.scalederr <- array(0, dim=fx)
perf.mase <- array(0, dim=fx)
perf.mase1 <- array(0, dim=fx)
perf.mape <- array(0, dim=fx)
perf.smape <- array(0, dim=fx)
perf.mape1 <- array(0, dim=fx)
perf.smape1 <- array(0,dim=fx)
perf.se <- array(0, dim=fx)
perf.mse <- array(0, dim=fx)
perf.mse1 <- array(0, dim=fx)
perf.rmse <- array(0, dim=fx)
perf.scaleddenom <- 0
for (i in 2:fx) {
perf.scaleddenom = perf.scaleddenom + abs(x[nx+i] - x[nx+i-1])
}
perf.scaleddenom = perf.scaleddenom / (fx-1)
for (i in 1:fx) {
locSD <- (ub[i] - forecast$pred[i]) / 1.96
perf.scalederr[i] = (x[nx+i] - forecast$pred[i]) / perf.scaleddenom
perf.pe[i] = (x[nx+i] - forecast$pred[i]) / x[nx+i]
perf.spe[i] = 2*(x[nx+i] - forecast$pred[i]) / (x[nx+i] + forecast$pred[i])
perf.se[i] = (x[nx+i] - forecast$pred[i])^2
prob.dec[i] = pnorm((x[nx+i-1] - forecast$pred[i]) / locSD)
prob.sdec[i] = pnorm((x[nx+i-par5] - forecast$pred[i]) / locSD)
prob.ldec[i] = pnorm((x[nx] - forecast$pred[i]) / locSD)
prob.pval[i] = pnorm(abs(x[nx+i] - forecast$pred[i]) / locSD)
}
perf.mape[1] = abs(perf.pe[1])
perf.smape[1] = abs(perf.spe[1])
perf.mape1[1] = perf.mape[1]
perf.smape1[1] = perf.smape[1]
perf.mse[1] = perf.se[1]
perf.mase[1] = abs(perf.scalederr[1])
perf.mase1[1] = perf.mase[1]
for (i in 2:fx) {
perf.mape[i] = perf.mape[i-1] + abs(perf.pe[i])
perf.mape1[i] = perf.mape[i] / i
perf.smape[i] = perf.smape[i-1] + abs(perf.spe[i])
perf.smape1[i] = perf.smape[i] / i
perf.mse[i] = perf.mse[i-1] + perf.se[i]
perf.mse1[i] = perf.mse[i] / i
perf.mase[i] = perf.mase[i-1] + abs(perf.scalederr[i])
perf.mase1[i] = perf.mase[i] / i
}
perf.rmse = sqrt(perf.mse1)
bitmap(file='test2.png')
plot(forecast$pred, pch=19, type='b',main='ARIMA Extrapolation Forecast', ylab='Forecast and 95% CI', xlab='time',ylim=c(min(lb),max(ub)))
dum <- forecast$pred
dum[1:par1] <- x[(nx+1):lx]
lines(dum, lty=1)
lines(ub,lty=3)
lines(lb,lty=3)
dev.off()
load(file='createtable')
a<-table.start()
a<-table.row.start(a)
a<-table.element(a,'Univariate ARIMA Extrapolation Forecast',9,TRUE)
a<-table.row.end(a)
a<-table.row.start(a)
a<-table.element(a,'time',1,header=TRUE)
a<-table.element(a,'Y[t]',1,header=TRUE)
a<-table.element(a,'F[t]',1,header=TRUE)
a<-table.element(a,'95% LB',1,header=TRUE)
a<-table.element(a,'95% UB',1,header=TRUE)
a<-table.element(a,'p-value
(H0: Y[t] = F[t])',1,header=TRUE)
a<-table.element(a,'P(F[t]>Y[t-1])',1,header=TRUE)
a<-table.element(a,'P(F[t]>Y[t-s])',1,header=TRUE)
mylab <- paste('P(F[t]>Y[',nx,sep='')
mylab <- paste(mylab,'])',sep='')
a<-table.element(a,mylab,1,header=TRUE)
a<-table.row.end(a)
for (i in (nx-par5):nx) {
a<-table.row.start(a)
a<-table.element(a,i,header=TRUE)
a<-table.element(a,x[i])
a<-table.element(a,'-')
a<-table.row.end(a)
}
for (i in 1:fx) {
a<-table.row.start(a)
a<-table.element(a,nx+i,header=TRUE)
a<-table.element(a,round(x[nx+i],4))
a<-table.element(a,round(forecast$pred[i],4))
a<-table.element(a,round(lb[i],4))
a<-table.element(a,round(ub[i],4))
a<-table.element(a,round((1-prob.pval[i]),4))
a<-table.element(a,round((1-prob.dec[i]),4))
a<-table.element(a,round((1-prob.sdec[i]),4))
a<-table.element(a,round((1-prob.ldec[i]),4))
a<-table.row.end(a)
}
a<-table.end(a)
table.save(a,file='mytable.tab')
a<-table.start()
a<-table.row.start(a)
a<-table.element(a,'Univariate ARIMA Extrapolation Forecast Performance',10,TRUE)
a<-table.row.end(a)
a<-table.row.start(a)
a<-table.element(a,'time',1,header=TRUE)
a<-table.element(a,'% S.E.',1,header=TRUE)
a<-table.element(a,'PE',1,header=TRUE)
a<-table.element(a,'MAPE',1,header=TRUE)
a<-table.element(a,'sMAPE',1,header=TRUE)
a<-table.element(a,'Sq.E',1,header=TRUE)
a<-table.element(a,'MSE',1,header=TRUE)
a<-table.element(a,'RMSE',1,header=TRUE)
a<-table.element(a,'ScaledE',1,header=TRUE)
a<-table.element(a,'MASE',1,header=TRUE)
a<-table.row.end(a)
for (i in 1:fx) {
a<-table.row.start(a)
a<-table.element(a,nx+i,header=TRUE)
a<-table.element(a,round(perc.se[i],4))
a<-table.element(a,round(perf.pe[i],4))
a<-table.element(a,round(perf.mape1[i],4))
a<-table.element(a,round(perf.smape1[i],4))
a<-table.element(a,round(perf.se[i],4))
a<-table.element(a,round(perf.mse1[i],4))
a<-table.element(a,round(perf.rmse[i],4))
a<-table.element(a,round(perf.scalederr[i],4))
a<-table.element(a,round(perf.mase1[i],4))
a<-table.row.end(a)
}
a<-table.end(a)
table.save(a,file='mytable1.tab')